



1. Introduction
Predicting the rheology of capsule suspensions is of practical importance in a wide range of medical and engineering applications. The specific viscosity of particle suspensions increases linearly with the volume fraction of particles for dilute suspensions. For rigid sphere suspensions, the specific viscosity is given by
 ${\it\mu}_{sp}=2.5{\it\phi}$
, where
 ${\it\phi}$
is the volume fraction (Einstein Reference Einstein1906). The specific viscosity of a dilute suspension of capsules was derived by Barthès-Biesel & Rallison (Reference Barthès-Biesel and Rallison1981) and Barthès-Biesel & Chhim (Reference Barthès-Biesel and Chhim1981), under the assumption of small deformation. Second-order theory (Barthès-Biesel & Chhim Reference Barthès-Biesel and Chhim1981) predicted the shear-thinning behaviour of the shear viscosity. Such a shear-thinning behaviour has also been confirmed for large deformations by numerical simulations (Pozrikidis Reference Pozrikidis1995; Ramanujan & Pozrikidis Reference Ramanujan and Pozrikidis1998; Bagchi & Kalluri Reference Bagchi and Kalluri2010; Clausen & Aidun Reference Clausen and Aidun2010). Ramanujan & Pozrikidis (Reference Ramanujan and Pozrikidis1998) investigated the effect of internal viscosity (the viscosity ratio between the internal and external liquids,
 ${\it\lambda}$
) and found that the shear viscosity reaches a minimum at an intermediate value of
 ${\it\lambda}$
. Bagchi & Kalluri (Reference Bagchi and Kalluri2010) extended this study to a large parameter space and showed that such a minimum shear stress is caused by the interplay of elastic and viscous contributions. They also explained that a smaller elastic contribution at larger viscosity ratio results from smaller deformation and lower orientation of each capsule. Whereas the first normal stress difference is zero for dilute suspensions of rigid spheres, a positive value is predicted for that of capsule suspensions in the theoretical and numerical studies mentioned above.
Although until recently there have been few numerical simulations of dense capsule suspensions due to high computational costs, several groups have successfully simulated a few hundred capsules using advanced computer architectures and methods (Clausen, Reasor & Aidun Reference Clausen, Reasor and Aidun2010; Veerapaneni et al. Reference Veerapaneni, Rahimian, Biros and Zorin2011; Matsunaga et al. Reference Matsunaga, Imai, Omori, Ishikawa and Yamaguchi2014). Clausen, Reasor & Aidun (Reference Clausen, Reasor and Aidun2011) first analysed the rheology of dense capsule suspensions with a volume fraction up to 0.4. The specific viscosity increases nonlinearly with volume fraction, similar to rigid spheres (Krieger & Dougherty Reference Krieger and Dougherty1959; Batchelor & Green Reference Batchelor and Green1972) and drops (Loewenberg & Hinch Reference Loewenberg and Hinch1996; Zinchenko & Davis Reference Zinchenko and Davis2000). They showed that the shear-thinning behaviour of the shear viscosity is pronounced in high volume fractions. In the case of rigid spheres, the anisotropy in the particle configuration results in a negative value for the first normal stress difference for dense suspensions. However, due to the capsule orientation in the flow direction, capsule suspensions still have a positive first normal stress difference for dense suspensions, similar to drops (Loewenberg & Hinch Reference Loewenberg and Hinch1996; Zinchenko & Davis Reference Zinchenko and Davis2000). More recently, other numerical studies on dense suspensions have also been reported, for example, the self-diffusion of spherical capsules (Tan, Le & Chiam Reference Tan, Le and Chiam2012) and the transition from tumbling to tank-treading motion of red blood cells (Kruger et al. Reference Kruger, Gross, Raabe and Varnik2013). Gross, Kruger & Varnik (Reference Gross, Kruger and Varnik2014) simulated suspensions of red blood cells with a volume fraction up to 0.9, and demonstrated that the shear viscosity is insensitive to the tumbling-to-tank-treading transition of the cells. They also proposed a semi-empirical equation to predict the shear stress of red blood cell suspensions, taking jamming and confinement effects into account.
For dense suspensions of rigid particles, linear or quadratic equations (Einstein Reference Einstein1906; Batchelor & Green Reference Batchelor and Green1972) fail to predict the viscosity of suspensions even at relatively small volume fractions, and empirical equations have been proposed (Krieger & Dougherty Reference Krieger and Dougherty1959). However, it remains unclear whether high-order effects are still large even if particles have deformability. The first objective of this study is to clarify the effects of the first-, second- and higher-order terms on the specific viscosity and the normal stress difference. We simulate a dense suspension of spherical capsules in simple shear flow in the Stokes flow regime. The behaviour of neo-Hookean capsules is simulated for a volume fraction up to 0.4 by the boundary element method with multipole expansion. The second objective is to clarify the relationship between the deformation and orientation of capsules and the bulk suspension rheology. Because of hydrodynamic interaction between capsules, the extent of deformation and the orientation of each capsule changes with the volume fraction, and both of them affect the suspension rheology. We quantify the effects of these factors on the specific viscosity and the normal stress difference using the stresslet tensor.
2. Problem statement
Consider
 $M$
capsules with radius
 $a$
suspended in a triply periodic flow field under simple shear flow of shear rate
 $\dot{{\it\gamma}}$
. Both the internal and external fluids of the capsules have equal viscosity
 ${\it\mu}$
and density
 ${\it\rho}$
. The capsule membrane is modelled as a hyperelastic sheet, with a surface shear elastic modulus
 $G_{s}$
and negligible bending resistance. The particle Reynolds number
 $Re_{p}={\it\rho}\dot{{\it\gamma}}a^{2}/{\it\mu}$
is assumed to be sufficiently small to treat the velocity field as a Stokes flow. The capillary number is defined as
 $$\begin{eqnarray}Ca=\frac{{\it\mu}\dot{{\it\gamma}}a}{G_{s}},\end{eqnarray}$$
to describe the strength of the viscous force compared with the elastic stiffness of the capsule membrane.
2.1. Fluid mechanics
The velocity of the Stokes flow at a given observation point
 $\boldsymbol{x}$
is described by the boundary integral formulation (Pozrikidis Reference Pozrikidis1992):
 $$\begin{eqnarray}\boldsymbol{v}(\boldsymbol{x})=\boldsymbol{v}^{\infty }(\boldsymbol{x})-\frac{1}{8{\rm\pi}{\it\mu}}\mathop{\sum }_{m}^{M}\int _{A_{m}}\unicode[STIX]{x1D645}^{E}\boldsymbol{\cdot }\boldsymbol{q}(\boldsymbol{y})\,\text{d}A(\boldsymbol{y}),\end{eqnarray}$$
where
 $\boldsymbol{v}^{\infty }$
is the undisturbed flow,
 $A$
is the capsule surface, and
 $\boldsymbol{q}$
is the traction jump across the membrane.
 $\unicode[STIX]{x1D645}^{E}$
is the Green’s function over a triply periodic lattice, derived by Beenakker (Reference Beenakker1986) as
 $$\begin{eqnarray}\displaystyle & \displaystyle \unicode[STIX]{x1D611}_{ij}^{E}=\mathop{\sum }_{{\it\gamma}}\unicode[STIX]{x1D611}_{ij}^{E_{I}}(\boldsymbol{r}_{{\it\gamma}})+\frac{8{\rm\pi}}{V}\mathop{\sum }_{{\it\lambda}\neq 0}\unicode[STIX]{x1D611}_{ij}^{E_{II}}(\boldsymbol{k}_{{\it\lambda}}), & \displaystyle\end{eqnarray}$$
 $$\begin{eqnarray}\displaystyle & \displaystyle \unicode[STIX]{x1D611}_{ij}^{E_{I}}=\frac{{\it\delta}_{ij}}{r}E_{1}+\frac{r_{i}r_{j}}{r^{3}}E_{2}, & \displaystyle\end{eqnarray}$$
 $$\begin{eqnarray}\displaystyle & \displaystyle \unicode[STIX]{x1D611}_{ij}^{E_{II}}=\left(\frac{{\it\delta}_{ij}}{k^{2}}-\frac{k_{i}k_{j}}{k^{4}}\right)\left(1+\frac{k^{2}}{4{\it\xi}^{2}}+\frac{k^{4}}{8{\it\xi}^{4}}\right)\exp \left(-\frac{k^{2}}{4{\it\xi}^{2}}\right)\cos (\boldsymbol{k}\boldsymbol{\cdot }\boldsymbol{r}), & \displaystyle\end{eqnarray}$$
 $$\begin{eqnarray}\displaystyle & \displaystyle E_{1}=\text{erfc}({\it\xi}r)+\frac{\exp (-{\it\xi}^{2}r^{2})}{\sqrt{{\rm\pi}}}(4{\it\xi}^{3}r^{3}-6{\it\xi}r), & \displaystyle\end{eqnarray}$$
 $$\begin{eqnarray}\displaystyle & \displaystyle E_{2}=\text{erfc}({\it\xi}r)+\frac{\exp (-{\it\xi}^{2}r^{2})}{\sqrt{{\rm\pi}}}(2{\it\xi}r-4{\it\xi}^{3}r^{3}). & \displaystyle\end{eqnarray}$$
 ${\it\gamma}$
is the index of periodic boxes,
 ${\it\lambda}$
is the index of reciprocal vectors,
 ${\it\xi}$
is the convergence parameter,
 $V$
is the volume of the unit lattice,
 $\boldsymbol{k}$
is the reciprocal vector,
 $\boldsymbol{r}=\boldsymbol{x}-\boldsymbol{y}$
is the vector from the source point
 $\boldsymbol{y}$
to the observation point
 $\boldsymbol{x}$
,
 $k=|\boldsymbol{k}|$
, and
 $r=|\boldsymbol{r}|$
.
2.2. Membrane mechanics
The membrane is modelled as an isotropic and hyperelastic material that follows the neo-Hookean constitutive law. The surface deformation gradient tensor
 $\unicode[STIX]{x1D641}_{s}$
is given by
 $$\begin{eqnarray}\text{d}\boldsymbol{x}=\unicode[STIX]{x1D641}_{s}\boldsymbol{\cdot }\text{d}\boldsymbol{X},\end{eqnarray}$$
where
 $\boldsymbol{X}$
and
 $\boldsymbol{x}$
are the membrane material points of the reference and deformed states, respectively. The Cauchy stress tensor
 $\unicode[STIX]{x1D64F}$
is
 $$\begin{eqnarray}\unicode[STIX]{x1D64F}=\frac{1}{J_{s}}\unicode[STIX]{x1D641}_{s}\boldsymbol{\cdot }\frac{\partial w_{s}}{\partial \unicode[STIX]{x1D65A}}\boldsymbol{\cdot }\unicode[STIX]{x1D641}_{s}^{\text{T}},\end{eqnarray}$$
where
 $J_{s}={\it\lambda}_{1}{\it\lambda}_{2}$
represents the area dilation ratio,
 $\unicode[STIX]{x1D65A}$
is the Green–Lagrange strain tensor,
 $$\begin{eqnarray}\unicode[STIX]{x1D65A}={\textstyle \frac{1}{2}}\left(\unicode[STIX]{x1D641}_{s}^{\text{T}}\boldsymbol{\cdot }\unicode[STIX]{x1D641}_{s}-\unicode[STIX]{x1D644}_{s}\right),\end{eqnarray}$$
and
 $\unicode[STIX]{x1D644}_{s}$
is the surface identity tensor. The strain energy function
 $w_{s}$
of the neo-Hookean constitutive law is
 $$\begin{eqnarray}w_{s}=\frac{G_{s}}{2}\left({\it\lambda}_{1}^{2}+{\it\lambda}_{2}^{2}-3+\frac{1}{{\it\lambda}_{1}^{2}{\it\lambda}_{2}^{2}}\right),\end{eqnarray}$$
where
 $G_{s}$
is the surface shear elastic modulus, and
 ${\it\lambda}_{1}$
and
 ${\it\lambda}_{2}$
are the principal extension ratios (Pozrikidis Reference Pozrikidis2003).
3. Numerical method
We use a numerical method developed by Walter et al. (Reference Walter, Salsac, Barthès-Biesel and Le Tallec2010), in which the boundary element method for fluid mechanics is coupled with the finite element method for membrane mechanics. An unstructured triangular mesh generated by recursive subdivision of an icosahedron is used to discretise a single capsule membrane.
The weak form of the equilibrium condition on the capsule,
 $$\begin{eqnarray}\int _{A}\hat{\boldsymbol{u}}\boldsymbol{\cdot }\boldsymbol{q}\,\text{d}A=\int _{A}\hat{{\bf\varepsilon}}\boldsymbol{ : }\unicode[STIX]{x1D64F}\,\text{d}a,\end{eqnarray}$$
is solved by the finite element method, where
 $\hat{\boldsymbol{u}}$
is the virtual displacement, and
 $\hat{{\bf\varepsilon}}$
is the virtual strain.
Equation (2.2) is solved by the boundary element method with the multipole expansion. The Gaussian quadrature method is used to compute the surface integrals in the boundary element method. For singular elements, polar coordinates are introduced to remove the
 $1/r$
singularity (Pozrikidis Reference Pozrikidis1995). The velocity of the material point of the membrane is given by the kinematic condition:
 $$\begin{eqnarray}\frac{\text{d}\boldsymbol{x}}{\text{d}t}=\boldsymbol{v}(\boldsymbol{x}).\end{eqnarray}$$
The explicit second-order Runge–Kutta method is used to update the position. A volume constraint (Freund Reference Freund2007) is implemented in order to avoid the accumulation of a small error in the volume. In our simulation, the volume error is always kept to less than
 $1.0\times 10^{-3}\,\%$
. Graphics processing unit (GPU) computing is also utilised to accelerate the computation by 10–100 fold compared with that provided by conventional CPU computing (Matsunaga et al.
Reference Matsunaga, Imai, Omori, Ishikawa and Yamaguchi2014).
3.1. Multipole expansion
Although a fine mesh (computational mesh with sufficiently small size of elements) is required for resolving the disturbed velocity generated by near-field forces, the velocity due to far-field forces can be coarse-grained using a multipole expansion (Durlofsky & Brady Reference Durlofsky and Brady1989; Pozrikidis Reference Pozrikidis1992) or fast multipole method (Greengard & Rokhlin Reference Greengard and Rokhlin1987; Ying, Biros & Zorin Reference Ying, Biros and Zorin2004). In this study, we used multipole expansion with patches consisting of a group of elements (Zinchenko & Davis Reference Zinchenko and Davis2005).
When the membrane of a capsule is composed of
 $P$
patches, (2.2) is rewritten as
 $$\begin{eqnarray}\displaystyle & \displaystyle v_{i}(\boldsymbol{x})={v_{i}}^{\infty }(\boldsymbol{x})-\frac{1}{8{\rm\pi}{\it\mu}}\mathop{\sum }_{m}^{M}\mathop{\sum }_{p}^{P}\left\{\unicode[STIX]{x1D611}_{ij}^{E}F_{j}^{mp}+R_{ij}^{E}L_{j}^{mp}+K_{ijk}^{E}\unicode[STIX]{x1D61A}_{jk}^{mp}+O(r^{-3})\right\}, & \displaystyle\end{eqnarray}$$
 $$\begin{eqnarray}\displaystyle & \displaystyle F_{i}^{mp}=\int _{A^{mp}}q_{i}(\boldsymbol{y})\,\text{d}A(\boldsymbol{y}), & \displaystyle\end{eqnarray}$$
 $$\begin{eqnarray}\displaystyle & \displaystyle L_{i}^{mp}=\int _{A^{mp}}{\it\varepsilon}_{ijk}\hat{r}_{j}q_{k}\,\text{d}A(\boldsymbol{y}), & \displaystyle\end{eqnarray}$$
 $$\begin{eqnarray}\displaystyle & \displaystyle \unicode[STIX]{x1D61A}_{ij}^{mp}=\frac{1}{2}\int _{A^{mp}}\left\{\hat{r}_{i}q_{j}(\boldsymbol{y})+\hat{r}_{j}q_{i}(\boldsymbol{y})-\frac{2}{3}{\it\delta}_{ij}\hat{r}_{k}q_{k}(\boldsymbol{y})\right\}\,\text{d}A(\boldsymbol{y}), & \displaystyle\end{eqnarray}$$
 $\boldsymbol{F}^{mp}$
is the point force,
 $\boldsymbol{L}^{mp}$
is the torque,
 $\unicode[STIX]{x1D64E}^{mp}$
is the stresslet,
 $A^{mp}$
is the surface area of the
 $p$
th patch of the
 $m$
th capsule, and
 $\hat{\boldsymbol{r}}$
is the vector from the centre of patch
 $p$
to the observation point
 $\boldsymbol{x}$
. The two propagators are given by
 $$\begin{eqnarray}\displaystyle & \displaystyle R_{ij}^{E}={\textstyle \frac{1}{4}}{\it\varepsilon}_{kjl}({\rm\nabla}_{k}\unicode[STIX]{x1D611}_{ij}^{E}-{\rm\nabla}_{k}\unicode[STIX]{x1D611}_{ij}^{E}), & \displaystyle\end{eqnarray}$$
 $$\begin{eqnarray}\displaystyle & \displaystyle K_{ijk}^{E}={\textstyle \frac{1}{2}}\left({\rm\nabla}_{k}\unicode[STIX]{x1D611}_{ij}^{E}+{\rm\nabla}_{j}\unicode[STIX]{x1D611}_{ik}^{E}\right). & \displaystyle\end{eqnarray}$$
In this study, the fine mesh was constructed of 5120 triangular elements (2562 nodes) and a mesh convergence test is given in the appendix, § A.1. A patch consisted of a group of triangular elements; for example, a patch has
 $5120/80=64$
elements when
 $P=80$
. We investigate the accuracy of the multipole expansion to determine the level of coarse-graining. For this test problem, the velocity generated by a single capsule is computed under simple shear flow, where
 $x_{1}$
is the flow direction,
 $x_{2}$
is the vorticity direction and
 $x_{3}$
is the velocity gradient direction. The velocity observation points are placed at distances of
 $r/a$
away from the capsule centroid in the
 $x_{1}$
-,
 $x_{2}$
-, and
 $x_{3}$
-directions. The reference solution of the disturbed velocity due to a capsule is given by
 $$\begin{eqnarray}v_{i}^{ref}=-\frac{1}{8{\rm\pi}{\it\mu}}\int _{A}\unicode[STIX]{x1D611}_{ij}q_{j}\,\text{d}A,\end{eqnarray}$$
where
 $\unicode[STIX]{x1D645}$
is the free-space Green’s function. The reference solution is computed with an integral of 5120 fine elements using the Gaussian quadrature method. The reference velocity is compared with the coarse-grained solution:
 $$\begin{eqnarray}v_{i}^{cg}=-\frac{1}{8{\rm\pi}{\it\mu}}\mathop{\sum }_{p}^{P}\left\{\unicode[STIX]{x1D611}_{ij}F_{j}^{p}+R_{ij}L_{j}^{p}+K_{ijk}\unicode[STIX]{x1D61A}_{jk}^{p}\right\},\end{eqnarray}$$
for different numbers of patches from 1 (the point stresslet) to 1280. The error is defined by
 $$\begin{eqnarray}{\it\varepsilon}=\frac{|\boldsymbol{v}^{cg}-\boldsymbol{v}^{ref}|}{|\boldsymbol{v}^{ref}|}.\end{eqnarray}$$
Figure 1 shows the average error for the three directions, as a function of the non-dimensional distance
 $r/a$
. Because the magnitude of the disturbed velocity
 $|\boldsymbol{v}|$
decays as
 $O(r^{-2})$
and
 $|\boldsymbol{v}^{cg}-\boldsymbol{v}^{ref}|\approx O(r^{-3})$
, the error decays as
 $O(r^{-1})$
. For the efficiency of the computation, the fine-mesh integral of 5120 elements using the Gaussian quadrature method is performed for
 $r/a<3$
, and the coarse-grained integral is set such that
 ${\it\varepsilon}$
is less than
 $1.0\times 10^{-2}$
as follows:
 $$\begin{eqnarray}P=\left\{\begin{array}{@{}ll@{}}\text{80} & (3\leqslant r/a<10)\\ \text{20} & (10\leqslant r/a).\end{array}\right.\end{eqnarray}$$
Error arising from the multipole expansion as a function of the distance from the centre of a capsule. The motion of a capsule in simple shear flow is simulated for capillary number (a)
 $Ca=0.1$
and (b) 0.5.

Snapshots of numerical results for the volume fraction (a)
 ${\it\phi}=0.10$
, (b) 0.20, (c) 0.30, and (d) 0.40. The capillary number is
 $Ca=0.3$
. Bright cubic regions show the original unit domain, and the dark region shows Ewald periodic images. Note that periodic boxes around the original domain are moving with the applied shear.

4. Results
We examine volume fractions up to
 ${\it\phi}=0.4$
, and six values of the capillary number from
 $Ca=0.1$
to 0.6. There are
 $M=100$
capsules per original unit domain, and the size of the domain is varied to give a specified volume fraction (figure 2). Effects of the capsule initial positions and the number of capsules per unit domain are evaluated in §§ A.2 and A.3. A single capsule under unbounded shear flow is also simulated as the dilute limit (
 ${\it\phi}\ll 1$
).
(a) Ensemble average of Taylor parameter
 $D$
and its slope, and (b) its standard deviation
 ${\it\sigma}_{D}$
, as a function of the volume fraction
 ${\it\phi}$
, where
 ${\it\phi}=0$
represents the dilute limit.

(a) Ensemble average of the orientation angle
 ${\it\theta}_{D}$
and it slope, and (b) its standard deviation
 ${\it\sigma}_{{\it\theta}_{D}}$
as a function of the volume fraction
 ${\it\phi}$
.

4.1. Deformation and orientation
The effect of the volume fraction on the deformation of capsules is quantified by the ensemble average of the Taylor parameter,
 $$\begin{eqnarray}\langle D\rangle =\frac{1}{NM}\mathop{\sum }_{n}^{N}\mathop{\sum }_{m}^{M}D_{m}^{n},\end{eqnarray}$$
where
 $N$
and
 $M$
are the number of time steps and capsules, respectively, and
 $D$
is the Taylor parameter,
 $$\begin{eqnarray}D=\frac{|L_{1}-L_{2}|}{L_{1}+L_{2}},\end{eqnarray}$$
where
 $L_{1}$
and
 $L_{2}$
are the lengths of the major and minor axes of the deformed capsule. The time average starts after non-dimensional time
 $\dot{{\it\gamma}}t=10$
to exclude the transient phase, and stops at
 $\dot{{\it\gamma}}t=100$
. Note that ensemble averages of other variables are calculated in a similar manner.
Figure 3 shows that the deformation increases as the volume fraction increases for all capillary numbers. This trend is qualitatively similar to two-dimensional (Li, Charles & Pozrikidis Reference Li, Charles and Pozrikidis1996) and three-dimensional (Loewenberg & Hinch Reference Loewenberg and Hinch1996) analyses of drop suspensions. Capsules at
 ${\it\phi}=0.3$
deform 5 % (
 $Ca=0.5$
) and 38 % (
 $Ca=0.1$
) more than those at the dilute limit. Due to the complex interaction between the capsules, each capsule has a different instantaneous deformation compared with the others, resulting in a larger deviation for larger volume fractions. Also, note that the Taylor parameter can be predicted by a linear function in the volume fraction range and for the capillary number considered; the lower capillary number has a larger slope.
The ensemble average of the capsule orientation angle
 ${\it\theta}_{D}$
and its standard deviation
 ${\it\sigma}_{{\it\theta}_{D}}$
is presented in figure 4, where
 ${\it\theta}_{D}$
is defined as the angle between the major principal axis of the capsule and the flow direction
 $x_{1}$
. The orientation angle decreases as the volume fraction increases, and exhibits a
 $3.0^{\circ }{-}4.0^{\circ }$
smaller angle than the dilute limit for
 ${\it\phi}=0.30$
. This trend is qualitatively similar to capsule suspensions (Clausen et al.
Reference Clausen, Reasor and Aidun2011), vesicle suspensions (Zhao & Shaqfeh Reference Zhao and Shaqfeh2013) and drop suspensions (Li et al.
Reference Li, Charles and Pozrikidis1996; Loewenberg & Hinch Reference Loewenberg and Hinch1996). The change in the orientation angle is a nearly linear function of the volume fraction for the conditions considered.
4.2. Viscosity and normal stress difference
Stress due to the presence of capsules is evaluated using a particle stress tensor
 ${\it\bf\Sigma}^{(p)}$
(Batchelor Reference Batchelor1970):
 $$\begin{eqnarray}\displaystyle & \displaystyle {\it\bf\Sigma}^{(p)}=n_{c}\langle \unicode[STIX]{x1D64E}\rangle , & \displaystyle\end{eqnarray}$$
 $$\begin{eqnarray}\displaystyle & \displaystyle \unicode[STIX]{x1D64E}=\int _{A}\frac{1}{2}(\boldsymbol{x}\otimes \boldsymbol{q}+\boldsymbol{q}\otimes \boldsymbol{x})\,\text{d}A, & \displaystyle\end{eqnarray}$$
 $n_{c}$
is the number density of capsules, and
 $\unicode[STIX]{x1D64E}$
is the stresslet. The specific viscosity
 ${\it\mu}_{sp}$
measures the increase in viscosity due to the particle shear stress
 ${\it\Sigma}_{12}^{(p)}$
:
 $$\begin{eqnarray}{\it\mu}_{sp}=\frac{{\it\Sigma}_{12}^{(p)}}{{\it\mu}\dot{{\it\gamma}}}=\frac{3{\it\phi}}{4{\rm\pi}Ca}\frac{\langle \unicode[STIX]{x1D61A}_{12}\rangle }{G_{s}a^{2}}.\end{eqnarray}$$
Figure 5(a) shows that the specific viscosity increases nonlinearly with the volume fraction. The specific viscosity of particulate suspensions is often described by a polynomial equation of the volume fraction
 ${\it\phi}$
as
 $$\begin{eqnarray}{\it\mu}_{sp}=a_{1}{\it\phi}+a_{2}{\it\phi}^{2}+a_{3}{\it\phi}^{3}+\cdots \,,\end{eqnarray}$$
where
 $a_{i}$
is the coefficient of the
 $i$
th-order term. For instance, Einstein (Reference Einstein1906) derived the first coefficient as
 $a_{1}=2.5$
for a dilute suspension of rigid spheres, and Batchelor & Green (Reference Batchelor and Green1972) extended the polynomial to the semi-dilute suspension.
(a) Specific viscosity
 ${\it\mu}_{sp}$
as a function of the volume fraction
 ${\it\phi}$
. The grey dotted lines represent
 $a_{1}{\it\phi}+a_{2}{\it\phi}^{2}$
, and the black solid line is the specific viscosity of a rigid sphere suspension (Krieger & Dougherty Reference Krieger and Dougherty1959). (b) The coefficients
 $a_{i}$
of polynomial equation (4.6) as a function of the capillary number
 $Ca$
.

The coefficients
 $a_{1}$
and
 $a_{2}$
evaluated for capsule suspensions are shown in figure 5(b). The first coefficient is obtained from the results of the dilute limit, whereas the second coefficient is given by a least-squares fitting to plots of
 $({\it\mu}_{sp}-a_{1}{\it\phi})$
. We tested the least-squares fitting for different ranges of volume fraction, and confirmed that
 $a_{2}$
converged well when we set the range as
 $0\leqslant {\it\phi}\leqslant 0.10$
. The results are compared with an empirical expression for the suspension of rigid spheres (Krieger & Dougherty Reference Krieger and Dougherty1959):
 $$\begin{eqnarray}{\it\mu}_{sp}({\it\phi})=\left(1-\frac{{\it\phi}}{{\it\phi}_{m}}\right)^{-2.5{\it\phi}_{m}}-1,\end{eqnarray}$$
where
 ${\it\phi}_{m}$
is the maximum packing fraction, and a Taylor series expansion around
 ${\it\phi}=0$
gives
 $$\begin{eqnarray}a_{i}=\mathop{\prod }_{n=1}^{i}\left\{\frac{1}{n}\left(\frac{5}{2}+\frac{n-1}{{\it\phi}_{m}}\right)\right\},\end{eqnarray}$$
where
 $\prod$
is the product operator. When the maximum packing fraction is assumed to be
 ${\it\phi}_{m}=0.63$
for random close packing (Onoda & Liniger Reference Onoda and Liniger1990), the coefficients for rigid sphere suspensions are given by
 $a_{1}=2.5$
and
 $a_{2}\approx 5.1$
. Figure 5(b) shows that the coefficients
 $a_{1}$
and
 $a_{2}$
become smaller for a larger capillary number, and
 $a_{2}$
decreases more rapidly than
 $a_{1}$
.
Ratios of (a)
 $a_{1}{\it\phi}$
and (b)
 $a_{1}{\it\phi}+a_{2}{\it\phi}^{2}$
to the specific viscosity
 ${\it\mu}_{sp}$
.

To clarify the effects of the first-, second- and higher-order terms
 $O({\it\phi}^{3})$
on the specific viscosity,
 $a_{1}{\it\phi}$
and
 $(a_{1}{\it\phi}+a_{2}{\it\phi}^{2})$
are shown in figure 6. The contribution of the low-order terms is significantly larger for capsule suspensions than rigid sphere suspensions, and a larger contribution is found for a higher capillary number. In addition, the
 $a_{1}{\it\phi}$
term accounts for a larger percentage for a higher capillary number. In the case of rigid sphere suspensions, the effect of
 $O({\it\phi}^{3})$
terms cannot be ignored even for a low volume fraction; for example,
 $O({\it\phi}^{3})$
terms account for approximately 15 % and 50 % of
 ${\it\mu}_{sp}$
at
 ${\it\phi}=0.2$
and
 $0.4$
, respectively. For capsule suspensions, however, the effect of
 $O({\it\phi}^{3})$
terms is much smaller; for example, the percentages of
 $O({\it\phi}^{3})$
terms are approximately 2 % and 8 % at
 ${\it\phi}=0.2$
and
 ${\it\phi}=0.4$
even for the lowest capillary number examined,
 $Ca=0.1$
. Higher-order effect could be ignored even for a dense suspension when the capillary number is sufficiently high.
We also analysed the normal stress difference. The first and second normal stress differences are defined by
 $$\begin{eqnarray}\displaystyle & \displaystyle \frac{N_{1}}{{\it\mu}\dot{{\it\gamma}}}=\frac{{\it\Sigma}_{11}^{(p)}-{\it\Sigma}_{22}^{(p)}}{{\it\mu}\dot{{\it\gamma}}}=\frac{3{\it\phi}}{4{\rm\pi}Ca}\frac{\langle \unicode[STIX]{x1D61A}_{11}-\unicode[STIX]{x1D61A}_{22}\rangle }{G_{s}a^{2}}, & \displaystyle\end{eqnarray}$$
 $$\begin{eqnarray}\displaystyle & \displaystyle \frac{N_{2}}{{\it\mu}\dot{{\it\gamma}}}=\frac{{\it\Sigma}_{22}^{(p)}-{\it\Sigma}_{33}^{(p)}}{{\it\mu}\dot{{\it\gamma}}}=\frac{3{\it\phi}}{4{\rm\pi}Ca}\frac{\langle \unicode[STIX]{x1D61A}_{22}-\unicode[STIX]{x1D61A}_{33}\rangle }{G_{s}a^{2}}. & \displaystyle\end{eqnarray}$$
 $N_{1}$
increases, while the second normal stress difference
 $N_{2}$
is negative and its magnitude increases with the volume fraction. This trend is similar to that observed in previous studies of capsule (Clausen et al.
Reference Clausen, Reasor and Aidun2011), vesicle (Zhao & Shaqfeh Reference Zhao and Shaqfeh2013) and drop (Loewenberg & Hinch Reference Loewenberg and Hinch1996) suspensions. When figure 7(c) is compared with figure 5(a), it is found that a higher capillary number case has a lower viscosity but a higher first normal stress difference. This is likely to be due to the orientation of capsules: for higher capillary number, the orientation angle of capsules to the flow direction tends to be smaller, resulting in lower shear stress but higher anisotropy.
Normal stress differences: (a) first normal stress difference
 $N_{1}/{\it\mu}\dot{{\it\gamma}}$
and (b) second normal stress difference
 $N_{2}/{\it\mu}\dot{{\it\gamma}}$
, as a function of the capillary number
 $Ca$
. (c)
 $N_{1}$
as a function of volume fraction. (d) The coefficient
 $b_{i}$
of polynomial equation (4.11) as a function of
 $Ca$
.

Using the same procedure as for the specific viscosity, the coefficients of the polynomial equation,
 $$\begin{eqnarray}\frac{N_{1}}{{\it\mu}\dot{{\it\gamma}}}=b_{1}{\it\phi}+b_{2}{\it\phi}^{2}+b_{3}{\it\phi}^{3}+\cdots \,,\end{eqnarray}$$
are calculated as shown in figure 7(d), and the effects of
 $b_{1}{\it\phi}$
,
 $b_{2}{\it\phi}^{2}$
and
 $O({\it\phi}^{3})$
are presented in figure 8. The contribution of the
 $b_{1}{\it\phi}$
and
 $b_{2}{\it\phi}^{2}$
terms is larger for higher capillary number. When the higher-order effect for
 ${\it\mu}_{sp}$
and
 $N_{1}$
is compared, the ratio of
 $O({\it\phi}^{3})$
terms to
 $N_{1}/{\it\mu}\dot{{\it\gamma}}$
increases with the volume fraction more rapidly than
 ${\it\mu}_{sp}$
. The effects of
 $O({\it\phi}^{3})$
terms for
 $N_{1}$
are approximately 5 % and 19 % at
 ${\it\phi}=0.2$
and
 ${\it\phi}=0.4$
, respectively for
 $Ca=0.1$
, which is a few times larger than that for
 ${\it\mu}_{sp}$
. This is also a consequence of the orientation of capsules.
Ratios of (a)
 $b_{1}{\it\phi}$
and (b)
 $(b_{1}{\it\phi}+b_{2}{\it\phi}^{2})$
to the first normal stress difference
 $N_{1}/{\it\mu}\dot{{\it\gamma}}$
.

4.3. Relationship between the deformation and orientation and the suspension rheology
The shear viscosity and the normal stress difference of a rigid particle suspension are often discussed using the microstructure of the suspension (Guazzelli & Morris Reference Guazzelli and Morris2012). However, in the case of capsule suspensions, the microstructure is greatly affected by the deformation and orientation of the capsules (Clausen et al. Reference Clausen, Reasor and Aidun2011). Here, we discuss the relationship between the deformation and orientation and the suspension rheology.
When the volume fraction of capsules increases, the deformation of the capsules increases while their orientation angle with respect to the flow direction decreases. The increase in the deformation amplifies the amplitude of the particle stress, and both the specific viscosity and the first normal stress difference increase with the volume fraction. The decrease in the orientation angle changes the anisotropy of the suspension, which suppresses the specific viscosity, but further amplifies the first normal stress difference. To quantify the relationship between the deformation and orientation of capsules and the suspension rheology, we analyse the stresslet tensor
 $\unicode[STIX]{x1D64E}$
.
By definition, the specific viscosity is proportional to the shear component of the stresslet tensor
 $\langle \unicode[STIX]{x1D61A}_{12}\rangle$
, and the normal stress difference
 $N_{1}$
is proportional to the difference in the normal components
 $\langle \unicode[STIX]{x1D61A}_{11}-\unicode[STIX]{x1D61A}_{22}\rangle$
. At the dilute limit, the stresslet tensor of each capsule has two eigenvalues in the shear plane and one on the vorticity axis. From the coordinate transformation using the eigenvalues,
 $\unicode[STIX]{x1D61A}_{12}$
and
 $\unicode[STIX]{x1D61A}_{11}-\unicode[STIX]{x1D61A}_{22}$
are given by
 $$\begin{eqnarray}\displaystyle & \displaystyle \unicode[STIX]{x1D61A}_{12}={\textstyle \frac{1}{2}}(\unicode[STIX]{x1D61A}_{1}-\unicode[STIX]{x1D61A}_{2})\sin 2{\it\theta}_{S}, & \displaystyle\end{eqnarray}$$
 $$\begin{eqnarray}\displaystyle & \displaystyle \unicode[STIX]{x1D61A}_{11}-\unicode[STIX]{x1D61A}_{22}=(\unicode[STIX]{x1D61A}_{1}-\unicode[STIX]{x1D61A}_{2})\cos 2{\it\theta}_{S}, & \displaystyle\end{eqnarray}$$
 $\unicode[STIX]{x1D61A}_{1}$
and
 $\unicode[STIX]{x1D61A}_{2}$
are the eigenvalues (the principal stresslets) in the shear plane, and
 ${\it\theta}_{S}$
is the orientation angle of the stresslet, defined as the angle between the eigenvector of
 $\unicode[STIX]{x1D61A}_{1}$
and
 $\boldsymbol{x}_{1}$
. The principal stresslet difference
 $\unicode[STIX]{x1D61A}_{1}-\unicode[STIX]{x1D61A}_{2}$
represents the strength of the stresslet in the shear plane. Equations (4.12) and (4.13) may be valid only for dilute suspensions, because the principal axis of the stresslet tensor of each capsule does not lie in the shear plane for dense suspensions. However, for the ensemble average of the stresslets the following approximations are applicable:
 $$\begin{eqnarray}\displaystyle & \displaystyle \langle \unicode[STIX]{x1D61A}_{12}\rangle \approx {\textstyle \frac{1}{2}}\langle \unicode[STIX]{x1D61A}_{1}-\unicode[STIX]{x1D61A}_{2}\rangle \sin 2\langle {\it\theta}_{S}\rangle , & \displaystyle\end{eqnarray}$$
 $$\begin{eqnarray}\displaystyle & \displaystyle \langle \unicode[STIX]{x1D61A}_{11}-\unicode[STIX]{x1D61A}_{22}\rangle \approx \langle \unicode[STIX]{x1D61A}_{1}-\unicode[STIX]{x1D61A}_{2}\rangle \cos 2\langle {\it\theta}_{S}\rangle . & \displaystyle\end{eqnarray}$$
Comparison of the left- and right-hand sides of (a) equation (4.12) and (b) equation (4.13). Filled symbols show the dilute limit, and arrows indicate the direction from small to large volume fraction. (c) Principal stresslet difference
 $\unicode[STIX]{x1D61A}_{1}-\unicode[STIX]{x1D61A}_{2}$
as a function of the Taylor parameter
 $D$
, and (d) comparison of the two orientation angles
 ${\it\theta}_{D}$
and
 ${\it\theta}_{S}$
.

When the viscosity ratio
 ${\it\lambda}=1$
, the principal stresslet difference is associated with the deformation of the capsules. As shown in figure 9(c), the ensemble average of the principal stresslet difference increases nonlinearly with that of the Taylor parameter, and almost the same relationship holds as in the dilute limit. The orientation angle of the stresslet tensor
 ${\it\theta}_{S}$
is also associated with that of the deformation
 ${\it\theta}_{D}$
(figure 9
d), where the two angles will be identical when the deformed shape becomes a perfect ellipsoid.
(a) Stresslet
 $\unicode[STIX]{x1D61A}_{12}$
and (b) normal stresslet difference
 $\unicode[STIX]{x1D61A}_{11}-\unicode[STIX]{x1D61A}_{22}$
as a function of volume fraction. Grey dotted lines represent
 $1+(a_{2}/a_{1}){\it\phi}$
and
 $1+(b_{2}/b_{1}){\it\phi}$
. (c) Principal stresslet difference
 $\unicode[STIX]{x1D61A}_{1}-\unicode[STIX]{x1D61A}_{2}$
, (d)
 $\sin 2{\it\theta}_{S}$
and (e)
 $\cos 2{\it\theta}_{S}$
as functions of
 ${\it\phi}$
. Note that the superscript
 $sol$
indicates the dilute limit.

The values of
 $\langle \unicode[STIX]{x1D61A}_{12}\rangle$
and
 $\langle \unicode[STIX]{x1D61A}_{11}-\unicode[STIX]{x1D61A}_{22}\rangle$
are presented in figures 10(a) and 10(b) as a function of the volume fraction. As discussed in § 4.2, the effect of higher-order terms on the specific viscosity is small in the conditions examined, and the normal stresslet difference
 $N_{1}$
increases more rapidly than the specific viscosity.
 $\langle \unicode[STIX]{x1D61A}_{12}\rangle$
and
 $\langle \unicode[STIX]{x1D61A}_{11}-\unicode[STIX]{x1D61A}_{22}\rangle$
show the same trend as the specific viscosity and the normal stress difference.
Because the deformation of capsules becomes larger for higher volume fractions, the principal stresslet difference
 $\langle \unicode[STIX]{x1D61A}_{1}-\unicode[STIX]{x1D61A}_{2}\rangle$
is also larger for higher volume fractions as shown in figure 10(c). Although the Taylor parameter increases linearly with the volume fraction for the conditions examined, the principal stresslet difference increases nonlinearly with the volume fraction due to the response of the stresslet to the deformation shown in figure 9(c). The orientation angle of the capsules to the flow direction decreases with the volume fraction. Because
 $\sin \langle 2{\it\theta}_{S}\rangle$
becomes smaller, whereas
 $\cos \langle 2{\it\theta}_{S}\rangle$
is larger, the decrease in the orientation angle has contrasting effects on
 $\langle \unicode[STIX]{x1D61A}_{12}\rangle$
and
 $\langle \unicode[STIX]{x1D61A}_{11}-\unicode[STIX]{x1D61A}_{22}\rangle$
. Figure 10(d) shows that a decrease in
 $\sin \langle 2{\it\theta}_{S}\rangle$
suppresses
 $\langle \unicode[STIX]{x1D61A}_{12}\rangle$
. On the other hand, an increase in
 $\cos \langle 2{\it\theta}_{S}\rangle$
amplifies
 $\langle \unicode[STIX]{x1D61A}_{1}-\unicode[STIX]{x1D61A}_{2}\rangle$
, as shown in figure 10(e); therefore,
 $\langle \unicode[STIX]{x1D61A}_{11}-\unicode[STIX]{x1D61A}_{22}\rangle$
increases with the volume fraction more rapidly than the specific viscosity.
5. Conclusion
The rheology of a dense suspension of spherical capsules was investigated in simple shear flow in the Stokes flow regime. First, the deformation and orientation of the capsules were analysed. The Taylor parameter increases almost linearly with the volume fraction for the conditions examined,
 $Ca\leqslant 0.6$
and
 ${\it\phi}\leqslant 0.4$
. The orientation angle of the capsules with respect to the flow direction decreases almost linearly with the volume fraction. Second, we evaluated the specific viscosity and normal stress difference. To describe the specific viscosity by a polynomial equation of the volume fraction, the coefficients of the equation are calculated using least-squares fitting. The results suggest that the effect of higher-order terms is much smaller for capsule suspensions than rigid sphere suspensions. It is also found that the normal stress difference varies more rapidly with volume fraction than the specific viscosity.
To quantify the relationship between the deformation and orientation of the capsules and the suspension rheology, we analysed the behaviour of the stresslet tensor. The principal stresslet difference increases with increasing deformation of the capsules, and the principal direction of the stresslet changes as the orientation angle of the capsules decreases. Therefore, both the specific viscosity and the normal stress difference increase with the volume fraction in response to the increased deformation, whereas the decreased orientation angle suppresses the specific viscosity, but amplifies the normal stress difference. Similar behaviour of the stresslet tensor is also expected for other types of deformable particle suspensions. Hence, it is important to consider the effect of particle interactions on the deformation and orientation of the particles.
Appendix A. Numerical setup
In order to obtain a proper numerical setup, we checked the effects of the mesh size, the initial positions of capsules, and the number of capsules per unit domain. We compared the Taylor parameter
 $D_{12}$
and the specific viscosity
 ${\it\mu}_{sp}$
for
 $Ca=0.2$
and
 ${\it\phi}=0.3$
. The number of elements per a capsule is
 $N_{E}=5120$
, and the number of capsules per unit domain is
 $M=100$
unless otherwise noted.
Effect of the number of elements per a capsule
 $N_{E}$
on the Taylor parameter
 $\langle D\rangle$
and the specific viscosity
 ${\it\mu}_{sp}$
, where
 ${\it\varepsilon}_{D}$
and
 ${\it\varepsilon}_{{\it\mu}}$
are the errors defined by (A 1) and (A 2), respectively. The parameters are
 $Ca=0.2$
,
 ${\it\phi}=0.3$
.

A.1. Effect of mesh size
We simulated several cases with a different number of elements,
 $N_{E}=$
320, 1280 and 5120. For
 $N_{E}$
= 5120, three cases with different initial positions were simulated, and the average value of the three cases was considered as the reference value. The error in the Taylor parameter
 ${\it\varepsilon}_{D}$
and that in the specific viscosity
 ${\it\varepsilon}_{{\it\mu}}$
are defined by
 $$\begin{eqnarray}\displaystyle & \displaystyle {\it\varepsilon}_{D}=\frac{|\langle D\rangle -\langle D\rangle ^{ref}|}{\langle D\rangle ^{ref}}, & \displaystyle\end{eqnarray}$$
 $$\begin{eqnarray}\displaystyle & \displaystyle {\it\varepsilon}_{{\it\mu}}=\frac{|{\it\mu}_{sp}-{\it\mu}_{sp}^{ref}|}{{\it\mu}_{sp}^{ref}}, & \displaystyle\end{eqnarray}$$
 $ref$
indicate the reference value. As shown in table 1, mesh convergence was confirmed for
 $N_{E}\geqslant 1280$
. Both
 ${\it\varepsilon}_{D}$
and
 ${\it\varepsilon}_{{\it\mu}}$
are approximately 2 % for
 $N_{E}=320$
, while the values for
 $N_{E}=1280$
are 0.2–0.3 % which is of the same order as those for
 $N_{E}=5120$
. In our simulation, the number of elements is fixed at
 $N_{E}=5120$
.
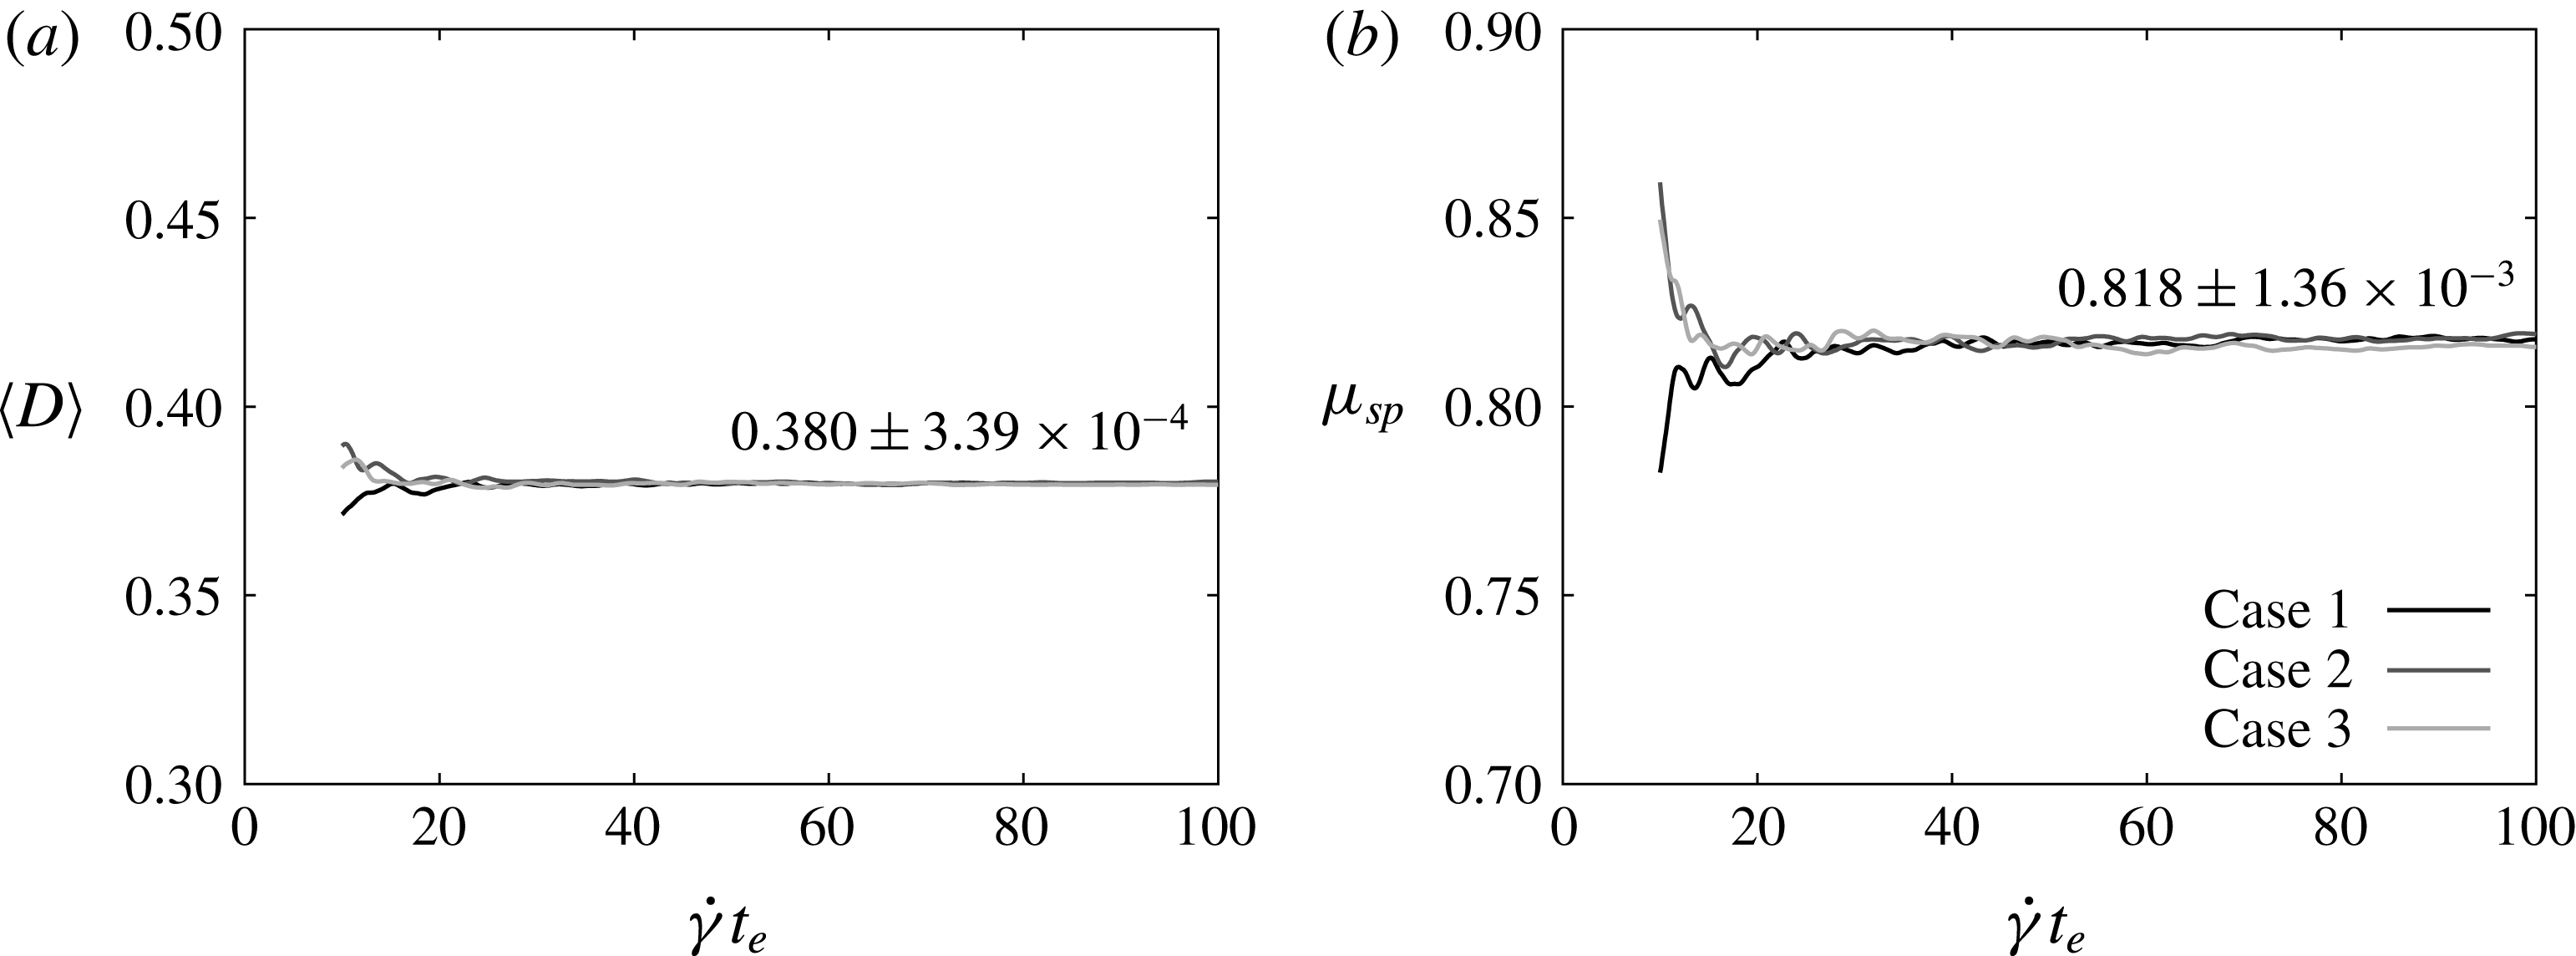
Effect of the ending time
 $t_{e}$
on (a) the ensemble average of the Taylor parameter, and (b) the specific viscosity. Three cases with different initial positions are simulated for
 $Ca=0.2$
and
 ${\it\phi}=0.3$
. The starting time for the time averaging is
 $\dot{{\it\gamma}}t_{s}=10$
. The value inside the figure is the average value and the standard deviation of three cases at
 $\dot{{\it\gamma}}t_{e}=100$
.
Effect of the number of capsules per unit domain
 $M$
on the Taylor parameter and the specific viscosity. The error bar shows the standard deviation of three cases with different initial positions.

A.2. Effect of initial position
The time average of a value can be written as
 $$\begin{eqnarray}\langle f\rangle =\frac{1}{t_{e}-t_{s}}\int _{t_{s}}^{t_{e}}f(t)\,\text{d}t,\end{eqnarray}$$
where
 $t_{s}$
and
 $t_{e}$
are the starting time and the ending time for the time averaging. Figure 11 shows the effect of the ending time on the ensemble average of the Taylor parameter and the specific viscosity. Numerical results for three cases with different initial positions of capsules are plotted. The time averaging starts at
 $\dot{{\it\gamma}}t_{s}=10$
to exclude the transient phase. When the ending time increases,
 $\langle D\rangle$
and
 ${\it\mu}_{sp}$
converge even for the cases with different initial positions. The standard deviation of the three cases is the order of 0.1 % at
 $\dot{{\it\gamma}}t_{e}=100$
. According to this result, the effect of the initial positions of capsules can be ignored when the ending time is large enough. In this paper, we simulate one case for each condition and the ending time is set at
 $\dot{{\it\gamma}}t_{e}=100$
.
A.3. Effect of the number of capsules per unit domain
Figure 12 shows the effect of the number of capsules per unit domain
 $M$
. Three different initial positions are simulated and the average values of the three cases are plotted with the standard deviation. Neither the Taylor parameter nor the specific viscosity varies with
 $M$
, while a larger deviation is found for a smaller value of
 $M$
. In our simulation, the number of capsules per unit domain is fixed at
 $M=100$
.



