Implications
Palm oil (PO) can be used as an effective energy source in the diets of pregnant and lactating sows, reducing sow body condition loss whilst improving the energy density of milk available to growing piglets. However, despite these benefits, the feeding of PO during the latter stages of pregnancy also results in changes in glucose and thyroid metabolism. The causes, consequences and longer term implications of these changes are generally unknown and require further investigation.
Introduction
Nutrient requirements for lactation in sows are met both by dietary sources and by maternal tissue stores, resulting in mobilization of body reserves and a reduction in maternal fat reserves by the time of weaning (Mullan and Williams, Reference Mullan and Williams1989). Anestrous is highly inversely correlated with BW and backfat at weaning (Mullan and Williams, Reference Mullan and Williams1989; Johnston et al., Reference Johnston, Pettigrew and Rust1993); sows with lower BW and backfat exhibit longer periods of anestrous, thus reducing the efficiency of production. Supplementation of sow diets with fats during late gestation and lactation can be used as a concentrated source of energy, to increase the concentration of fat in colostrum and milk (Quiniou et al., Reference Quiniou, Richard, Mourot and Etienne2008; Tummaruk et al., Reference Tummaruk, Sumransap and Jiebna2014) and hence, reduce dependence on maternal body stores and subsequent probability of prolonged anestrous (Tantasuparuk et al., Reference Tantasuparuk, Dalin, Lundeheim, Kunavongkrit and Einarsson2001).
A number of researchers have reported increased rates of weight gain in piglets suckled by sows supplemented with animal fat during lactation (Averette et al., Reference Averette, Odle, Monaco and Donovan1999; Tilton et al., Reference Tilton, Miller, Lewis, Reese and Ermer1999). Piglets suckling from sows fed on animal fat also lay down more fat during the pre-weaning period (Tilton et al., Reference Tilton, Miller, Lewis, Reese and Ermer1999). The use of such animal by-products, certainly within the European Union, is now restricted, primarily as a consequence of the BSE crisis (Lauridsen et al., Reference Lauridsen and Danielsen2007) and concerns about traceability, disease and chemical residues. Consequently, alternative sources of fat are of increasing importance and the use of PO is one such alternative to the use of animal fats and carries none of the associated risks; although it should be noted that lipid digestibility has been reported to decline with increasing free fatty acid concentration (Rosero et al., Reference Rosero, Boyd, McCulley, Odle and van Heugten2016).
The use of PO in the diets of growing and fattening pigs has been reported by Teye et al. (Reference Teye, Sheard, Whittington, Nute, Stewart and Wood2006) who demonstrated that there were no negative effects with regards to piglet performance by the use of PO. This group have previously shown that piglets born to mothers supplemented with PO during the first half of gestation were heavier and fatter (Laws et al., Reference Laws, Amusquivar, Laws, Herrera, Lean, Dodds and Clarke2007), whereas Almond et al. (Reference Almond, Fainberg, Lomax, Bikker, Symonds and Mostyn2015) reported increased mortality in piglets born to sows fed PO throughout gestation. The aim of this study was to evaluate the effects of feeding 10% extra energy, in the form of PO, to sows during late gestation and through lactation on plasma metabolites and hormones, reproductive efficiency, neonatal outcome and their subsequent growth and development.
Material and methods
Animals and diets
All animals used in these studies were maintained at the Pig Research and Development Unit, Imperial College, London and protocols adopted were similar to previous studies conducted by this group (Laws et al., Reference Laws, Laws, Lean, Dodds and Clarke2009). Experimental procedures were undertaken in accordance with the Animals (Scientific Procedures) Act, 1986 and were licensed by the Home Office (UK). At all stages of life, animals were kept within the guidelines set out by the Department for Environment, Food and Rural Affairs (2003), and fed commercially available diets to meet nutrient requirements.
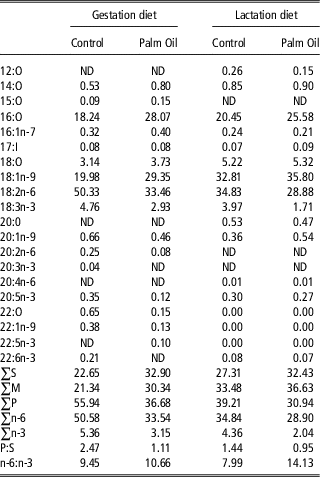
Sixteen multiparous sows of a commercial genotype (25% Meishan; 12.5% Duroc; 62.5% Large White×Landrace) that had been artificially inseminated with pooled semen from Large White boars (P17 2006; JSR Genetics, Driffield, Yorks, UK) were entered into the study on day 90 of gestation. Sows were categorized by parity (C 5.7±0.5; PO 5.3±0.5) before being randomly assigned to one of two dietary treatment groups to ensure that parity was balanced across treatments. Maternal BW (252±5 kg, mean±SEM) and backfat thickness (17±1 mm, mean±SEM) at the start of the study was not significantly different between treatments. Sows were assigned randomly to either a control diet or one containing 10% extra energy in the form of top dressing of PO (33.54 MJ/kg; T Quality Ltd, Swindon, UK). Experimental diets were supplied from day 90 of gestation (term ≈115 days) and consisted of either: (i) control (C); 3 kg/day of the standard diet (ABN HE sow pellets; metabolisable energy (ME) 13.1 MJ/kg; CP 12.7%; Oil 4.5%; fibre 4.8%; ash 5.3%; vitamin A 10 000 (IU/kg); vitamin D3 1875 (IU/kg); vitamin E 60 (IU/kg); lysine 0.55%; copper 21 mg/kg; ABN, Peterborough, UK); or (ii) 3 kg/day of the standard diet plus 10% extra energy derived from PO (117 g/day). After parturition the following lactation diets were supplied: the C lactation diet consisted 6 to 9 kg/day of the standard lactation pellets (ABN supreme lactation pellets; ME 14.1 MJ/kg; CP 18%; oil 7.2%; fibre 4.0%; ash 5.0%; vitamin A 10 000 (IU/kg); vitamin D3 1875 (IU/kg); vitamin E 75 (IU/kg); lysine 0.95%; copper 23 mg/kg; ABN), and the PO lactation diet consisted of 6 to 9 kg/day of the standard lactation pellets plus 10% extra energy derived from PO (40 g PO per kg of feed). Sows were offered a fixed amount of the appropriate feed daily (3 to 9 kg/day depending on the stage of gestation/lactation); there were no refusals, and as a consequence there were no differences in feed intake observed between treatments. Fatty acid compositions of the experimental diets are shown in Table 1. Piglets had ad libitum access to creep feed (Primary Select; 16.77 MJ/kg ME; 23.5% CP; oil 9%; fibre 2%; ash 6.3%; vitamin A 12 500 (IU/kg); vitamin D3 2000 IU/kg); vitamin E 250 ((IU/kg); lysine 1.7%; copper170 mg/kg; Primary Diets Ltd, Ripon, Yorks, UK) from day 14 of life.
Fatty acid composition of sow diets

S=saturated fatty acids; M=monounsaturated fatty acids; P=polyunsaturated fatty acids; ND=none detected.
Values presented are mean percentages from two determinations of total lipid fraction extracted from samples of diet.
Production data
On days 90 and 109 of gestation, and at weaning, sows were restrained in a weigh crate (UHL Products, Swanley, Kent, UK) while their weight and ultrasonic measurements of backfat thickness (Aloka-echo camera 550-500; Aloka Ltd, Mitaka, Japan) were recorded. Backfat thickness was measured level with the head of the last rib, at the P1 (45 mm from the midline) and the P3 (80 mm from the midline) positions. The average of these two values was then calculated to give the P2 value. After farrowing the numbers of piglets born alive, stillborn and mummified and the number of male and female piglets born were recorded. The length of gestation was calculated from the day of insemination. After weaning, 24 to 28 days postpartum, sows were inseminated at their first oestrus, dates and results of the subsequent farrowing were recorded.
Piglet growth and composition
Growth performance of all piglets was observed throughout the neonatal period. Body weight and body composition were recorded at birth and at 7, 14 and 21 days post-farrowing. Piglet growth rate was calculated by regression analysis of piglet weight against time. Body composition of all piglets was determined using a total-body electrical conductivity analysing system (TOBEC, Model-SA3000 EMSCAN/TOBEC, SA-3203; Biotech Instruments Ltd, Luton, Beds, UK) on days 0, 7, 14 and 21 of life. Body fat and lean mass tissues within an animal exhibit different conductivities. The increased conductivity of fat-free mass (FFM) is attributed to the presence of sodium (Na) and potassium (K), which in association with water exhibit electrical conductivity (EM-SCAN, 1992). When a subject is placed in the electromagnetic field, energy absorbed is a function of the area (A 2), magnetic field strength (B), conduction per unit volume at a specific frequency (c), and a number of constants (k), such that (Mitchell and Scholz, Reference Mitchell and Scholz2001):
 $$E{\rm \,{\equals}\,}A^{{\rm 2}} {\rm {\times}}B{\rm {\times}}c{\rm {\times}}k$$
The energy absorption signal produced by the TOBEC is primarily a function of the FFM and is measured as the difference between coil impedance when empty and that with the subject within (EM-SCAN, 1992). As temperature affects electrical conductivity, it was maintained within the range of 18°C to 22°C. Each piglet was positioned identically within a polycarbonate tube and held in place with a plunger to maintain constancy of position. Tube size was selected according to BW (<3 kg to 128 mm; 3 to 5 kg to 150 mm; >5 kg to 190 mm). Piglet FFM per kg was calculated using the equation shown below, as suggested in the TOBEC manufacturer’s instructions:
 $$\eqalignno{ {\rm FFM}\,\left( {{\rm arbitrary}\,{\rm units}} \right)\cr{\rm {\equals}}\,\sqrt {\left( {{\rm TOBEC}\,{\rm reading{\times}Crown{\hbox-}rump{\hbox-}length/piglet}\,{\rm weight}\,\left( {{\rm kg}} \right)} \right.} $$
Milk composition
Colostrum samples were collected as near to birth as possible (within 12 h of parturition) via milking by hand. Milk samples were collected on days 3, 7, 14 and 21 of lactation following intra-muscular administration of 2 ml oxytocin (10 IU/ml; NVS, Stoke-on-Trent, Staffs, UK). On each occasion 20 ml of milk were collected (milking by hand) and stored in azide coated sample pots at 4°C before analysis for gross milk composition by an automated IR filtration system, which was conducted by National Milk Records (Harrogate, UK). A 1.5-ml milk sample was stored at −80°C before lipid extraction and purification by the method of Folch et al. (Reference Folch, Lees and Sloane-Stanlet1957). Total lipid, neutral lipids or phospholipids were saponified and the fatty acids methylated following the method of Lepage and Roy (Reference Lepage and Roy1984 and Reference Lepage and Roy1986). Fatty acid methyl esters were separated on a 30 m×0.25 mm Omegawax capillary column (Supelco, Bellefonte PA, USA) and quantified using a Perkin-Elmer gas chromatograph (Autosystem Norwalk, CT, USA) with a hydrogen flame ionization detector. Nitrogen was used as a carrier gas, and the fatty acid methyl esters were compared with purified standards (Sigma Chemical Co., St Louis, MO, USA). An estimate of the total milk energy was calculated using the equation from Klaver et al. (Reference Klaver, van Kempen, de Lange, Verstegen and Boer1981):
 $$\eqalignno{ & {\rm Total}\,{\rm energy}\,\left( {{\rm MJ/kg}} \right){\rm \,{\equals}\,0}{\rm .0042{\times}[}\left( {{\rm 92}{\rm .2{\times}fat}\,{\rm \,\%\,}\,{\rm w/w}} \right){\rm {\plus}} \cr & \quad\left( {{\rm 61}{\rm .3{\times}protein}\,{\rm \,\%\,}\,{\rm w/w}} \right){\rm {\plus}}\left( {{\rm 35}{\rm .6{\times}lactose}\,{\rm \,\%\, }\,{\rm w/w}} \right){\rm ]} $$
Sow blood collection and analyses
Samples of sow blood were collected (~6 h after the morning feed) into di-sodium EDTA blood tubes (Teklab, UK) from the jugular vein at 105 days of gestation, within 24 h of farrowing, day 7 of lactation and at weaning (28±3 days post-farrowing). Although all blood samples were taken within 6 h of feed being offered, it is important to note that sow feed intake behaviour (irrespective of treatment) was not consistent around the time of parturition. Blood samples were centrifuged for 15 min at 1600×g av (Sci Quip 3K15; Sigma Laboratory Centrifuges, Osterode am Harz, Germany); plasma was collected and stored at −20°C until analysis. Plasma was analysed for concentrations of glucose, non-esterified fatty acids (NEFA) and triacylglycerol (TAG), IGF-1, insulin, thyroid hormones (triiodothyronine (T3) and thyroxine (T4)) and leptin using commercially available kits (glucose (GOD-PAP), and TAG (GPO-PAP) from Randox Laboratories Ltd, London, UK; NEFA C from Wako Chemical GmbH, Neuss, Germany; IGF-1 IRMA from Diagnostic Systems Laboratories Inc., Webster, TX, USA; insulin, T3 and T4 radioimmunoassay (RIA) kits from ICN Pharmaceuticals, New York, NY, USA; and leptin RIA assay kit from LINCO Research, St. Charles, MO, USA). Intra- and inter-assay CV for insulin were 5.8% and 2.3%, respectively, 7.9% and 4.9%, respectively for IGF-1, 6.8% and 2.7%, respectively for leptin, 8.3% and 2.5%, respectively for T4, 8.8% and 2.5%, respectively for T3, 4.1% and 2.2%, respectively for glucose, 7.6% and 1.4%, respectively for NEFA, and 4.1% and 1.4%, respectively for TAG.
Statistical analyses
Statistical differences between dietary treatments were determined by repeated measures using the mixed model procedure of SAS version 9.4 (SAS Institute Inc., Cary, NC, USA). Sources of variation within the model included diet (1 df), sample point (3 df for plasma hormones and 4 df for milk fatty acid analysis) with respect to each specific measure as previously described) and first-order interactions between diet and sample point. Parity and litter size were used as covariates; parity was used as a covariate rather than class due to the spread and limited replication within and between treatments with respect to parity number. Individual animal was the repeated subject and sample point the repeated measure. Results are presented as least squares means with standard error and P value. Tukey’s simultaneous tests were used to establish statistical difference between means (sample points and first-order interactions). Probability values of <0.05 were considered to be statistically significant.
Individual piglet growth rate was calculated by regression analysis of piglet weight against time. Analysis was conducted for the period between birth and weaning. The slope of the line gave a measure of their growth rate in kg/day.
Results
Sow weight change during gestation and lactation were similar, irrespective of treatment. No differences were observed in backfat at the P2 position during gestation, however, mean backfat losses were lower in PO sows during lactation (C −3.6±0.8 mm; PO −0.1±0.8 mm; P<0.05). Mean natural gestation length was increased by 1 d for sows in the PO group (C 117±0.3 days; PO 118± 0.3 days; P<0.05). There were no significant differences in total litter size (mean±SEM: 11.5±1.2), a number of piglets born alive, stillborn or mummified or in the ratio of male to female piglets. In the subsequent reproductive cycle, weaning to service interval, the percentage of successful inseminations, gestation length, litter size and a number of piglets born alive, stillborn and mummified were similar for both treatment groups. However, in the subsequent litter, the ratio of male to female piglets was two-fold higher in litters born to PO sows compared with C sows (C 1.0±0.3; PO 2.2±0.2; male:female; P<0.05).
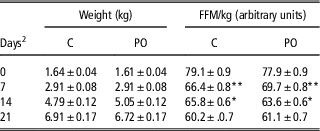
There were no differences in piglet BW, either at birth or throughout the neonatal period (Table 2) and consequently piglet growth rates were also similar (C 0.43±0.04 kg/day, PO 0.47±0.04 kg/day; mean±SEM). All piglets became fatter with increasing age (P<0.05), as indicated by their lower FFM/kg (Table 2). There were no differences in FFM/kg at birth, but by day 7 of life piglets born to C sows were fatter (P<0.01). In contrast, by day 14, the piglets of PO sows were fatter (P<0.05) but by day 21 no differences existed in piglet FFM between treatments, which may in part be due to the introduction of creep feed on day 14.
Effect of maternal diet on piglet weight (kg) and fat-free mass/kg (FFM/kg)Footnote 1

C=control diet; PO=palm oil diet.
1 Data are presented as adjusted least squares means±SEM (parity and litter size were analysed as covariates).
2 Day of life (birth on day 0).
Significant differences between treatments (C v. PO) in FFM/kg: *P<0.05, **P<0.01.
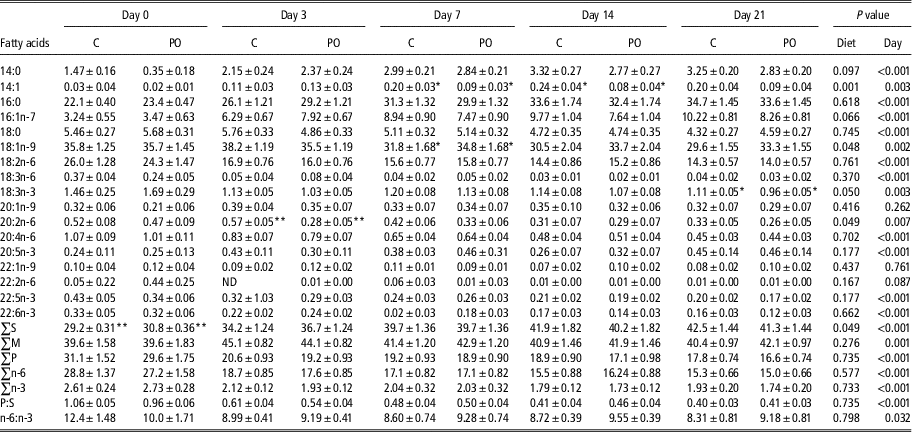
There was no difference in the concentration of milk protein or lactose, but the percentage of fat was increased in the milk of sows in the PO group, during the 1st week of lactation (P<0.05; Table 3); this trend continued to day 21 of lactation (P<0.1). As a consequence of the increased proportion of fat in the milk, energy yield was also found to be higher (P<0.05; Table 3). As expected, the addition of PO to the maternal diet influenced the fatty acid profile of both colostrum and milk, but only significant treatment differences are highlighted below. The percentage of saturated fatty acids was elevated in the colostrum of PO sows (P<0.01; Table 4). On day 3 of lactation the proportion of eicosadienoic (20:2n-6) acid was lower in the milk of PO sows (P<0.01; Table 4). During mid-lactation (days 7 and 14) the percentage of myristoleic (14:1) acid was decreased in the milk of PO sows (P<0.05; Table 4). Similarly, by day 21 of lactation the proportion of α-linolenic acid (18:3n-3) acid was reduced in the milk of PO sows (P<0.05; Table 4). There were effects of time on fatty acid profile such that the sum of saturates increased between subsequent sample points (P<0.05), the sum of monounsaturated fatty acids increased between 0 and 3 days postpartum and then remained similar. Conversely, the sum of polyunsaturated fatty acids (PUFA), n-6, n-3 and the PUFA to saturated ratio declined over successive sample points. There were no interactions between diet and sample point.
Effect of maternal diet on sow milk composition and milk energyFootnote 1

C=control diet; PO=palm oil diet.
1 Data are presented as adjusted least squares means±SEM.
2 MJ/kg of milk, MJ calculated as 0.0042×(92.2×fat + 61.3×protein + 35.6×lactose).
3 Days since parturition.
Significant differences between treatments (C v. PO) within each milk fraction: *P<0.05, **P<0.01.
Mean effects of sow diet during late gestation and lactation on the fatty acid profile (g/100 g fatty acid) of their colostrum and milk over a 21-day lactation

C=control diet; PO=palm oil diet; S=saturated fatty acids; M=monounsaturated fatty acids; P=polyunsaturated fatty acids; ND=none detected.
Data presented are adjusted least squares means±SEM, Tukey’s test was used to determine differences between treatment means.
Significant differences between treatments (C v. PO) within each sample time point: *P<0.05, **P<0.01.
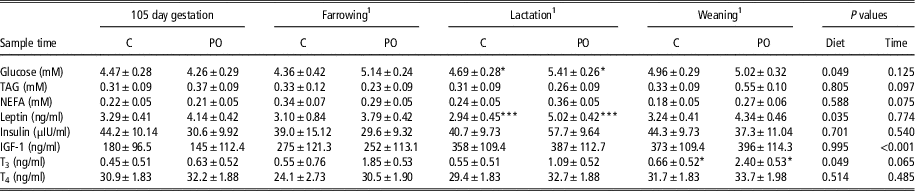
There were no effects of PO on plasma concentrations of TAG, NEFA, insulin and IGF-1 at any time point (Table 5). Concentrations of glucose were greater in the PO group during lactation (P<0.05) as were concentrations of leptin (P<0.005), although these effects did not persist into weaning (Table 5). Concentrations of T3 were greater in the PO group at weaning (P<0.05) although there were no effects of treatment or time point on concentrations of T4 (Table 5). Circulating concentrations of IGF-1 were seen to increase with each successive time point (P<0.001), but these changes were not related to diet. There were no interactions between diet and sample point for any of the parameters determined in sow plasma (Table 5).
Effect of sow diet on circulating concentrations of leptin, insulin, IGF-1, triiodothyronine (T3), thyroxine (T4), glucose and lipids

C=control diet; PO=palm oil diet; TAG=triacylglycerol; NEFA=non-esterified fatty acid.
Significant differences between treatments (C v. PO) within each sample time point: *P<0.05, ***P<0.005.
1 Sample time: farrowing=within 24 h of parturition; lactation=day 7 of lactation; weaning=day 28±3 of lactation).
Discussion
Maternal performance
Feeding animal fat during gestation has been shown to increase weight gain in sows (Averette et al., Reference Averette, Odle, Soede and Hansen2002), whereas the addition of fat to the lactation diet did not appear to influence maternal weight loss (Avarette et al., Reference Averette, Odle, Monaco and Donovan1999). In the present study, neither weight gain during the last few weeks of pregnancy nor weight loss during lactation were affected by supplementation of sow diets with PO, which may be in part due to the timing and duration of fat supplementation. However, it should be noted that replication was limited and statistical differences may have been masked by variation due to the small number of animals in each group. Consequently care needs to be exercised when interpreting these results.
During gestation, sow backfat has been shown to increase linearly with increasing feed intake (Dourmad, Reference Dourmad1991; Cools et al., Reference Cools, Maes, Decaluwe, Buyse, van Kempen, Liesegang and Janssens2014) but this was not reflected in the current study. However, during lactation, backfat loss was lower in the PO group, which is in accordance with the findings of others (Tilton et al., Reference Tilton, Miller, Lewis, Reese and Ermer1999; Avarette et al., Reference Averette, Odle, Soede and Hansen2002). This apparent reduction in sow backfat loss at weaning could have been a result of increased dietary energy intake during lactation.
Avarette et al. (Reference Averette, Odle, Soede and Hansen2002) found no difference in the gestational length of sows after supplementation with either medium or long chain (animal fat) TAGs. Conversely, in the present study supplementation of the maternal diet with PO during the last few weeks of gestation was observed to increase gestational length by one day. The review of Tanghe and De Smet (Reference Tanghe and De Smet2013) into the effects of maternal fatty acid supplementation indicated that the effects that supplementary PUFA had on gestational length were not consistent. These authors suggested that the effects reported on gestational length may be a consequence of PUFA induced changes to eicosanoid production, or alterations to enzymes involved in steroid hormone production.
The sex-allocation hypothesis of Triver and Willard (Reference Triver and Willard1973) predicts that females in the best body condition will tend to produce offspring of the gender which favours the sex of greater variance (i.e. males). This hypothesis has been supported by observations in several species (Rosenfeld and Roberts, Reference Rosenfeld and Roberts2004), including pigs (Meikle et al., Reference Meikle, Drickamer, Vessey, Arthur and Rosenthal1996). In this experiment, the subsequent litter of PO sows contained a higher proportion of male offspring, which may reflect the energy status of sows at the time of insemination/implantation. Rosenfeld et al., (Reference Rosenfeld, Grimm, Livingston, Brokman, Lamberson and Roberts2003) observed similar results in mice fed either a high saturated fat or high carbohydrate diet; however, the mechanisms for diet-induced skewing of sex ratio is not known, but a number of possible mechanisms have been suggested and are discussed in a review by Rosenfeld and Roberts (Reference Rosenfeld and Roberts2004).
Plasma metabolites and hormones
It is well known that NEFA are a product of fat metabolism and a sign of catabolism of fat reserves. There were no effects of PO supplementation on circulating concentrations of NEFA at any time during the present study, which could reflect the minimal change in net backfat thickness. The net reduction in backfat depth of C sows during lactation might have been anticipated to result in increased circulating concentrations of NEFA (Ren et al., Reference Ren, Yang, Cui, Kim, Menon and Baidoo2017) but surprisingly this was not the case in the current study.
Glucose concentrations were higher in the plasma of PO sows on day 7 of lactation. This reflects the findings of Van der Peet-Schwering et al. (Reference Van der Peet-Schwering, Kemp, Binnendijk, den Hartog, Vereijken and Verstegen2004) who reported increased glucose concentrations in fat supplemented sows during lactation. These authors suggested that elevated glucose concentrations were a consequence of fat-induced glucose intolerance, as sows fed an isocaloric diet containing starch did not exhibit the same alterations in glucose concentration. Within the current study, the elevated concentrations of glucose in PO sows during lactation appear to coincide with higher circulating concentrations of insulin, although differences in circulating concentrations of insulin failed to achieve statistical significance. This might be indicative of insulin resistance/glucose intolerance as Almond et al. (Reference Almond, Fainberg, Lomax, Bikker, Symonds and Mostyn2015) reported increased area under the curve following a glucose tolerance test in late gestation in sows supplemented with PO. Furthermore, they also reported a higher incidence of piglet mortality in PO supplemented sows, which was attributed to birth hypoglycaemia. These authors proposed that maternal glucose intolerance resulted in impaired piglet cognition at birth leading to reduced suckling activity and hence increased incidence of hypoglycaemia at birth. The elevated glucose and insulin concentrations recorded in the current study occurred during lactation rather than during pregnancy and so were unlikely to affect piglet glycaemic status and subsequent mortality.
Circulating concentrations of leptin were also found to be higher in PO sows on day 7 of lactation. Leptin is mainly produced by adipocytes and adipose tissue and circulating concentrations of leptin are linked to body stores (Summer et al., Reference Summer, Saleri, Malacarne, Bussolati, Beretti, Sabbioni and Superchi2009). A number of studies have shown a direct correlation with levels of sow adiposity and circulating concentrations of leptin (Estienne et al., Reference Estienne, Harper, Barb and Azain2000; De Rensis et al., Reference De Rensis, Gherpelli, Superchi and Kirkwood2005; Summer et al., Reference Summer, Saleri, Malacarne, Bussolati, Beretti, Sabbioni and Superchi2009). This is reflected in the current study whereby both PO and C sows gained similar levels of backfat during gestation, but during lactation body stores were maintained in PO sows but reduced in C sows.
Although circulating concentrations of T4 were not appreciably different between treatments or time points in the current study, those of T3 were seen to be higher in PO supplemented sows, particularly at weaning (P<0.05). This mirrors the findings of Von Eder and Kirchgessner (Reference Von Eder and Kirchgessner1997) who reported that circulating T4 concentrations were not influenced by lipid supplementation but T3 concentrations were increased when soya oil and olive oil were lipid sources, but the same effect was not apparent when beef fat was the source. These authors concluded that fat source rather than fat content influenced thyroid hormone metabolism.
Milk composition
In the current study milk from PO sows contained more fat whereas protein and lactose concentrations were similar, irrespective of the maternal diet. These observations are in agreement with other published research, which found that protein and lactose concentrations varied little with dietary supplementation with animal fat (Shurson et al., Reference Shurson, Hogberg, DeFever, Radecki and Miller1986) or other lipid sources (Lauridsen and Danielsen, Reference Lauridsen, Christensen, Halekoh and Jensen2004). However, Lauridsen and Danielsen (Reference Lauridsen, Christensen, Halekoh and Jensen2004) also went on to report that the addition of different fats and oils to sow diets did not alter the total lipid content of milk. This disparity in findings between these authors’ and those of the current study may reflect the higher levels of dietary fat used in the current study.
The higher fat percentage observed in the milk of PO animals resulted in a greater energy yield per kg of milk produced. The increased percentage of saturated fatty acids in the colostrum (day 0) of PO sows echoes the elevated saturated fatty acid content of the maternal diet (Table 1). Previous research has shown that milk fatty acid composition mirrors that of the maternal diet (Lauridsen and Danielsen, Reference Lauridsen, Christensen, Halekoh and Jensen2004). However, there were no diet-induced differences in milk total saturates throughout the rest of lactation despite the differences observed in the total saturates of the lactation diet.
Lauridsen and Danielsen (Reference Lauridsen, Christensen, Halekoh and Jensen2004) reported elevated levels of palmitic acid in the milk of sows offered diets containing PO. The same effect was not apparent in the present study, where there were no diet-related differences in the C16:0 content of milk at any time point despite the much higher levels of C16:0 in the PO diet. There were some small transitory differences in milk fatty acids 14:1, 18:3, 20:2 between diets, but these were not consistent and followed no discernable pattern over the course of lactation. The effects of time with respect to changes in milk total saturates, monounsaturates and PUFA seen in the current study have been reported previously (Skrzypczak et al., Reference Skrzypczak, Waśkiewicz, Beszterda, Goliński, Szulc, Buczyński and Babicz2015) and are typical of changes seen in porcine milk fat profiles with advancing stage of lactation.
Growth and development of offspring
In the present study birth weight of piglets were unaffected by manipulation of the maternal diet during late gestation. This is in agreement with findings of others following the provision of additional energy as fats during the latter stages of gestation (Seerley et al., Reference Seerley, Griffin and Campbell1978; Quiniou et al., Reference Quiniou, Richard, Mourot and Etienne2008). However, Wang et al. (Reference Wang, Yang, Cao, Lin, Che, Duraipandiyan, Al-Dhabi, Fang, Xu, Feng, Liu and Wu2016) reported a linear increase in piglet size with increasing energy provision during pregnancy, although it should be noted that total litter weight was not appreciably different between treatments.
In this trial piglet body composition (as indicated by FFM/kg) was also shown to be similar between treatments at birth. By day 7 of life, piglets sucking from C sows contained more fat, but by day 14 of life, piglets sucking from PO animals were the fattest (as indicated by their lower FFM/kg). The variation in body composition between birth and weaning between groups may be due to differences in milk yield and individual piglet suckling behaviour. Previous studies have shown that piglets reared by sows receiving fat supplements during lactation grew faster; the composition of the increased weight gain was almost exclusively fat (Tilton et al., Reference Tilton, Miller, Lewis, Reese and Ermer1999).
Conclusions
Results from this study suggest that the increase in energy intake by the sow, associated with PO supplementation, appears to alter milk composition, which may in turn influence early postnatal growth, development and body composition of suckling piglets. Elevated glucose concentrations in the sow seen during lactation may be suggestive of impaired glucose homoeostasis. However, due to the limited replication within the current study care needs to be exercised when interpreting data and as such further work is required in this area.
Acknowledgements
The authors wish to acknowledge the financial support of the Commission of the European Communities (QLK1-2001-00138; PeriLip). This work does not necessarily reflect the views of the Commission and in no way anticipates its future policy in this area. Special thanks are also due to A. Laws, K. A. Massey and K. S. Perkins for their technical assistance.
Declaration of interest
The authors declare that they have no conflict of interest.
Ethics statement
The study was subject to local ethical review and conducted in accordance with Imperial College’s animal research policy and all procedures were conducted and confirmed to the United Kingdom’s Animal (Scientific Procedures) Act 1986.
Software and data repository sources
Data and models are not available in an official repository.