




No CrossRef data available.
Article contents
Cloning two full-length beta-tubulin isotype cDNAs from Cooperia oncophora, and screening for benzimidazole resistance-associated mutations in two isolates
Published online by Cambridge University Press: 05 December 2003
Abstract
Two full-length beta-tubulin cDNAs, representing isotypes 1 and 2, were cloned from the cattle nematode Cooperia oncophora. The predicted protein sequences span 448 amino acids, and show a high degree of identity to beta-tubulins from other nematodes. While C. oncophora isotype 1 sequence had the highest identity to Haemonchus contortus isotype 1 and Teladorsagia circumcincta sequences (95% identity), the C. oncophora isotype 2 sequence was most similar to H. contortus isotype 2 and Trichostrongylus colubriformis (92% identity). Alignment of the two C. oncophora sequences with other trichostrongylid beta-tubulins deposited in GenBank showed a clear distinction between isotype 1 and 2 beta-tubulin classes. The two classes differed at 19 amino acid positions, most notably at the carboxy terminus. These isotype-defining residues were conserved among different trichostrongylid species within a class. Analysis of fragments of both genes revealed a high degree of genetic variability in coding and non-coding regions. However, all nucleotide differences detected in the coding region were silent, as they did not result in any amino acid substitution. Analysis of 2 groups of worms for the codon 200 polymorphism associated with benzimidazole resistance revealed a proportion of worms in 1 of the groups bearing a tyrosine at this position.
Information
- Type
- Research Article
- Information
- Copyright
- 2003 Cambridge University Press
INTRODUCTION
Cooperia oncophora (Strongylida: Trichostrongyloidea) is an important parasite of cattle and is prevalent in the temperate regions of the world (Parmentier et al. 1995). The ability of infected animals to mount an effective immune response to this parasite increases with age, and infections are usually restricted to young calves (Kloosterman, Ploeger & Frankena, 1991). Although considered a parasite of relatively low pathogenicity, infections can sometimes cause clinical disease (Vermunt, West & Pomroy, 1996; Armour et al. 1987). While broad-spectrum anthelmintic drugs have been effective in controlling Cooperia infections in cattle, their usefulness is threatened by the emergence of anthelmintic resistance. Resistance is widespread in nematode parasites of sheep, including Haemonchus contortus and Teladorsagia circumcincta (Prichard, 1994; Waller et al. 1996; Waller, 1997; Gopal, Pomroy & West, 1999), and while it has been slower to emerge in nematodes of cattle, there are several reports of its occurrence. Benzimidazole (BZ) resistance in species of Cooperia has been reported in New Zealand (Jackson et al. 1995; McKenna, 1996), while ivermectin resistance in this species has been reported in New Zealand, UK and Argentina (e.g. Vermunt et al. 1996; Coles, Stafford & MacKay, 1998; Coles, Watson & Anziani, 2001; Familton, Mason & Coles, 2001; Anziani et al. 2001; Fiel et al. 2001). Also, multiple resistance of Cooperia species against the avermectin and BZ classes has been reported in New Zealand (Vermunt, West & Pomroy, 1995). Since resistance is not yet widespread, the efficacy of anthelmintics against nematodes of cattle can be maintained if control strategies which limit the frequency of treatment are adopted (Coles, 2002 a). In addition, the development of sensitive tests that detect resistance at the earliest stage would enable action to be taken before significant selection had occurred.
The faecal egg count reduction test (FECRT) is the most widely used method for detecting anthelmintic resistance (Taylor, Hunt & Goodyear, 2002). This test is suitable for all types of anthelmintics, and has been used to detect all cases of anthelmintic resistance in Cooperia species reported to date. It has several limitations, including the necessity for repeat visits to affected farms, and a lack of sensitivity (Waller, 1997). Sensitive molecular tests have been described for detecting BZ resistance in H. contortus, T. circumcincta and Trichostrongylus colubriformis (Kwa, Veenstra & Roos, 1994; Elard & Humbert, 1999; Silvestre & Humbert, 2000). These tests detect a mutation (phenylalanine to tyrosine) at codon 200 of the beta-tubulin isotype 1 gene, a change which is linked to BZ resistance (Kwa et al. 1994, 1995; Elard & Humbert, 1999). Designing a molecular test for monitoring BZ resistance in C. oncophora requires knowledge of the beta-tubulin sequence. Here, we describe the cloning of isotypes 1 and 2 beta-tubulin cDNAs from this parasite, which show a high degree of sequence identity to similar sequences from other trichostrongylids. The genetic variability of both isotype genes was also analysed using the single-strand conformation polymorphism (SSCP) method. Also, the presence of the Phe-Tyr mutation was investigated in 2 C. oncophora populations, and shown to occur at a low frequency in 1 of the populations.
MATERIALS AND METHODS
Parasites
Two C. oncophora isolates (IVS and IVR), kindly provided by Dr Coles (University of Bristol, UK) were used in this study. The IVS isolate was maintained without anthelmintic pressure at Weybridge Experimental Station, UK, while IVR represents a field isolate originally obtained from a farm in Somerset, UK, where ivermectin resistance was reported (Coles et al. 1998). The 2 isolates were maintained by regular passage through donor (male Holstein) calves at the Macdonald Campus, McGill University Farm. The animals were housed indoors. Third-stage larvae (L3) were obtained by copro-cultures (Borgsteede & Hendriks, 1979) and kept in water at 4 °C until used to infect other calves. To ensure viability, L3s were less than 3 months old when used for infection. Adult C. oncophora were collected live at necropsy from the small intestine, washed in RPMI medium (Sigma) at 37 °C, and stored in liquid nitrogen until used for RNA and DNA extraction.
Cloning of the full-length beta-tubulin isotypes 1 and 2 cDNAs of C. oncophora
Total RNA was isolated from bulk adult worms using the TRIZOL method (GibcoBRL, Burlington, ON, Canada). First strand cDNA synthesis was performed using 2 μg of the total RNA using 200 U murine Moloney leukaemia virus reverse transcriptase (M-MLV, GibcoBRL) and 0·2 μg oligo dT12–18 primer (GibcoBRL). For the initial isolation of the C. oncophora beta-tubulin isotype 1 (Co b1) sequence, cDNA was amplified using Advantage 2 cDNA kit (ClonTech) with degenerate primers. These primers were designed based on conserved regions of beta-tubulin isotype 1 sequences from H. contortus and T. circumcincta. Two sets of primers were designed for a nested PCR approach. A fragment of the Co b1 cDNA was first amplified with the outer sense primer, Co b1 Deg F1 (5′ GGNCCNTAYGGNCARCTNTTYCGNC 3′), and the outer antisense primer, Co b1 Deg R1 (5′ CYTCNGCRTCNAGRTCNCCCATRTC 3′). This first-round reaction was then used as the template for subsequent amplification using the nested primers Co b1 Deg F2 (5′ GARGGNGCNCARCTNGTNGAYAAYG 3′), and Co b1 Deg R2 (5′ GNGTNAGYTCNGCNACNGTNGANGC 3′). The PCR reaction conditions were an initial denaturation at 94 °C for 30 s, followed by 30 cycles of 94 °C for 20 s, 50 °C for 30 s, and 72 °C for 1 min, and a final extension at 72 °C for 5 min. The PCR product from the second (nested) reaction was examined on a 1% agarose gel (TBE) stained with 0·5 μg/ml ethidium bromide, and the fragment of the expected length (~550 bp) was purified using the Nucleospin Gel Extraction Kit (ClonTech). The purified PCR products were then subcloned into a TA cloning vector (Invitrogen) as described by the manufacturer, and then sequenced using standard M13 forward and/or reverse primers. Three independent clones were sequenced to obtain a consensus. Based on the sequenced fragment, gene-specific primers were designed for the 5′ and 3′ RACE (Rapid Amplification of cDNA Ends) reactions.
To identify the 5′ end of the Co b1 cDNA, a trans-spliced 22-nucleotide conserved leader sequence (SL1) (Blaxter & Liu, 1996) was used. This sequence has been identified at the 5′ end of a number of nematode mRNAs. The SL1 primer (5′ GGTTTAATTACCCAAGTTTGAG 3′) was used along with two gene-specific antisense primers Co b1 5′ RACE 1 (5′ CCACAACGGTGTCGGAGACCTTTGG 3′) and Co b1 5′ RACE 2 (5′ CCCATACCGGATCCGGTACCTCCTC 3′) in a semi-nested PCR reaction using the Advantage 2 cDNA kit. Amplification conditions were as outlined above, with an annealing temperature of 54 °C. The resulting PCR fragment was purified, ligated into a TA cloning vector (Invitrogen) and subsequently sequenced in both directions using vector primers.
To amplify the 3′ end of Co b1 cDNA, a nested PCR approach was employed using the Marathon cDNA Amplification Kit (ClonTech). Two gene-specific sense primers were designed from the sequenced fragment (Co b1 3′ RACE 1, 5′ GGCTTCGTTCTCTGTTGTTCCTTCA 3′ and Co b1 3′ RACE 2, 5′ CCAAAGGTCTCCGACACCGTTGTGG 3′), and used with the 2 antisense adaptor primers AP1 and AP2, respectively, as outlined by the manufacturer.
C. oncophora isotype 2 (Co b2) was isolated using the same procedures as employed for isotype 1, except for the primers. The degenerate primers used for the initial isolation of a fragment of Co b2 cDNA were designed according to an alignment of the amino acid sequences of beta-tubulins from H. contortus (tub 12–16), H. contortus (tub 12–164), H. contortus (tub 8–9), T. circumcincta, T. colubriformis and Caenorhabditis elegans BEN-1. An approximately 600 bp fragment of the Co b2 cDNA was first amplified with primers Co b2 Deg F1 (5′ GGNGCNGGNAAYAAYTTGGC 3′), and Co b2 Deg R1 (5′ TCATRTTYTTNGCRTCRAAC 3′). This first-round reaction was then used as template for further amplification using the nested primers Co b2 Deg F2 (5′ GGNCAYTAYACNGARGGNGC 3′), and Co b2 Deg R2 (5′ AANGGNACCATRTTNACNGC 3′). Following cloning and sequencing of the resultant 470 bp fragment, gene-specific primers were designed for the 5′ and 3′ RACE reactions. The 2 antisense 5′ RACE primers, Co b2 5′ RACE 1 (5′ CCACAAGTTGGTGCACAGAAAGCGTGGC 3′) and Co b2 5′ RACE 2 (5′ GGTTCAACTACGGTATCGGAAACCTTGG 3′) were used in a semi-nested PCR with SL1 to amplify the 5′ end of the Co b2 cDNA. The two 3′ RACE primers, Co b2 3′ RACE 1 (5′ TTGACGTTGTTCGCAAGGAGGCAGAAGG 3′) and Co b2 3′ RACE 2 (5′ CCTTCAGGGTTTCCCACTCACGCACTCG 3′), were used with the antisense adapter primers AP1 and AP2, respectively, in a nested PCR reaction.
Determination of the presence/absence of BZ resistance mutations in IVS and IVR C. oncophora
BZ resistance in H. contortus and T. circumcincta is proposed to be mediated by a phenylalanine-to-tyrosine mutation of beta-tubulin isotype 1 at position 200 (Kwa et al. 1995; Elard, Comes & Humbert, 1996; Silvestre & Humbert, 2000). The same mutation at position 167 has been shown to confer BZ resistance in H. contortus (Prichard, 2001). To determine whether these mutations were present in the C. oncophora isotype 1 (Co b1) gene, genomic DNA was isolated from individual male worms (35 IVS and 33 IVR) as described by Beech, Prichard & Scott (1994). PCR products spanning positions 167 and 200 were amplified from these samples, purified using CloneTech's Nucleospin Extraction Kit, and sequenced.
Analysis of genetic variability using SSCP, and sequencing of alleles
To investigate the genetic variability of the gene encoding Co b1, 60 genomic DNA samples were examined by PCR-SSCP (30 IVS and 30 IVR) using the gene-specific primers Co b1 F (5′ GTAACAACTGGGCAAAGGG 3′) and Co b1 R (5′ TGTCAGGGTACTCCTCACG 3′). A total of 113 samples were tested for the Co b2 gene (57 IVS and 56 IVR) using the primers Co b2 F (5′ GAAATAACTGGGCGAAGGG 3′) and Co b2 R (5′ ATCAGGGTACTCTTCACGG 3′). The genomic DNA samples were amplified in standard PCR reactions using Taq polymerase (GibcoBRL), and the PCR products were analysed on a 1% agarose gel to check both the size and specificity of the products.
For SSCP screening of the Co b1 samples, 2μl of each PCR product were mixed with 2 μl of loading buffer containing 95% formamide, 10 mM NaOH, 0·25% bromophenol blue, and 0·25% xylene cyanol. The samples were then denatured at 95 °C for 5 min, and immediately placed on ice. Then 4 μl of each sample were loaded onto a 15% non-denaturing polyacrylamide gel and subjected to electrophoresis in 1XTBE for 17 h at room temperature and 100 V. For Co b2, the PCR samples were mixed with the loading dye in a product[ratio ]dye ratio of 1[ratio ]15, and 10 μl of each sample were loaded onto a 15% polyacrylamide gel and subjected to electrophoresis for 18 h at 110 V at room temperature. Following electrophoresis, the gels were stained with 0·5 μg/ml ethidium bromide and visualized using the Bio-Rad Molecular Imager FX with its corresponding Quantity One (Version 4.2.1) software.
To determine the nucleotide sequence of the Co b1 and Co b2 alleles identified, at least 3 individual PCR samples representing each allele were selected, where possible, and sequenced using PCR primers.
Sequence analysis
Allele sequences were aligned using CLUSTAL W on the SDSC Biology Workbench (Version 3.2). Analysis of the beta-tubulin protein sequences was performed by first generating a multiple sequence alignment using CLUSTAL W. Phylogenetic relationships were then determined using MEGA Version 2.1 (Kumar et al. 2001), and the statistical significance of the trees was tested by bootstrap analysis using 1000 replicates.
RESULTS
The complete nucleotide sequences of the Co b1 and Co b2 cDNAs were determined, and have been deposited in GenBank under the accession numbers AY259994 and AY259995, respectively. The Co b1 and Co b2 tubulin cDNAs were 1470 and 1620 nucleotides long, respectively. The translated regions of the 2 isotypes were both 1344 nucleotides long, and shared 80% homology. Both isotype 1 and isotype 2 sequences included the 22-nucleotide SL1 sequence at the 5′ end, upstream of positions −19 and −34, respectively. The 5′ and 3′ untranslated regions of the Co b1 and Co b2 isotypes were highly variable, showing no significant similarity between them.
The amino acid sequences deduced from Co b1 and Co b2 cDNAs are shown in Fig. 1, aligned with sequences representing isotype 1 and isotype 2 beta-tubulins from other trichostrongylids. They were all 448 amino acids long. A characteristic feature of β tubulins is the autoregulation recognition element present at the amino terminus, which is represented by the first 4 amino acids Met-Arg-Glu-Ile (MREI). This conserved sequence was present in the 2 C. oncophora isotypes isolated (shown in Fig. 1). Also, residues 140–146 serve as the signature pattern for α, β and γ tubulin subunits. Co b1 and Co b2 amino acid sequences differed from each other at several positions, notably at the carboxy terminus (Fig. 1). In this region, there were 12 amino acid differences between the 2 isotypes. Also, 13 other amino acid differences were identified at other positions, including 18, 35, 81, 83, and 90.
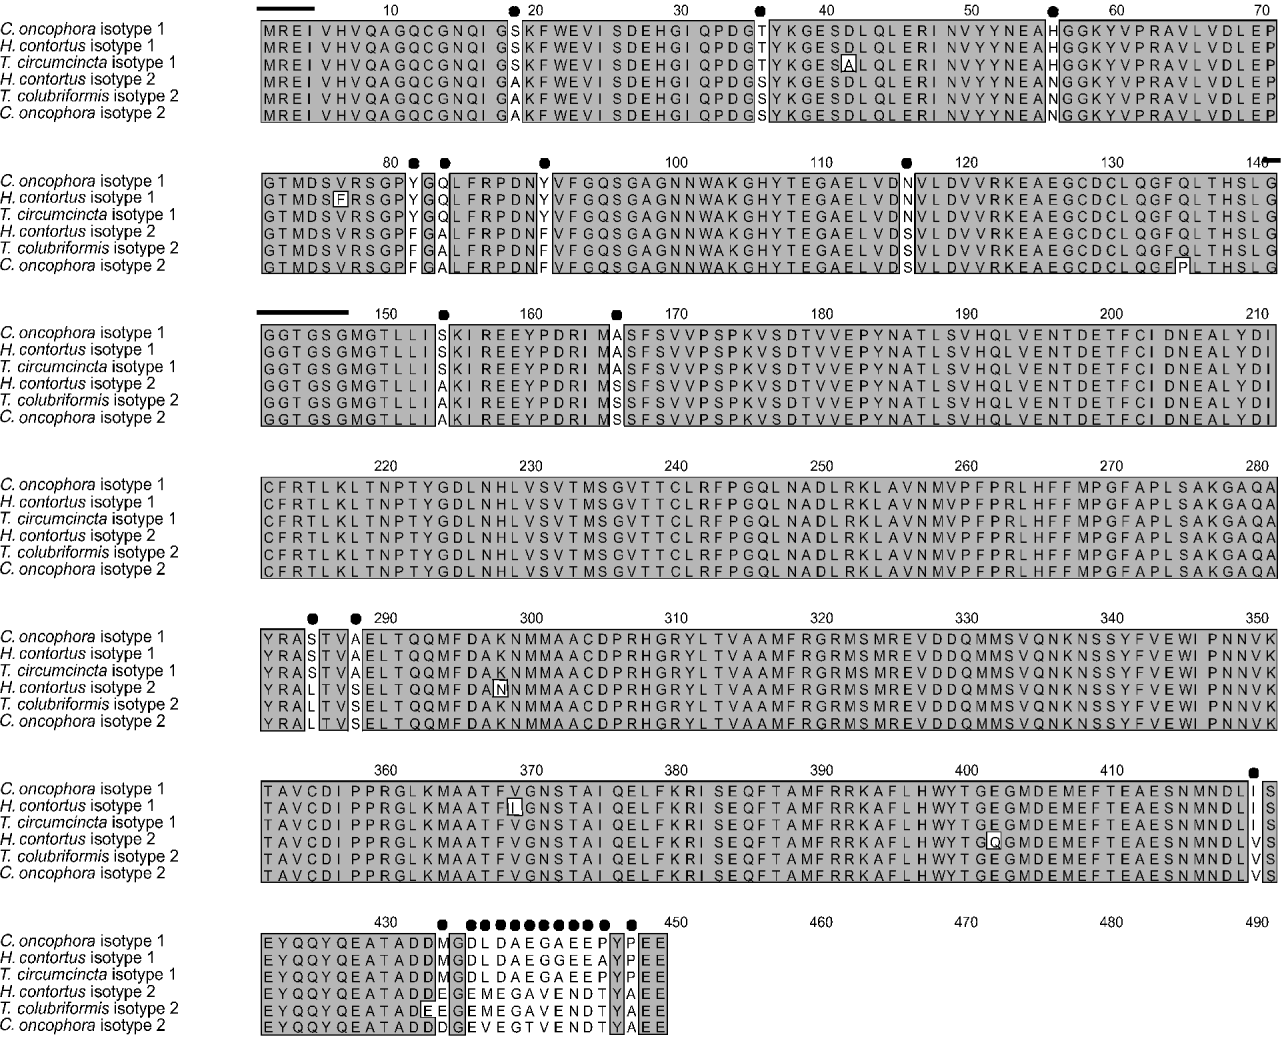
Fig. 1. Alignment of the Co b1 and Co b2 sequences with other trichostrongylid beta-tubulins. The 24 amino acids unique to isotypes 1 and 2 are indicated by a filled circle. This alignment shows that the sequences in an isotype class show higher identity to each other than they do to the other isotype sequence from the same species. The autoregulation signal, MREI (Cleveland, 1988), is highlighted by a black line, as is the tubulin signature sequence at position 140–146. Binding of GTP to this glycine-rich region stimulates microtubule assembly (Hesse, Thiefauf & Ponstingl, 1987).
The 2 predicted protein sequences were compared with other full length beta-tubulins reported in current databases (Table 1). The predicted protein sequence of Co b1 had the highest identity (95%) with the isotype 1 sequences representing T. circumcincta and H. contortus, whereas the Co b2 predicted protein was 92% identical to isotype 2 sequences of T. colubriformis and H. contortus. Other sequences which showed high identity to the Co b1 predicted protein sequence included the horse cyathostome Cyathostomum coronatum (94%) and C. elegans BEN 1 (90%); Co b2 showed 87% and 88% identity to these two sequences respectively. Co b1 showed 87% identity to beta-tubulin sequences from the filarial nematodes Onchocerca volvulus, Dirofilaria immitis and Brugia pahangi, while Co b2 showed 86% identity to these 3 sequences. The two C. oncophora sequences showed 86% identity to Drosophila melanogaster beta-tubulin. Comparison of the H. contortus and C. oncophora isotype 1 and isotype 2 sequences showed that the homologous isotypes from the 2 species had higher identity to one another than either isotype had to the other beta-tubulin isotype from the same species; H. contortus isotype 1 and Co b1 were 95% identical at the amino acid level, while H. contortus isotype 2 (β12–16 and β12–164) and Co b2 were 92% identical at the amino acid level. In contrast, H. contortus isotypes 1 and 2 shared 90% identity at the amino acid level, as did the Co b1 and Co b2 sequences. Phylogenetic analysis by distance-based and parsimony methods produced trees with similar topologies, and the Neighbour-Joining tree is illustrated in Fig. 2. Isotype 1 and isotype 2 predicted protein sequences of strongylids were found in distinct clusters highly supported by bootstrap analysis (Fig. 2). Co b1 grouped with isotype 1 sequences from H. contortus, T. circumcincta, Cylicocyclus nassatus and C. coronatum with a bootstrap value of 100%. Co b2 clustered with isotype 2 sequences from H. contortus and T. colubriformis (bootstrap value 100%). Sequences from the 3 filarial nematodes B. pahangi, D. immitis and O. volvulus also formed a distinct group.
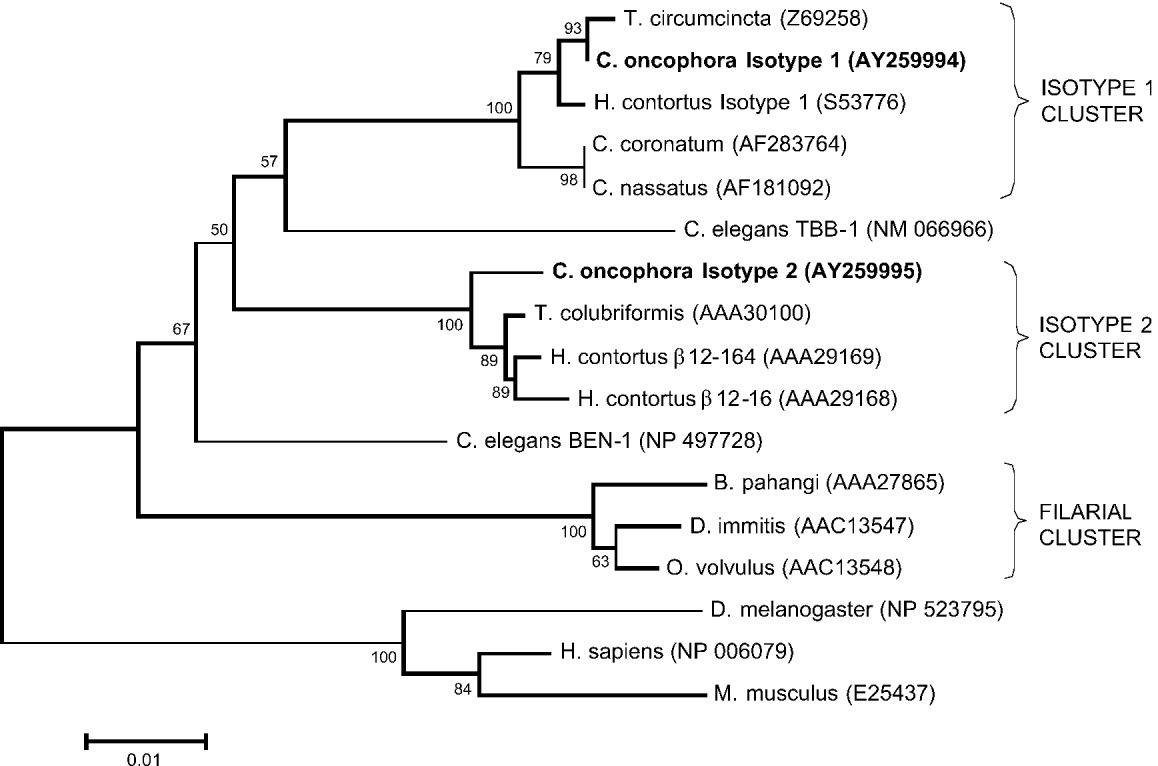
Fig. 2. Neighbour-joining tree showing the relationships among beta-tubulin predicted protein sequences. GenBank accession numbers are indicated with each sequence. The 2 beta-tubulin sequences cloned from Coperia oncophora are in bold type. The first sequence, C. oncophora isotype 1, groups with isotype 1 sequences from Haemonchus contortus and Teladorsagia circumcincta. The second sequence, C. oncophora isotype 2, is found on a distinct branch with similar sequences from H. contortus and Trichostrongylus colubriformis. Bootstrap values range from 50% to 100%. Sequences were aligned using CLUSTAL W on the SDSC Biology Workbench (Version 3.2), and phylogenetic analyses performed using MEGA Version 2.1 (Kumar et al. 2001).
Table 1. Comparison of Cooperia oncophora beta-tubulin (Co b1 and Co b2) predicted proteins with other beta-tubulins for identity (The values represent pairwise percentage identity in amino acid sequence. Highest identity to a different species is shown in bold type. Co b1 had highest identity to Haemonchus contortus and Teladorsagia circumcincta isotype 1 sequences (95% identity). Co b2 had highest identity to H. contortus β12–16 and β12–164, and Trichostrongylus colubriformis, which are isotype 2 sequences.)

PCR fragments spanning amino acids 167 and 200 of Co b1 were amplified from individual male worms and then sequenced to determine whether the tyrosine resistance-associated mutation was present. The fragments were 310 bp in length, and 35 IVS and 33 IVR individual male worms were examined. All IVS and IVR worms were homozygous for phenylalanine (Phe/Phe) at position 167 (Table 2). At position 200, all (n=35) IVS worms were homozygous Phe/Phe. From the IVR group, 8 worms were found to be heterozygous Phe/Tyr (24·2%), while 1 worm was homozygous Tyr/Tyr (3%). All other IVR worms (n=24) were homozygous Phe/Phe at this position (72·7%).
Table 2. Determining the genotypes of individual worms based on amino acids at positions 167 and 200 of Co b1 gene (At codon position 167, all IVS and IVR worms were homozygous for Phe. At position 200, all IVS worms were homozygous for Phe. Eight of the IVR worms were heterozygous Phe/Tyr, while 1 was homozygous for the BZ resistance mutation.)

Using SSCP analysis, 60 Co b1 and 113 Co b2 genomic DNA samples were screened for genetic variability. Figure 3 shows sequence variability of the Co b2 gene as demonstrated using SSCP. A total of 9 alleles were identified by PCR-SSCP for both Co b1 and Co b2 genes (Table 3). For the Co b1 gene, all 9 alleles were found in both the IVS and IVR groups. Allele A was the most abundant in both groups, and alleles F, G and H were found at lower frequencies in both groups when compared to other alleles. For the Co b2 gene, allele A was the most common in both IVS and IVR, with frequencies of 0·48 and 0·46 respectively. Allele F was found only in the IVS group, and allele L was found only in IVR. These 2 alleles were present at low frequencies (0·03 and 0·01 respectively). Alignment of the Co b1 and Co b2 allele sequences showed nucleotide polymorphisms in the intron and exon regions (data not shown). However, all nucleotide differences in the exons were silent, as they did not result in a change in the amino acid.

Fig. 3. SSCP of the Co b2 gene. The polyacrylamide gel was stained with ethidium bromide, and the banding pattern visualized using the Bio-Rad Molecular Imager FX. Samples in this figure were all from the IVS group. Eight of the 9 alleles identified for the Co b2 gene are shown here, labelled using a letter code. Homozygotes are represented by 2 bands (e.g. AA) and most of the heterozygotes are represented by 4 bands (e.g. EH). However, where 2 of the bands in the heterozygote have co-migrated, 3 bands are seen (e.g. DJ).
Table 3. Allele frequencies for Co b1 and Co b2 genes in IVS and IVR worms. In both genes, 9 alleles were identified (All 9 Co b1 alleles were found in both IVS and IVR groups, while 8 of the 9 Co b2 alleles were found in each group.)

DISCUSSION
Beta-tubulin sequences from 3 sheep trichostrongylid nematodes have been reported to date, namely H. contortus, T. colubriformis and T. circumcincta. However, no beta-tubulin from a cattle trichostrongylid nematode had been sequenced. Here, we report the cloning of 2 full-length beta-tubulin cDNAs from the cattle nematode C. oncophora, representing isotypes 1 and 2.
Studies by Geary et al. (1992) showed that there are at least 2 beta-tubulin isotype classes in H. contortus. The present results show that the same applies to C. oncophora, and that a high degree of sequence identity exists between similar isotypes from both nematodes. At the amino acid level, Co b1 sequence was 95% identical to the H. contortus isotype 1, while Co b2 was 92% identical to the 2 H. contortus isotype 2 sequences β12–16, and β12–164. This high sequence conservation extended to beta-tubulin sequences from other organisms, including the O. volvulus, D. melanogaster, and vertebrates, where the percentage identity to both Co b1 and Co b2 ranged from 85 to 87%. This high identity across species suggests that evolutionary divergence of beta-tubulins is limited by functional constraints. Phylogenetic analysis placed the Co b1 sequence with isotype 1 sequences of H. contortus (Geary et al. 1992), T. circumcincta (Elard et al. 1996), C. nassatus (Pape, Samson-Himmelstjerna & Schneider, 1999) and C. coronatum (Samson-Himmelstjerna et al. 2001). Co b2 was found on a distinct branch with isotype 2 sequences of H. contortus (β12–16 and β12–164) and T. colubriformis. Bootstrap analysis showed strong support for these groupings. The trichostrongylid isotypes 1 and 2 can be distinguished based on differences at their carboxy termini, as well as 12 other amino acid positions. These residues are identical among species within a single isotype class, as seen in Fig. 1, and suggest that in trichostrongyles, at least 2 distinct beta-tubulin isotype classes exist. Whether these 2 isotypes have unique functions is not yet known. In vertebrates, 7 beta-tubulin isotypes have been identified, and are distinguished based on the sequence at the isotype-defining carboxy terminus (Luduena, 1993). They differ in their cellular distribution and relative stabilities and hence, in vivo function (Roach et al. 1998; Schwarz, Liggins & Luduena, 1998). The isotype-defining carboxy terminus is thought to interact with microtubule associated proteins (MAPs) and motor proteins (Nogales, Wolf & Downing, 1998; Downing & Nogales, 1998). Isotype differences found in regions other than the carboxy terminus are proposed to determine microtubule stability (Downing & Nogales, 1998).
A Phe-Tyr mutation at position 200 of beta-tubulin isotype 1 gene is the major determinant of BZ resistance in trichostrongylid nematodes (Kwa et al. 1995; Elard et al. 1996). The same mutation at position 167 has also been reported in the absence of the position 200 mutation in resistant H. contortus (Prichard, 2001). To determine the prevalence of the codon 167 and 200 isotype 1 mutations in IVS and IVR worms, a fragment of the Co b1 gene spanning the 2 amino acid positions was amplified from randomly selected individual male worms from both groups, and sequenced. The 2 groups were considered independently because they originated from different locations. At position 167, all individual worms (IVS and IVR) were identified as homozygous non-mutant (Phe/Phe). The mutation at position 167 appears to be rare under field conditions in trichostrongylids of sheep, and may reflect the fitness cost associated with this mutation (Silvestre & Cabaret, 2002).
At position 200 of the Co b1 gene, all 35 IVS worms were found to be homozygous Phe/Phe at position 200 (Table 2). From the IVR group, 8 of the 33 worms were identified as heterozygous Phe/Tyr at this position (24·2%). One worm was homozygous Tyr/Tyr (3%), and all other worms (n=24) were homozygous Phe/Phe (72·7%). These results are similar to those obtained by Elard & Humbert (1999) with the ‘SuPRO’ susceptible population of T. circumcincta, where 18% of the worms were heterozygous (Phe/Tyr) and 3% were homozygous resistant (Tyr/Tyr). This population was classified as being susceptible using the FECRT to estimate BZ resistance, since no eggs were found in the faeces after BZ treatment. The presence of the BZ resistance mutation in a proportion of the IVR worms suggests that this group has the potential to develop BZ resistance if selective pressure is applied, assuming BZ resistance mechanisms to be similar in C. oncophora and other trichostrongyles. The Phe-Tyr mutation at position 200 of isotype 1 is recessive (Elard, Suave & Humbert, 1998), and heterozygous Phe/Tyr worms are therefore eliminated along with homozygous Phe/Phe worms by using the recommended drug dose. However, underdosing seems to favour survival of heterozygous Phe/Tyr susceptible worms over homozygous Phe/Phe susceptible worms (Silvestre, Cabaret & Humbert, 2001), and benzimidazole resistance is more likely to spread rapidly when lower-than-recommended drug doses are used.
A reduction in genetic variability of isotype 1 and 2 genes has been linked to resistance in H. contortus, T. colubriformis and T. circumcincta (see Kwa et al. 1993; Beech et al. 1994; Grant & Mascord, 1996; Elard & Humbert, 1999). In the most resistant worms, a loss of isotype 2 is evident (Kwa et al. 1993; Lubega et al. 1994; Roos, Kwa & Grant, 1995). SSCP analysis of short Co b1 and Co b2 gene fragments from individual C. oncophora male worms showed that both genes were polymorphic-9 alleles were identified for both isotypes. Trichostrongylid nematodes show high genetic diversity (Blouin et al. 1992), and are therefore able to respond to selection pressure (Grant, 1994). The variability of both isotypes in the IVS and IVR groups was comparable, even though the BZ resistance-associated mutation was found at very low frequency in the latter group. At very low levels of BZ resistance, there is no detectable loss of variability of isotype 1 and 2 genes (Kwa et al. 1993). Sequencing of the alleles revealed nucleotide variations in coding and non-coding regions, although all differences in the coding region were silent, suggesting that allelic variation is limited to positions that will not result in amino acid changes, as such changes may affect function.
To prevent the spread of resistance, early detection is essential. The FECRT, which is most widely used to monitor anthelmintic resistance in domestic animals, can only detect resistance when the proportion of resistant worms in the population is at least 25% (Martin, Anderson & Jarrett, 1989). This is much greater than the 1–2% suggested by mathematical modelling if resistance is to be managed by using a second drug before resistance develops to the first (Sangster et al. 2002). Sensitive molecular tests that detect very low resistance gene frequencies have been described for H. contortus, T. circumcincta, T. colubriformis, and small strongyles (Kwa et al. 1994; Elard & Humbert, 1999; Silvestre & Humbert, 2000; Samson-Himmelstjerna et al. 2002). Such a test would be useful for studying the prevalence of BZ resistance in C. oncophora.
The finding of BZ-resistance associated mutations in the IVR group, albeit at a low frequency, is important, since this group is resistant to ivermectin (Coles et al. 1998). Recent findings suggest that ivermectin-resistant C. oncophora are more pathogenic than the susceptible parasites (Coles et al. 2001). We found that infecting calves with 10000 IVR L3 larvae caused diarrhoea and poor body condition, while age-matched calves infected with the same number of IVS worms did not show any clinical signs (unpublished results). The potential for multiple anthelmintic resistance developing in an isolate which appears to be more pathogenic is of concern, and indicates the need for monitoring and early detection of resistance so as to maintain the efficacy of currently available anthelmintics. Unlike nematode parasites of sheep, BZ resistance is still considered to be rare among nematodes of cattle (Prichard, 1994; Coles, 2002 b). Importantly, knowledge of the C. oncophora beta-tubulin isotype 1 sequence will allow for the development of a sensitive molecular test that can be used to monitor the emergence of BZ resistance, so that measures can be taken to counter it before it becomes widespread.
This study was supported by Fort Dodge Animal Health and NSERC, Canada. We would like to thank Dr G. Coles for supplying the 2 isolates, and D. Eshelby and G. Bingham for technical assistance.
References
REFERENCES
ANZIANI, O. S.,
ZIMMERMANN, G.,
GUGLIELMONE, A. A.,
VAZQUEZ, R. &
SUAREZ, V.
(
2001).
Avermectin resistance in Cooperia pectinata in cattle in Argentina.
Veterinary Record 149, 58–59.CrossRefGoogle Scholar
ARMOUR, J.,
BAIRDEN, K.,
HOLMES, P. H.,
PARKINS, J. J.,
PLOEGER, H.,
SALMAN, S. K. &
McWILLIAM, P. N.
(
1987).
Pathophysiological and parasitological studies on Cooperia oncophora in cattle.
Research in Veterinary Science 42, 373–381.Google Scholar
BEECH, R. N.,
PRICHARD, R. K. &
SCOTT, M. E.
(
1994).
Genetic variability of the β-tubulin genes in BZ-susceptible and -resistant strains of Haemonchus contortus.
Genetics 138, 103–110.Google Scholar
BLAXTER, M. &
LIU, L.
(
1996).
Nematode spliced leaders – ubiquity, evolution and utility.
International Journal for Parasitology 26, 1025–1033.Google Scholar
BLOUIN, M. S.,
DAME, J. B.,
TARRANT, C. A. &
COURTNEY, C. H.
(
1992).
Unusual population genetics of a parasitic nematode: mtDNA variation within and among populations.
Evolution 46, 470–476.CrossRefGoogle Scholar
BORGSTEEDE, F. H. &
HENDRIKS, J.
(
1979).
Experimental infections with Cooperia oncophora (Railliet, 1918) in calves. Results of single infections with two graded dose levels of larvae.
Parasitology 78, 331–342.Google Scholar
CLEVELAND, D. W.
(
1988).
Autoregulated instability of tubulin mRNAs: a novel eukaryotic regulatory mechanism.
Trends in Biochemical Sciences 13, 339–343.CrossRefGoogle Scholar
COLES, G. C.
(
2002 a).
Sustainable use of anthelmintics in grazing animals.
Veterinary Record 151, 165–169.Google Scholar
COLES, G. C.
(
2002 b).
Cattle nematodes resistant to anthelmintics: why so few cases?
Veterinary Research 33, 481–489.Google Scholar
COLES, G. C.,
STAFFORD, K. A. &
MacKAY, P. H. S.
(
1998).
Ivermectin-resistant Cooperia species from calves on a farm in Somerset.
Veterinary Record 142, 255–256.Google Scholar
COLES, G. C.,
WATSON, C. L. &
ANZIANI, O. S.
(
2001).
Ivermectin-resistant Cooperia in cattle.
Veterinary Record 148, 283–284.Google Scholar
DOWNING, K. H. &
NOGALES, E.
(
1998).
Tubulin structure, insights into microtubule properties and functions.
Current Opinion in Structural Biology 8, 785–791.CrossRefGoogle Scholar
ELARD, L. &
HUMBERT, J. F.
(
1999).
Importance of the mutation of amino acid 200 of the isotype 1 β-tubulin gene in the benzimidazole resistance of the small ruminant parasite Teladorsagia circumcincta.
Parasitology Research 85, 452–456.CrossRefGoogle Scholar
ELARD, L.,
COMES, A. M. &
HUMBERT, J. F.
(
1996).
Sequences of β-tubulin cDNA from BZ-susceptible and -resistant strains of Teladorsagia circumcincta, a nematode parasite of small ruminants.
Molecular and Biochemical Parasitology 79, 249–253.CrossRefGoogle Scholar
ELARD, L.,
SUAVE, C. &
HUMBERT, J. F.
(
1998).
Fitness of BZ-resistant and -susceptible worms of Teladorsagia circumcincta, a nematode parasite of small ruminants.
Parasitology 117, 571–578.CrossRefGoogle Scholar
FAMILTON, A. S.,
MASON, P. &
COLES, G. C.
(
2001).
Anthelmintic-resistant Cooperia species in cattle.
Veterinary Record 149, 719–720.Google Scholar
FIEL, C. A.,
SAUMELL, C. A.,
STEFFAN, P. E. &
RODRIGUEZ, E. M.
(
2001).
Resistance of Cooperia to ivermectin treatments in grazing cattle of the Humid Pampa, Argentina.
Veterinary Parasitology 97, 211–217.CrossRefGoogle Scholar
GEARY, T. G.,
NULF, S. C.,
FAVREAU, M. A.,
TANG, L.,
PRICHARD, R. K.,
HATZENBUHLER, N. T.,
SHEA, M. H.,
ALEXANDER, S. J. &
KLEIN, R. D.
(
1992).
Three β-tubulin cDNAs from the parasitic nematode Haemonchus contortus.
Molecular and Biochemical Parasitology 50, 295–306.CrossRefGoogle Scholar
GOPAL, R. M.,
POMROY, W. E. &
WEST, D. M.
(
1999).
Resistance of field isolates of Trichostrongylus colubriformis and Ostertagia circumcincta to ivermectin.
International Journal for Parasitology 29, 781–786.CrossRefGoogle Scholar
GRANT, W. N.
(
1994).
Genetic variation in parasitic nematodes and its implications.
International Journal for Parasitology 24, 821–830.CrossRefGoogle Scholar
GRANT, W. N. &
MASCORD, L. J.
(
1996).
Beta-tubulin polymorphism and benzimidazole resistance in Trichostrongylus colubriformis.
International Journal for Parasitology 26, 71–77.CrossRefGoogle Scholar
HESSE, J.,
THIEFAUF, M. &
PONSTINGL, H.
(
1987).
Tubulin sequence region beta 155-174 is involved in binding exchangeable guanosine triphosphate.
Journal of Biological Chemistry 262, 15472–15475.Google Scholar
JACKSON, R. A.,
TOWNSEND, K. G.,
PYKE, C. &
LANCE, D. M.
(
1995).
Isolation of oxfendazole resistant Cooperia oncophora in cattle.
New Zealand Veterinary Journal 35, 187–189.Google Scholar
KLOOSTERMAN, A.,
PLOEGER, H. W. &
FRANKENA, K.
(
1991).
Age resistance in calves to Ostertagia ostertagi and Cooperia oncophora.
Veterinary Parasitology 39, 101–113.CrossRefGoogle Scholar
KUMAR, S.,
TAMURA, K.,
JAKOBSEN, I. B. &
NEI, M.
(
2001).
MEGA2: Molecular evolutionary genetics analysis software.
Bioinformatics 17, 1244–1245.CrossRefGoogle Scholar
KWA, M. S.,
KOOYMAN, F. N. J.,
BOERSEMA, J. H. &
ROOS, M. H.
(
1993).
Effect of selection for benzimidazole resistance in Haemonchus contortus in β-tubulin isotype 1 and isotype 2 genes.
Biochemical and Biophysical Research Communications 191, 413–419.CrossRefGoogle Scholar
KWA, M. S. G.,
VEENSTRA, J. G. &
ROOS, M. H.
(
1994).
Benzimidazole resistance in Haemonchus contortus is correlated with a conserved mutation at amino acid 200 in β-tubulin isotype 1.
Molecular and Biochemical Parasitology 63, 299–303.CrossRefGoogle Scholar
KWA, M. S. G.,
VEENSTRA, J. G.,
VAN DIJK, M. &
ROOS, M. H.
(
1995).
β-tubulin genes from the parasitic nematode Haemonchus contortus modulate drug resistance in Caenorhabditis elegans.
Journal of Molecular Biology 246, 500–510.CrossRefGoogle Scholar
LUBEGA, G. W.,
KLEIN, R. D.,
GEARY, T. G. &
PRICHARD, R. K.
(
1994).
Haemonchus contortus, the role of two β-tubulin gene subfamilies in the resistance to benzimidazole anthelmintics.
Biochemical Pharmacology 47, 1705–1715.CrossRefGoogle Scholar
LUDUENA, R. F.
(
1993).
Are tubulin isotypes functionally significant.
Molecular Biology of the Cell 4, 445–457.CrossRefGoogle Scholar
MARTIN, P. J.,
ANDERSON, N. &
JARRETT, R. G.
(
1989).
Detecting benzimidazole resistance with faecal egg count reduction tests and in vitro assays.
Australian Veterinary Journal 66, 236–240.CrossRefGoogle Scholar
McKENNA, P. B.
(
1996).
Anthelmintic resistance in cattle nematodes in New Zealand, is it increasing?
New Zealand Veterinary Journal 44, 76.Google Scholar
NOGALES, E.,
WOLF, S. G. &
DOWNING, K. H.
(
1998).
Structure of the αβ tubulin dimer by electron crystallography.
Nature, London 391, 199–203.CrossRefGoogle Scholar
PAPE, M.,
SAMSON-HIMMELSTJERNA, G. VON &
SCHNEIDER, T.
(1999).
Characterization of the beta-tubulin gene of Cylicocyclus nassatus.
International Journal for Parasitology 29, 1941–1947.CrossRefGoogle Scholar
PARMENTIER, H. K.,
PLOEGER, H. W.,
NIEUWLAND, M. G. B.,
SOUREN, P. J. E.,
VAN PINXTEREN, L. A. H.,
RIETVELD, F. W.,
DEVRIES REILENGH, G. &
KLOOSTERMAN, A.
(
1995).
Low molecular weight Cooperia oncophora antigens: characterization and humoral immune responses in calves mono-infected with 100000 infective larvae.
Veterinary Parasitology 59, 219–230.CrossRefGoogle Scholar
PRICHARD, R.
(
1994).
Anthelmintic resistance.
Veterinary Parasitology 54, 259–268.CrossRefGoogle Scholar
PRICHARD, R. K.
(
2001).
Genetic variability following selection of Haemonchus contortus with anthelmintics.
Trends in Parasitology 17, 445–453.CrossRefGoogle Scholar
ROACH, M. C.,
BOUCHER, V. L.,
WALSS, C.,
RAVDIN, P. M. &
LUDUENA, R. F.
(
1998).
Preparation of a monoclonal antibody specific for the class 1 isotype of β-tubulin.
Cell Motility and the Cytoskeleton 39, 273–285.3.0.CO;2-4>CrossRefGoogle Scholar
ROOS, M. H.,
KWA, M. S. G. &
GRANT, W. N.
(
1995).
New genetic and practical implications of selection for anthelmintic resistance in parasitic nematodes.
Parasitology Today 11, 148–150.CrossRefGoogle Scholar
SAMSON-HIMMELSTJERNA, G. VON,
HARDER, A.,
PAPE, M. &
SCHNEIDER, T.
(
2001).
Novel small strongyle (Cyathostominae) beta-tubulin sequences.
Parasitology Research 87, 122–125.CrossRefGoogle Scholar
SAMSON-HIMMELSTJERNA, G. VON,
PAPE, M.,
VON WITZENDORFF, C. &
SCHNEIDER, T.
(
2002).
Allele-specific PCR for the beta-tubulin codon 200 TTC/TAC polymorphism using single adult and larval small strongyle (Cyathostominae) stages.
Journal of Parasitology 88, 254–257.CrossRefGoogle Scholar
SANGSTER, N.,
BATTERHAM, P.,
CHAPMAN, D. H.,
DURAISINGH, M.,
LE JAMBRE, L.,
SHIRLEY, M.,
UPCROFT, J. &
UPCROFT, P.
(
2002).
Resistance to antiparasitic drugs, the role of molecular diagnosis.
International Journal for Parasitology 32, 637–653.CrossRefGoogle Scholar
SCHWARZ, P. M.,
LIGGINS, J. R. &
LUDUENA, R. F.
(
1998).
β-tubulin isotypes purified from bovine brain have different relative stabilities.
Biochemistry 37, 4687–4692.CrossRefGoogle Scholar
SILVESTRE, A. &
CABARET, J.
(
2002).
Mutation in position 167 of isotype 1 β-tubulin gene of Trichostrongylid nematodes, role in benzimidazole resistance?
Molecular and Biochemical Parasitology 120, 297–300.Google Scholar
SILVESTRE, A.,
CABARET, J. &
HUMBERT, J.-F.
(
2001).
Effect of benzimidazole under-dosing on the resistant allele frequency in Teladorsagia circumcincta (Nematoda).
Parasitology 123, 103–111.CrossRefGoogle Scholar
SILVESTRE, A. &
HUMBERT, J. F.
(
2000).
A molecular tool for species identification and benzimidazole resistance diagnosis in larval communities of small ruminant parasites.
Experimental Parasitology 95, 271–276.CrossRefGoogle Scholar
TAYLOR, M. A.,
HUNT, K. R. &
GOODYEAR, K. L.
(
2002).
Anthelmintic resistance detection methods.
Veterinary Parasitology 103, 183–194.CrossRefGoogle Scholar
VERMUNT, J. J.,
WEST, D. M. &
POMROY, W. E.
(
1995).
Multiple resistance to ivermectin and oxfendazole in Cooperia species in cattle in New Zealand.
Veterinary Record 137, 43–45.CrossRefGoogle Scholar
VERMUNT, J. J.,
WEST, D. M. &
POMROY, W. E.
(
1996).
Inefficacy of moxidectin and doramectin against ivermectin-resistant Cooperia spp. of cattle in New Zealand.
New Zealand Veterinary Journal 44, 188–193.CrossRefGoogle Scholar
WALLER, P. J.
(
1997).
Anthelmintic resistance.
Veterinary Parasitology 72, 391–412.CrossRefGoogle Scholar
WALLER, P. J.,
ECHEVARRIA, F.,
EDDI, C.,
MACIEL, S.,
NARI, A. &
HANSEN, J. W.
(
1996).
The prevalence of anthelmintic resistance in nematode parasites of sheep in Southern Latin America: general overview.
Veterinary Parasitology 62, 181–187.CrossRefGoogle Scholar

Fig. 1. Alignment of the Co b1 and Co b2 sequences with other trichostrongylid beta-tubulins. The 24 amino acids unique to isotypes 1 and 2 are indicated by a filled circle. This alignment shows that the sequences in an isotype class show higher identity to each other than they do to the other isotype sequence from the same species. The autoregulation signal, MREI (Cleveland, 1988), is highlighted by a black line, as is the tubulin signature sequence at position 140–146. Binding of GTP to this glycine-rich region stimulates microtubule assembly (Hesse, Thiefauf & Ponstingl, 1987).
Fig. 2. Neighbour-joining tree showing the relationships among beta-tubulin predicted protein sequences. GenBank accession numbers are indicated with each sequence. The 2 beta-tubulin sequences cloned from Coperia oncophora are in bold type. The first sequence, C. oncophora isotype 1, groups with isotype 1 sequences from Haemonchus contortus and Teladorsagia circumcincta. The second sequence, C. oncophora isotype 2, is found on a distinct branch with similar sequences from H. contortus and Trichostrongylus colubriformis. Bootstrap values range from 50% to 100%. Sequences were aligned using CLUSTAL W on the SDSC Biology Workbench (Version 3.2), and phylogenetic analyses performed using MEGA Version 2.1 (Kumar et al. 2001).
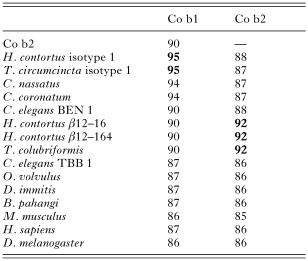
Table 1. Comparison of Cooperia oncophora beta-tubulin (Co b1 and Co b2) predicted proteins with other beta-tubulins for identity

Table 2. Determining the genotypes of individual worms based on amino acids at positions 167 and 200 of Co b1 gene
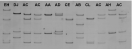
Fig. 3. SSCP of the Co b2 gene. The polyacrylamide gel was stained with ethidium bromide, and the banding pattern visualized using the Bio-Rad Molecular Imager FX. Samples in this figure were all from the IVS group. Eight of the 9 alleles identified for the Co b2 gene are shown here, labelled using a letter code. Homozygotes are represented by 2 bands (e.g. AA) and most of the heterozygotes are represented by 4 bands (e.g. EH). However, where 2 of the bands in the heterozygote have co-migrated, 3 bands are seen (e.g. DJ).
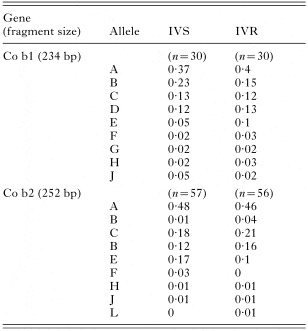
Table 3. Allele frequencies for Co b1 and Co b2 genes in IVS and IVR worms. In both genes, 9 alleles were identified
 You have
Access
- 34
- Cited by