INTRODUCTION
Laser ablation and pulsed laser deposition (PLD) are widely used techniques for surface property modification and to deposit thin films. The interaction of a high-energy laser pulse with a material depends on a variety of experimental parameters including among the others physical (laser wavelength, pulse duration and energy, target nature) and geometrical (laser spot size on the target surface, incidence angle) ones. If the energy density is low enough, i.e., below a threshold value that depends on the target properties, surface modifications can be induced without meaningful emission of material from the target. Above such a threshold, these modifications are associated to material ejection from the surface (Latif et al., Reference Latif, Anwar, Aleem, Rafique and Khaleeq-Ur-Rahman2009; Mirdan et al., Reference Mirdan, Jawad, Batani, Conte, Desai and Jafer2009; Trtica et al., Reference Trtica, Radak, Gakovic, Milovanovic, Batani and Desai2009; Wang et al., Reference Wang, Zheng and Zhou2009). When the emitted species are collected onto appropriate substrates positioned in front of the target, a thin film grows (Chrisey & Hubler, Reference Chrisey and Hubler1994; Veiko et al., Reference Veiko, Shakhno, Smirnov, Miaskovski and Nikishin2006). Moreover, having the emitted species high kinetic energies, they can be used as projectiles in particular ion implantation configurations (Wolowski et al., Reference Wolowski, Badziak, Czarnecka, Parys, Pisarek, Rosinski, Turan and Yerci2007).
Concerning the thin films deposition process, conceptually the technique is very simple, being solely based on the expulsion of matter from the surface of the target, driven by the absorption of the high intensity laser radiation. Despite the success to synthesize many elemental and compound materials, even with complex stoichiometry and the noticeable simplicity of the experimental set-up, the involved physical phenomena are complex and show an entangled dependence on several experimental parameters. A correspondingly high degree of complexity is found in the dependence of the structural, optical, electronic properties of the deposited films on the process parameters. This is reflected by the difficulty to a priori tailor the properties of the deposited films moving from the design of the deposition conditions. Recently, the possibility to grow materials with controlled structure at the nanometer scale using PLD was proved in the case of depositions in presence of an ambient gas at high pressure (Bailini & Ossi, Reference Bailini and Ossi2007; Wang et al., Reference Wang, Xu, Zhou, Chu and Fu2007, Geohegan et al., Reference Geohegan, Puretzky, Duscher and Pennycook1998). The presence of a gas atmosphere during the PLD process may have two different objectives: the use of a chemically reactive gas is necessary either to correct incongruent ablation or to introduce in the deposited film atomic species that are lacking in the target material. Typically, the pressure of the ambient gas is kept low to preserve the energy of the atomic species impinging onto the substrate, thus allowing compact, uniform films to grow. In the second scenario, inert gases at high pressure are mostly used. When laser generated plasma propagates through such a gas, an enhancement of the fluorescence is commonly observed, associated to relevant collisional behavior of plasma and ambient gas species. The plasma becomes spatially confined and most of its initial kinetic energy is converted into thermal energy leading to a rise of the temperature up to several thousands of Kelvin degrees (Zel'dovich & Raizer, Reference Zel'dovich and Raizer1966). Under such conditions, mutual aggregation of plasma constituents is favored thus opening the way to the synthesis of nanoparticles (NPs) during plasma propagation, and possibly to the growth of nanostructured materials by PLD. We mention that recently the combination of the two approaches was explored, depositing by radio frequency assisted PLD WOx films in a high O2 pressure, identifying suitable conditions to obtain nanostructured films with high porosity and good adhesion to the substrate (Filipescu et al., Reference Filipescu, Ossi, Santo and Dinescu2009).
Turning back to the case of plasma propagation through an inert gas, in a recent work, we studied the growth of Ag NPs deposited in a controlled Ar atmosphere at pressures higher than usually adopted for thin film deposition (Fazio et al., Reference Fazio, Trusso, Fazio, Neri, Ossi and Santo2007). The average sizes of Ag NPs obtained from an atomistic model (Ossi & Bailini, Reference Ossi and Bailini2008), using as input parameters plasma velocity, emission intensity, and temperature were compared with the ones measured by transmission electron microscopy images with good agreement. In this work, we extend our investigation on the modeling of the expansion of laser-generated plasma in presence of inert background gases. We studied Ag plasma expansion in He and Ar at different ambient pressures using intensified-charge coupled device (iCCD) fast photography (Trusso et al., Reference Trusso, Barletta, Barreca and Neri2004, Reference Trusso, Barletta, Barreca, Fazio and Neri2005; Thareja & Sharma, Reference Thareja and Sharma2006; Fazio et al., Reference Fazio, Neri, Ossi, Santo and Trusso2009, Hafeez et al., Reference Hafeez, Shaikh and Baig2008). The experimental results are compared to available phenomenological models that describe the expansion of laser-generated plasma in presence of a background atmosphere. In particular, mixed-propagation model (Bailini & Ossi, Reference Bailini and Ossi2007) gives a reasonable description of plasma expansion through Ar at high pressure, while a modified version of drag model and shock wave (SW) model well fit expansion in He in the early and intermediate stages of expansion, respectively.
EXPERIMENT
The Ag plasma was generated by a KrF excimer laser (wavelength 248 nm, pulse duration 25 ns, repetition rate 10 Hz), the laser beam was focused onto the target surface with a quartz lens at an incidence angle of 45°, the laser pulse energy was chosen in order to set the energy density at about 2.0 Jcm−2. We studied plasma expansion through Ar and He at different pressures controlled by a programmable mass flow controller. The experiments were performed at ambient pressures (p g) of 150, 350, and 700 Pa of He and of 10, 40, 70, and 100 Pa of Ar. Spots of the expanding plasma were acquired using an iCCD camera Andor iStar (DH-702). Time delays from the laser pulse were varied in the range between 80 ns and 60 µs. Intensification values and gate widths were varied as a function of the signal to noise ratio. Images were acquired during the deposition process of Ag thin films onto substrates positioned 40/35 mm in He/Ar far from the target. When experiments were performed in He the plasma reached the substrates after a time delay between 5 and 10 µs, depending on the ambient pressure, so that data are available up to this time delay; when expansion took place in Ar it can be followed up to time delays of 60 µs. The front position R(t) of the expanding plasma was extracted from the images using the intensity profile along the target to substrate direction, while the numerical values of the velocities v(t) were computed from suitably smoothed data. The Savitzky-Golay numerical algorithm was used for both smoothing and derivative procedures (Savitzky & Golay, Reference Savitzky and Golay1964).
RESULTS AND DISCUSSION
In Figure 1, the plasma front position as a function of the time delay with respect to the arrival of the laser pulse is reported. Figure 1a refers to plasma propagation in He at 150, 350, and 700 Pa. Data are available up to time delays of about 5 µs (at 150 Pa) and 10 µs (at 300 and 700 Pa): after these time intervals the plasma reached the substrate facing the target. Two well-separated time stages of expansion can be observed. In the early stage, plasma moves following a free-like expansion as is usually observed in vacuum. This stage seems to be weakly, if not affected by the ambient pressure: the data points recorded at different pressures lie on nearly coincident curves up to a time delay of about 600–700 ns, as shown in the inset of Figure 1a. Thereafter, interaction with the ambient gas slows down the plasma leading to deviations from the linear behavior: such a slowing down is more and more effective with increasing ambient gas pressure. Qualitatively, similar results are found for plasma expansion in Ar, as illustrated in Figure 1b. Again, an initial free-like expansion is observed but deviations from the linear behavior ceases (see the inset of Figure 1b) already after 200–300 ns. In Ar atmosphere slowing down effects are faster than in He and at time delays beyond about 6 µs, the plasma is observed to move very slowly, or even to stop.
Distance traveled by the silver plasma in (a) He and (b) Ar at different pressures. The insets show the initial expansion stages.

Several phenomenological models were proposed to describe the expansion of laser-generated plasma through an ambient gas. From the detailed analyses of the most popular drag (Geohegan et al., Reference Geohegan1992, Reference Geohegan, Chrisey and Hubler1994; Gonzalo et al., Reference Gonzalo, Afonso and Madariaga1997), SW (Zel'dovich & Raizer, Reference Zel'dovich and Raizer1966), and diffusion (Rode et al., Reference Rode, Gamaly and Luther-Davies2000) models (Fazio et al., Reference Fazio, Neri, Ossi, Santo and Trusso2009, Gonzalo et al., Reference Gonzalo, Afonso and Madariaga1997), we recall that no one of them gives a satisfactory description of the full expansion process, so that a detailed description of a laser generated plasma expanding through a background gas is still lacking. Recently, one of us proposed a two-step mixed-propagation model that describes the propagation process over a wide time interval for several classes of ablated materials expanding through different ambient gases (Bailini et al., Reference Bailini, Ossi and Rivolta2007). The model, that is conceptually simple and easily applicable to interpret experimental results, is based on modified versions of both drag and diffusion models. In the drag model, the plasma is considered as an ensemble of particles, which expands experiencing a viscous force due to the presence of the ambient gas; the position R of the plasma front edge is given by: R(t) = R 0(1 − e βt), where R 0 is called stopping distance and represents the distance at which the plasma is expected to stop according to the model, while β is a slowing down coefficient. Essentially, in the mixed-propagation model drag model predictions are assumed to hold in the initial stage of plasma expansion, provided the phenomenological parameters R 0 and β are replaced by R′0 = v 0D/μ and β′ = μ/D′, respectively. v 0 is the initial plasma velocity, μ a slowing down coefficient (a diffusion coefficient multiplied by time) and D′ a modified diffusion coefficient. Thereafter plasma expansion is described by a diffusion-like equation 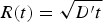 . According to gas kinetic theory the diffusion coefficient is D = (λν)/3, with λ = (n gσ)−1 the mean free path, n g the gas number density,
 the relative velocity of the colliding particles and
 the scattering cross section. In the mixed propagation model, the diffusion coefficient D is replaced by D′ = kv 0(n gσ)−1 (Bailini & Ossi, Reference Bailini and Ossi2006), k being an integer number that depends on the atomic mass of the target. Thus, mixed-propagation model describes plasma expansion by means of a two-step combination of modified versions of drag and diffusion models.
For the expansion of Ag plasma in Ar, experimental data are available over a considerable time interval; moreover the plasma is not observed to come into contact with the substrate, so that we can test mixed-propagation model at depth. Experimental data were fitted using the following equation:

The first term describes the viscous plasma motion in the first expansion stage, until it has traveled, at the time delay t 0D, the distance R 0D from the target surface. Such a position is taken as the origin of a subsequent diffusion like expansion stage, governed by a diffusion coefficient D″. The latter has the same functional form as D′, except that the velocity v 0D, namely plasma velocity at time t 0D, i.e., at position R 0D, is used instead of the initial velocity v 0; the corresponding expression is D″ = Kv 0D(n gσ)−1. Thus, v 0D is at the same time the plasma residual velocity at the end of the first expansion stage and the initial plasma velocity at the beginning of the modified diffusion stage of expansion. In Figure 2, we report the results of the fitting procedure for plasma propagation in Ar at 70 Pa. Experimental data were fitted using Eq. (1) with the parameters β, R 0D, and v 0D. The dashed line refers to the fit where the first term of Eq. (1) (drag model) holds up to the position R 0D, thereafter, data are fitted with the second term of Eq. (1) (diffusion model) using the diffusion coefficient D″ calculated using the v 0D value as obtained from the fit. In Figure 2, the full square marks the position at which the velocity v 0D is imposed to the plasma. Similar results were obtained for expansions in Ar at all the other investigated pressures: remarkably, at 10 Pa a satisfactory fit was obtained up to time delay of 20 µs (Neri et al., Reference Neri, Ossi and Trusso2010). The values of the parameters obtained from the fitting procedure are reported in Table 1. The initial plasma velocity v 0 is deduced from the fitted R 0D and β; the values nearly coincide with those obtained directly from the slope at the origin of the experimental data. v 0 values decrease from 1.56 cm μs−1 at 10 Pa down to 1.18 cm μs−1 at 100 Pa pointing out that interaction between the plasma and Ar gas leads to meaningful deviations from a free propagation since the very initial stage of expansion. The agreement between Eq. (1) and experiment is good especially in the initial and late stages of expansion. Nevertheless, some considerations are in order. In the frame of the original drag model, the R 0 parameter indicates the maximum expansion distance of the plasma; by contrast, in the present modified model R 0D sets an unphysical discontinuity that separates two different plasma expansion regimes. Consequently, the fit accuracy is poorer along a time interval centered around t 0D, i.e., at the transition between the two different expansion regimes. Such an inaccuracy is intrinsic to mixed-propagation model and corresponds to its (over) simplified structure that does not take into account the possibility that a SW develops during plasma propagation. The simplification is acceptable in cases like that of Ag plasma propagation in Ar, where the SW duration is typically limited to about 1 µs at 70–100 Pa and about 4 µs at 10 Pa, as can be seen from Figure 2 (see the grey area and the inset). However, not always SW formation can be neglected. The analysis of Ag plasma propagation through He is clarifying in this respect.
Position R as a function of time t of the plasma front edge expanding in Ar at 70 Pa. Continuous and dashed lines refer to the fit with Eq. (1) adopting modified drag and modified diffusion models respectively. The full square marks the position (R 0D = R(t 0D)) at which the plasma moves with fitted v 0D velocity. The grey area indicates the time interval where the SW regime holds (in the inset the data are plotted as log(R) vs. (2/5)log(t)).

Experimental conditions and mixed-propagation model parameters for Ag plasma expansion in Ar

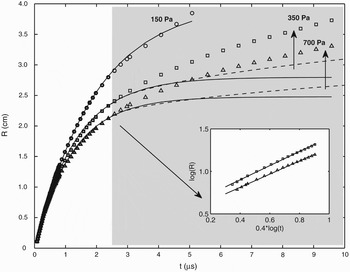
In Figure 3, the results of the fits to data points for such expansions at different He pressures are shown, using mixed-propagation model. The continuous lines refer to modified drag model. In He at 150 Pa, the model fits well the experimental data along the whole target to substrate path, but at higher pressures, drag model alone is unable to fit all the observed expansion behavior. Thus, the fitting procedure using drag model was limited to the initial stage of expansion up to time delays of 3 µs. The obtained values of the two parameters R 0 and β are reported in Table 2 together with the classical diffusion coefficient D, the deduced initial plasma velocity v 0 and the modified diffusion coefficient D′ calculated with mixed-propagation model. We notice that v 0 is nearly independent of ambient gas pressure and equal to about 2.1 cmμs−1, an indication that in the early stage of expansion plasma motion is free-like, being nearly insensitive to the ambient pressure. At 150 Pa drag model alone provides an accurate description of the expansion, as already noticed, while at higher pressures and beyond time delays of 3 µs the distances traveled by the plasma are systematically larger than those predicted by modified drag model. In Figure 3, the dashed lines, lying nearly parallel to the data points and below them, refer to plasma motion as represented by modified diffusion model, thus adopting the diffusion coefficient D′ in the framework of a diffusion equation, as discussed above. Such a diffusive motion is imposed to the plasma from a time delay of about 2.5 µs, corresponding to a distance of 2.2–2.5 cm from the target, i.e., to the instant when modified drag model begins to fail to fit experimental data. Again, the model underestimates the distance traveled by the plasma (see dashed lines in Fig. 3), which over the considered region moves at higher velocity than the one predicted by modified diffusion model. We can interpret this situation comparing the physical picture of the expanding plasma with the simplified two-stage propagation mechanism associated with mixed-propagation model, thereby SW formation is neglected. A SW is observed when the mass of gas surrounding the expanding plasma becomes higher than the mass of the ablated material and persists up to distances from the target surface where the pressure, driving the plasma motion remains higher than ambient gas pressure. The space and time extension of such a limited region depends on plasma energy and on ambient gas pressure. The formation of a bright edge at the contact surface between the plasma and the ambient gas in the iCCD pictures of the expanding plasma (Trusso et al., Reference Trusso, Barletta, Barreca and Neri2004) indicates that a SW developed. In Figure 4, we report the iCCD images acquired in He atmosphere at different pressures. At a time delay of 1 µs (Fig. 4a) the plasma appears nearly spherical, being slightly lengthened along the target to substrate direction. The role played by the ambient gas is evident, being the plasma slower at higher He pressures. At a time delay of 3 µs for all the investigated He pressures, the formation of a SW is evident (Fig. 4b). Thus, beyond this time delay, plasma motion is better described by SW rather than by diffusion model. As a confirmation, in the inset of Figure 3, the plasma front position at time delays beyond 3 µs shows an almost linear behavior when plotted as log(R) vs. (2/5) log(t), according to SW model (Zel'dovich & Raizer, Reference Zel'dovich and Raizer1966). Diffusion should set in at the end of SW regime but it cannot be observed in our experiments due to the lack of data because the plasma touched the substrate. We observed and modeled the qualitatively different expansion regimes that characterize plasma propagation in He and, respectively, in Ar, in particular the different weight of the SW regime. This reflects the differences between the scattering efficiency of gas atoms and plasma species. In mixed-propagation model, the latter is embodied in the number densities of ambient gas and ablated species; yet it is apparent that light He at by far higher pressures than Ar slows down Ag plasma less efficiently than massive Ar. A forthcoming modeling step is to take into account more properly the role of gas and plasma masses.
Ag plasma expansion in He at different pressures. General information as for Figure 2. The grey area marks the time interval where SW formation is observed (in the inset data recorded in He at 350 and 700 Pa are plotted as log(R) vs. (2/5)log(t)).

Spots of the plasma expanding in He, at different pressure values (top 150 Pa; middle 350 Pa; bottom 700 Pa), acquired at time delays of (a) 1 µs and (b) 3 µs with respect to the arrival of the laser pulse at the target surface.

Experimental conditions and modified drag model parameters for Ag plasma expansion in He

CONCLUSIONS
In conclusion, starting from a detailed analysis of fast photo images of a laser generated Ag plasma expanding through He and Ar at high pressures, we investigated the propagation dynamics using currently available phenomenological models. Mixed-propagation model offers a good picture of the initial and delayed plasma expansion stages in Ar, provided that appropriate input parameters are used. In He, only the initial quasi-linear expansion and SW formation were observed along the space available to plasma motion. A critical comparison of the two cases is provided.