INTRODUCTION
Sciaenid fish are reported to be the most important fishery resource in the coastal and estuarine ecosystems of the world (Chao, Reference Chao, Uyeno, Arai, Taniuchi and Matsuura1986; Nelson, Reference Nelson2006). It is also the most abundant family of the soft-bottom demersal fish community on the coasts of southern and south-eastern Brazil (Rocha & Rossi-Wongtschowski, Reference Rocha and Rossi-Wongtschowski1998). Among them, the species considered for this study was the banded croaker, Paralonchurus brasiliensis (Steindachner, 1996), a sciaenid that is very frequent, abundant and a common by-catch of shrimp fishery trawls on the south-eastern Brazil coast (Nonato et al., Reference Nonato, Amaral and Figueiredo1983; Braga et al., Reference Braga, Braga and Goitein1985; Braga, Reference Braga1990; Haimovici et al., Reference Haimovici, Martins and Vieira1996). This species is widely distributed along the Atlantic coast from Central to South America and it can reach 30 cm in total length (Menezes & Figueiredo, Reference Menezes and Figueiredo1980). Banded croaker is considered a keystone species associated with shallow waters (Rossi-Wongtschowski et al., 2008), playing an important role in the trophic structure of the ecosystem (Soares & Vazzoler, Reference Soares and de M. Vazzoler2001; Soares et al., Reference Soares, Muto, Gasparro and Rossi-Wongtschowski2008).
The depth, substrate type, temperature and salinity have been reported as the main environmental factors that affect the demersal fish populations (Koranteng, Reference Koranteng2001; Araújo et al., Reference Araújo, Azevedo, Silva, Pessanha, Gomes and Cruz-Filho2002; Catalán et al., Reference Catalán, Jiménez, Alconchel, Prieto and Muñoz2006; Katsanevakis et al., Reference Katsanevakis, Maravelias, Damalas, Karageorgis, Tsitsika, Anagnostou and Papaconstantinou2009). Seasonal fluctuations in the by-catch capture are associated with the oceanographic factors, such as, the intrusion and return flow of the water masses that implies changes of the temperature, salinity and nourishment conditions (Dias & Katsuragawa, Reference Dias and Katsuragawa2009). According to Pires-Vanin et al. (Reference Pires-Vanin, Rossi-Wongtschowski, Aidar, Mesquita, Soares, Katsuragawa and Matsuura1993) the movements of the water masses also influence the seasonal distribution of the benthic organisms and dynamics of the ecosystems.
Identifying changes in the abundance of demersal fish in space and time, as well as to investigate correlates with environmental factors are important for fishery management and the marine ecosystems. Moreover, changes in the abundance of keystone species have critical effects on community structure and ecosystem function (Jennings et al., Reference Jennings, Kaiser and Reynolds2000). Thus, the aim of the present work was to contribute to the knowledge on the temporal and spatial variation in the density of P. brasiliensis on the south-eastern Brazil coast, explaining these variations through characterization of the environmental data, such as temperature, salinity and sediment characteristics.
MATERIALS AND METHODS
Study area
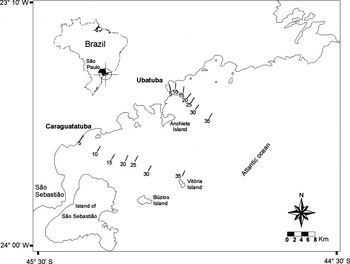
The study sites are located on the inner platform of the coastal system of Ubatuba and Caraguatatuba, northern coast of São Paulo State, south-eastern Brazil. The Caraguatatuba region is considered a sheltered area as compared to Ubatuba due to the presence of the islands of Vitória, Búzios and São Sebastião (Figure 1). These areas are strongly influenced by three water masses: Tropical Waters (TW) with high temperature and salinity (TW, T > 20°C and S > 36); South Atlantic Central Waters (SACW) with low temperature and salinity (SACW, T < 20°C, S < 36) and Coastal Waters (CW) with high temperature and low salinity (CW, T > 20°C, S < 36) (Castro-Filho et al., Reference Castro-Filho, Miranda and Myao1987; Castro-Filho & Miranda, Reference Castro-Filho, Miranda, Robinson and Brink1998). The main factor that influences the environmental conditions in the study areas is the seasonal presence of the SACW on the inner shelf in isobaths from 10 to 50 m (Pires-Vanin & Matsuura, Reference Pires-Vanin and Matsuura1993). Especially during summer and later spring, a thermocline is formed in the depths ranging from 20 to 50 m with the upper layer filled with CW and the lower layer with SACW (Matsuura, Reference Matsuura1986). During winter the SACW is restricted to the outer shelf and the inner shelf is filled with the CW (Castro-Filho et al., Reference Castro-Filho, Miranda and Myao1987).
Map of study area: Ubatuba and Caraguatatuba indicating the sampling mean depths (5, 10, 15, 20, 25, 30 and 35 m).

Data collection
The specimens of P. brasiliensis were captured from January to December 2002. The seasons of the years were defined as summer (January to March), autumn (April to June), winter (July to September) and spring (October to December). The samplings were carried out using a shrimp-fishing boat equipped with two otter trawl nets. A total of seven mean depths (5, 10, 15, 20, 25, 30 and 35 m) based on the fish distribution were established for trawling (Figure 1). Each depth was trawled over 30 minutes sampling an area of 18,000 m2 according Castilho et al. (Reference Castilho, Furlan, Costa and Fransozo2008a). After trawling, the specimens of P. brasiliensis were separated from the other organisms captured and the number of individuals collected was registered.
The environmental factors, such as, temperature, salinity, organic matter and the mean grain size of the sediment (phi = φ) were calculated in each depth. Water samples were taken with a Nansen bottle. Temperature measurements and water samples for salinity analysis were taken at discrete depths also with a Nansen bottle. An echobathymeter coupled with a Global Positioning System was used to determine the mean depth. Sediment samples were collected in each depth with a Van Veen grab (0.06 m2). In the laboratory about 200 g of the sediment was dried at 70°C for 24 hours, divided into subsamples and submitted to organic matter and grain-size analysis (Mantelatto & Fransozo, Reference Mantelatto and Fransozo1999). The organic matter (%) content was obtained following Mantelatto & Fransozo (Reference Mantelatto and Fransozo1999) and the grain-size composition following Castilho et al. (Reference Castilho, Furlan, Costa and Fransozo2008a, Reference Castilho, Pie, Fransozo, Pinheiro and Costab).
The sediment size was calculated in accordance with the Wentworth (Reference Wentworth1922) scale, in which the sediment is sieved in six sieves with different diameters, as follows: sediment sieved through 2 mm = gravel; 2.0 ⊣ 1.0 mm = very coarse sand; 1.0 ⊣ 0.5 mm = coarse sand; 0.5 ⊣ 0.25 mm = medium sand; 0.25 ⊣ 0.125 mm = fine sand; 0.125 ⊣ 0.063 mm = very fine sand, and smaller particles were classified as silt–clay. Cumulative particle-size curves were plotted using the φ scale with values corresponding to the 16th, 50th and 84th percentiles being used to determine the mean diameter (Md) of the sediment, as per the equation: Md = (φ16 + φ50 + φ84)/3 (Folk & Ward, Reference Folk and Ward1957). The φ values were calculated using the equation proposed by Tucker (Reference Tucker1988), where φ = –log2d (d, grain diameter in mm). Finally, the type of sediment of each mean depth was classified based on φ value ranges: –1 = φ < 0 (very coarse sand); 0 = φ < 1(coarse sand); 1 = φ < 2 (medium sand); 2 = φ < 3 (fine sand); 3 = φ < 4 (very fine sand) and φ ≥ 4 (silt–clay).
Data analysis
The spatial and temporal variation of the temperature and salinity were explored through the construction of isothermal and isohaline diagrams generated by surfer Software (Golden Software, 2002). The interpolation was made by a ‘kriging algorithm’ for a linear variogram model. In this method, the contouring creates different size polygons from the dataset, and for this reason, the generated diagrams may not match exactly the sampled area.
The density of P. brasiliensis was calculated as: total number of fish collected divided by area trawled (m2) multiplied by 1000.
Two-way analysis of variance was applied to test the spatial–temporal interaction of the environmental variables (temperature, salinity, organic matter and φ value) and density (fish per m2), considering the region, season and depths as factors (Gotelli & Ellison, Reference Gotelli and Ellison2004). The influence of the environmental factors on the species density was evaluated by multiple linear regressions. The multiple correlation coefficient (R) was used to measure the density variability explained by the independent environmental factors (Cohen et al., Reference Cohen, Cohen, West and Aiken2003). The Student's t-test was applied to test the significance of each environmental variable to the multiple regression models. Only significant variables were included in the final model. Prior to the analysis, the data were tested for normality and homogeneity of variances using the Kolmogov–Smirnov and Levene's tests. The data were log10 (x + 1) transformed where appropriate (Zar, Reference Zar1999). The mean ± standard deviation is given in parentheses in the text.
RESULTS
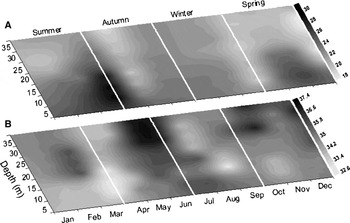
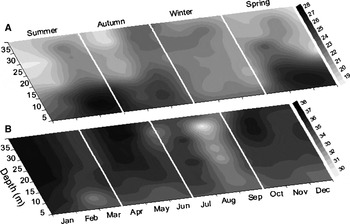
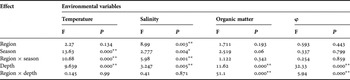
The statistical analysis showed significant variation of the temperature and salinity by season and depth, however only spatial variation was observed for organic matter and φ in the study regions (Table 1). In general, water temperature and salinity ranged from 16 to 29.5°C (22.3 ± 2.50) and 33 to 37°C (35.4 ± 1.01), respectively. The highest values of temperature were registered in depth up to 20 m isobath at Ubatuba and 15 m isobath at Caraguatatuba along with low values of salinity. However, the lowest temperature and highest salinity occurred in depths that ranged from 20 to 35 m. The seasonal and spatial variations of temperature and salinity for Ubatuba and Caraguatatuba are shown in Figures 2 & 3, respectively.
Spatial and temporal variation of isotherms (A) and isohalines (B) at Ubatuba region, south-eastern Brazilian coast. Isotherms and isohaline are separated by 0.5°C and 0.2, respectively.

Spatial and temporal variation of isotherms (A) and isohalines (B) at Caraguatatuba region, south-eastern Brazilian coast. Isotherms and isohaline are separated by 0.5°C and 0.5, respectively.

Results of the two-way analysis of variance of mean environmental variables by region, season and transect. Significant differences at the level of 0.05* and 0.01**.

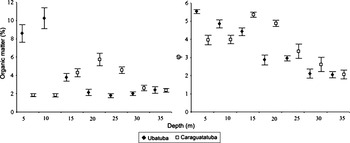
The organic matter content ranged from 0.8 to 17.4% (3.87 ± 3.09) showing highest values in the depths up to 10 m at Ubatuba and 15 and 20 m at Caraguatatuba. The minimum value of φ registered was 0.24 and maximum was 6.42 (3.63 ± 1.44) in both regions. In Ubatuba region a decrease of the φ towards the mean depth of 35 m was observed indicating an increase in the mean size of the sediment grain, whereas at Caraguatatuba the highest φ value was registered in depths of 15 and 20 m indicating a predominance of silt–clay. The φ analyses indicated that the sediment composition in both regions ranged from coarse sand to silt–clay. The seasonal and spatial variations of organic matter and φ are shown for both regions in Figure 4.
Spatial variation of organic matter and φ sampled at Ubatuba and Caraguatatuba regions located on the northern coast of São Paulo State, south-eastern Brazil. Mean ± standard deviation are given for each region.

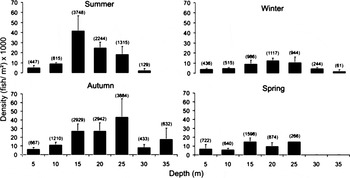
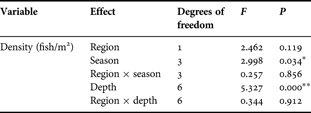
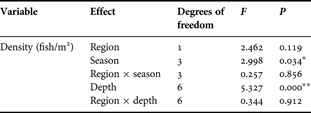
A total of 29,808 specimens of P. brasiliensis were collected from the shrimp fishery trawl during the study period. Out of this, 12,642 individuals were collected at Ubatuba and 17,166 at Caraguatatuba. The density in the former region ranged from 0.13 to 108.9 fish m−2 (13.39 ± 17.93) whereas in the latter, it ranged from 0.12 to 134.69 fish m−2 (18.18 ± 22.57). No significant difference was found between the densities of P. brasiliensis collected from the two regions. On the other hand the density varied significantly by season and depth (Table 2). Thus, the highest densities were registered during the summer and autumn and the lowest during the winter and spring. In general, the highest density was registered in the depth-range of 15–25 m. No individual was captured in 35 m isobaths during the winter and 30 and 35 m isobaths during the spring (Figure 5).
Variation in mean + standard deviation density of Paralonchurus brasiliensis captured as by-catch by season and mean depth. On the bar in parentheses, is indicated the total number of individuals captured.

Results of the two-way analysis of variance of mean abundance by region, season and depth. Significant differences at the level of 0.05* and 0.01**.
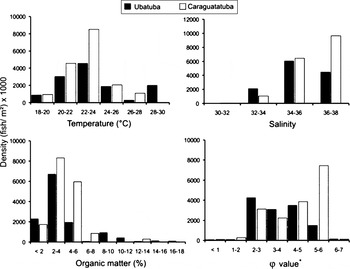
In general, the highest densities of P. brasiliensis were registered in temperatures that ranged from 22 to 24°C and salinities that ranged from 34 to 36 at Ubatuba and 36 to 38 at Caraguatatuba. In relation to characteristics of the sediment, the highest density was registered in sediment in which the organic matter content ranged from 2 to 4% and φ ranged from 2 to 5 at Ubatuba and 5 to 6 at Caraguatatuba (Figure 6).
Variation of the mean density of Paralonchurus brasiliensis collected in the regions Ubatuba and Caraguatatuba by classes of environmental factors. *, φ values range: –1 = φ < 0 (very coarse sand); 0 = φ < 1 (coarse sand); 1 = φ< 2 (medium sand); 2 = φ < 3 (fine sand); 3 = φ < 4 (very fine sand); φ ≥ 4 (silt–clay).

The results of the application of the multiple regression were significant for Ubatuba (F = 6.64; P < 0.001) and Caraguatatuba (F = 5.59; P < 0.001) with the environmental variables affecting positively the variance of P. brasiliensis density. In the first region, the temperature (t = 2.90, P < 0.01) and φ (t = 2.42, P < 0.05) explained 50.17% of the variance, however no significant effect of the salinity (t = 0.20, P > 0.05) and organic matter (t = 0.11, P > 0.05) was observed. In relation to the former region, the organic matter (t = 1.99, P < 0.05) and the φ (t = 3.13, P < 0.01) were the most important factors explaining 48.92% of the variance. On the other hand, no significant effect of the temperature (t = 1.57; P > 0.05) and salinity (t = –0.27; P > 0.05) was observed in Caraguatatuba. The final model for both regions was expressed as follows: DUbatuba = –2.50 + 0.11* T + 0.23* φ and DCaraguatatuba = –1.05 + 0.82* OM + 1.37* φ where: D = density (fish/m2), T = temperature, φ = phi and OM = organic matter.
DISCUSSION
This investigation registers a significant variation in the environmental factors and density of P. brasiliensis during the study period in south-eastern Brazil. The fish capture fluctuates in space and time (Jennings et al., Reference Jennings, Kaiser and Reynolds2000). Lowe-Mcconnell (Reference Lowe-Mcconnell1977, Reference Lowe-Mcconnell1987) reported that the depth, water temperature, salinity and type of bottom are the main factors responsible for this fluctuation in tropical waters.
In accordance with Matsuura (Reference Matsuura1986) and Borzone et al. (Reference Borzone, Pezzuto and Marone1999), depths from the shore to the 50 m isobath are occupied by the CW in south and south-eastern Brazil, mainly during the summer. However, the presence of the CW occupying the coastal area during the autumn was registered by Pires-Vanin (Reference Pires-Vanin2001) in São Sebastiaõ Channel, inner shelf of São Paulo. In the present study, the highest densities of P. brasiliensis occurred in waters where the temperature ranged from 22 to 24°C. This temperature range along with low salinity indicates the presence of the CW. High temperature (20–22°C) and low salinity (34–35) was also observed by Léo & Pires-Vanin (Reference Léo and Pires-Vanin2006) in south-eastern Brazil, which indicated the presence of the CW in depths up to 40 m isobath. Low salinity water mass is highly influenced by runoff caused by rainfall in the inner shelf (from the shore to 50 m isobath) (Occhipinti, Reference Occhipinti1963; Metzler et al., Reference Metzler, Glibert, Gaeta and Ludlan1997). Thus, the presence of the CW on the coast of Ubatuba and Caraguatatuba was more expressive during the summer, showing the highest temperature registered during the study period.
Several works on ichthyofauna and demersal fish captured as by-catch by shrimp trawl, in south and south-eastern Brazil, also indicated that banded croaker was captured more during the summer and autumn (Nonato et al., Reference Nonato, Amaral and Figueiredo1983; Coelho et al., Reference Coelho, Graça-Lopes, Rodrigues, Puzzi and Farias1993; Rossi-Wongtschowski et al., Reference Rossi-Wongtschowski, Soares and Muto2008). Cátalan et al. (2006) reported that the combined effect of reproductive period or ontogenetic migrations and recruitment episodes can explain the seasonal changes in the abundance of demersal fish populations in coastal areas. Costa (Reference Costa2010) registered that the smallest individuals along with high number of juveniles of banded croaker were captured as by-catch in Ubatuba and Caraguataba regions, mainly during the summer and autumn, whereas the adults predominated during the winter and spring. Thus, the temporal variation in the density of banded croaker in the study areas can be attributed to the population behaviour such as recruitment and reproductive patterns, since the life cycle of this species is adapted to shallow areas (Braga, Reference Braga1990).
Previous studies carried out by Castro-Filho et al. (Reference Castro-Filho, Miranda, Silva, Fontes, Pereira and Coelho2008) on the northern coast of São Paulo, registered that the SACW intrusion reached depths up to 50 m during the summer and 25 m during the spring. The absence of individuals captured in depths more than 25 m during spring can be attributed to the intrusion of the SACW since lowest values of temperature (mean of 20°C) associated with salinity around 36 were registered during this season. Our results corroborate those of Rossi-Wongtschowski & Paes (Reference Rossi-Wongtschowski and Paes1993), who while studying the spatial–temporal distribution of the demersal fish community on the coast of Ubatuba, observed that the population of P. brasiliensis moved to shallow water (20 m) during the intrusion of the cold water mass.
Influence of the SACW on the spatial–temporal distribution of fish, including the sciaenid species, was observed by Rocha et al. (Reference Rocha, Fernandez and Paiva-Filho2010) in shallow waters in Palmas Bay, Ubatuba. However, the multiple regression analysis indicated the temperature as a significant factor only for the Ubatuba region, probably due to the fact that this region is more exposed than Caraguatatuba which reflects in an intense action of water masses such as SACW.
Depth appears to be an important factor in the spatial distribution of banded croaker, as they are more abundant in depths that range from 15 to 25 m. Souza et al. (Reference Souza, Costa, Martins and Fransozo2008) reported the influence of the depth on the abundance of P. brasiliensis in the inner shelves of Ubatuba, Caraguatatuba and São Sebastião. Coelho et al. (Reference Coelho, Puzzi, Graça-Lopes, Rodrigues and Prieto1986) while studying the bottom trawling fisheries of the shrimp Xiphopenaeus kroyeri on the coast of São Paulo, registered that the sciaenids accounted for 60% from all fish captured as by-catch in the isobaths of 25 m. Our results also corroborate those of Vazzoler (Reference Vazzoler1975) and Haimovici et al. (Reference Haimovici, Martins and Vieira1996) who reported on abundance of this sciaenid species in 20 m depths on the coastline of southern Brazil.
The type of sediment is of fundamental importance to the demersal fish distribution. Sand, mud, clay, rock and coral exhibit a specific fish community and invertebrates that are important as food for demersal fish (Lowe-Macconnell, 1987). In general, banded croaker showed high density in depths where the sediment ranged from fine sand to silt–clay. Braga et al. (Reference Braga, Braga and Goitein1985) reported that P. brasiliensis shows preference for prey that live above or that burrow in the sediment, mainly crustaceans and polychaetes. These benthic invertebrates are more abundant in fine sediment due to high concentration of detritus and nutrients (Furtado et al., Reference Furtado, Barcellos, Conti, Rodrigues and Mahiques2008; Soares et al., Reference Soares, Muto, Gasparro and Rossi-Wongtschowski2008). Furthermore, the distribution of these benthic communities is affected by depth and the seasonal intrusion of water masses on the Brazilian south-eastern shelf (Pires, Reference Pires1992; Pires-Vanin & Santos Reference Pires-Vanin and Santos2004; Léo & Pires-Vanin, Reference Léo and Pires-Vanin2006).
Muto et al. (Reference Muto, Soares and Rossi-Wongtschowski2000) and Rossi-Wongtschowski et al. (Reference Rossi-Wongtschowski, Soares and Muto2008) reported that depth and temperature were the main factors that influenced the spatial–temporal variations in the demersal fish community in the São Sebastião region. However, the environmental factors can influence the distribution of a unique species in different ways in different regions. Thus, the factors closely related to sediment can be more important in a sheltered area than an exposed one, which can explain the significant effect of the φ and organic matter content on the variance of P. brasiliensis density in Caraguatatuba. In general, the variation of this fish population density can be attributed mainly to the presence of the water masses and the type of the sediment that is related to the location of the area and food availability.
Studies on the P. brasiliensis population on the coastal areas, mainly in shrimp fishery ground, are scarce despite the importance of this species for the ecosystem. However studies focusing on reproduction, growth, feeding and early development stages in relation to environmental factors and shrimp trawl fishery would help to understand better the population dynamics and its role in the ecosystem.
ACKNOWLEDGEMENTS
The authors are grateful to FAPESP (Fundação de Amparo à pesquisa do Estado de São Paulo) for financial support, to the NEBECC for samplings, the CAPES/REUNI for a Postgraduate Scholarship, Dr Sathyabama Chellappa for the English review (UFRN) and two anonymous referees for valuable comments that helped us improve this paper.