Introduction
Understanding spatial snow particle size variation is important to the investigation of snow surface processes using remote sensing and to the modelling of surface processes. In Antarctica, remote sensing is the only viable option to estimate the surface mass balance of the ice sheet on a continental scale. Using remote sensing, cryospheric parameters subjected to rapid transformation due to climate change can be monitored. The effects of climate change on the many aspects of the cryosphere are of widespread interest (e.g. ACIA 2005, Lemke et al. Reference Lemke, Ren, Alley, Allison, Carrasco, Flato, Fujii, Kaser, Mote, Thomas and Zhang2007). An area of particular importance is the East Antarctic Ice Sheet, and specifically, its surface mass balance, which is poorly determined (e.g. Lemke et al. Reference Lemke, Ren, Alley, Allison, Carrasco, Flato, Fujii, Kaser, Mote, Thomas and Zhang2007). Measuring Antarctic mass balance is difficult because of the continental scale of the investigation, despite co-ordinated efforts, such as those of the SCAR expert group, on ice sheet mass balance and sea-level contribution (ISMASS Committee 2004). Mass balance fluctuations involve changes in elevation, which can be determined by satellite-based remote sensing techniques, such as radar and laser altimetry (Zwally et al. Reference Zwally, Giovinetto, Li, Cornejo, Beckley, Brenner, Saba and Yi2005), although any elevation change also involves dynamic effects including snow densification (Shuman et al. Reference Shuman, Zwally, Schutz, Brenner, DiMarzio, Suchdeo and Fricker2006). To correctly interpret the recorded elevation changes, the remote sensing techniques rely on knowing the radiometric response of the observed snow surface at the relevant wavelength, typically near-infrared or microwave (Wiscombe & Warren Reference Wiscombe and Warren1980). The radiometric response is determined by the properties of the snow pack including its stratigraphy, the occurrence and spacing of any ice layers snow density variations, and the snow grain size distribution (Painter et al. Reference Painter, Rittger, McKenzie, Slaughter, Davis and Dozier2009). Understanding spatial variability in the snow parameters is important when incorporating field data in remote sensing analysis and modelling. Hence, it is vital to provide spatially extensive ground truth data of snow properties for validation purposes.
In this paper we will use the term snow particle size as equivalent to snow grain size. Strictly, a ‘grain’ should refer to an individual crystal and a ‘particle’ should refer to an individual object and not its constitution. The generic term ‘particle’ is used for this study. However, we will refer to grain size when referring to published material in order not to alter the content of the original text, but it is probable that the term ‘grain’ has been used in the same sense as ‘particle’ in many of the studies. For remote sensing purposes, snow grain sizes are often used as an optical equivalent based on its scattering properties, such as optical grain size, effective grain radius and specific surface area (Wiscombe & Warren Reference Wiscombe and Warren1980, Domine et al. Reference Domine, Albert, Hultwelker, Jacobi, Kokhanovsky, Lehning, Picard and Simpson2008). Thus far, only limited research on snow grain or particle size variability has been carried out in Dronning Maud Land (DML), East Antarctica (e.g. Gay et al. Reference Gay, Fily, Genthon, Frezzotti, Oerter and Winther2002, Kärkäs et al. Reference Kärkäs, Granberg, Kanto, Rasmus, Lavoie and Lepparanta2002, Reference Kärkäs, Martma and Sonninen2005). Both Gay et al. (Reference Gay, Fily, Genthon, Frezzotti, Oerter and Winther2002) and Kärkäs et al. (Reference Kärkäs, Granberg, Kanto, Rasmus, Lavoie and Lepparanta2002) preformed digital image photography utilizing different types of image analysis in order to retrieve snow grain size parameters. Gay et al. (Reference Gay, Fily, Genthon, Frezzotti, Oerter and Winther2002) investigated measurements of the actual grain size with in situ measurements using three separate methods. The aim was to create reproducible, comparable results and build a database of snow grain size in Antarctica. Their results show the potential for using digital imagery in grain size measurements and act as a reference base for our investigation. During the Finnish Antarctic Research Programme (FINNARP) 1999/2000, 2000/2001 and 2003/2004, Kärkäs et al. (Reference Kärkäs, Granberg, Kanto, Rasmus, Lavoie and Lepparanta2002, Reference Kärkäs, Martma and Sonninen2005) gathered grain size data in transects from the shelf ice at the coast to the polar plateau. Data were gathered with the aim of providing information on snow chemistry, physical properties and stratigraphy. Kärkäs et al. (Reference Kärkäs, Martma and Sonninen2005) found no statistically significant correlations between environmental variables, such as elevation, and snow particle descriptors but identified smaller snow grains and a decreasing number of ice layers with increasing distance from the coast.
Snow grain size and shape affect reflection and scattering at visible to microwave wavelengths, those commonly used in satellite remote sensing (Nolin & Dozier Reference Nolin and Dozier2000, Painter et al. Reference Painter, Rittger, McKenzie, Slaughter, Davis and Dozier2009). In addition, snow grain size is an input parameter in the calculation of albedo and spectral reflectance for remote sensing models and energy balance models (Nolin & Dozier Reference Nolin and Dozier2000, Painter et al. Reference Painter, Rittger, McKenzie, Slaughter, Davis and Dozier2009, Kokhanovsky et al. Reference Kokhanovsky, Rozanov, Aoki, Odermatt, Brockmann, Krüger, Bouvet, Dursh and Hori2011). Moreover, studies have suggested that interactions between deposited snow and summer insolation through metamorphism is the origin of firn layering near the surface, which further determines physical stratigraphy of polar ice sheets (Fujita et al. Reference Fujita, Okuyama, Hori and Hondoh2009). Observations of surface and near-surface snow properties provide knowledge of the initial stage of the firn metamorphism.
A descriptive dataset has been compiled recording the variability in snow particle size at different temporal and spatial scales across a wide, sparsely explored area of DML. A method based on digital photography, the digital snow particle properties (DSPP) method (Ingvander et al. Reference Ingvander, Brown, Jansson, Holmlund, Johansson and Rosqvist2013), was implemented to analyse the statistical characteristics of the spatially dense set of snow particle size samples. The DSPP method allows us to obtain distributions of particle sizes rather than a single estimated average size from the samples. Our data could serve as valuable ground truthing for examining satellite remote sensing and modelling.
Study area and methods
Study area
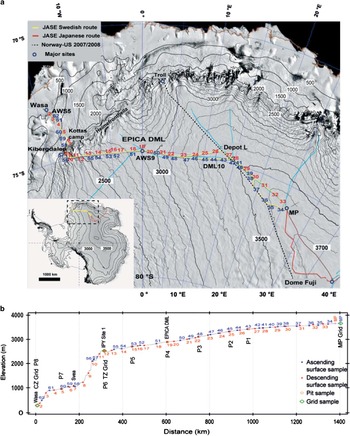
The study sites are located along the Swedish Antarctic Research Programme (SWEDARP) leg of the Japanese–Swedish Expedition (JASE) 2007–08 traverse route in DML (solid blue line in Fig. 1). The Swedish leg of the expedition started at Wasa research station in the coastal zone of DML on 5 December 2007 and proceeded towards the mountain chain, Heimefrontfjella, which separates the coastal zone from the polar plateau. The route accessed the polar plateau through Kilbergdalen rising~800 m over a distance of 16 km (referred to as the transition zone). On the polar plateau, the route followed the 75°S parallel passed the EPICA–DML deep drilling site Kohnen at 75°S, 0°E/W. East of Kohnen, the route followed the ice divide and reached a predefined meeting point (MP) at 76°S, 16°E (3615 m a.s.l.) where plateau sampling was conducted. The MP was where the Swedish and Japanese (yellow and red lines, respectively, in Fig. 1a) traverse teams met. The Swedish team reached MP on 27 December and began the return trip to Wasa on 1 January 2008. The team returned using the same route with two deviations: diverting to Depot L for logistical purposes followed by a direction change at Depot L in order to follow the ice divide more accurately (Fig. 1a). On return the route deviated south of the ice divide for logistical purposes. The return trip to Wasa was completed on 24 January 2008.
The map of the JASE 2007–08 traverse route. The image is a MODIS Antarctic mosaic projected in polar stereographic projection using WGS84, true latitude 71°S showing major ice divides (turquoise solid lines). The yellow, red and dashed lines are routes for the Swedish, Japanese and Norwegian–US surface traverses, respectively. The red numbers are ascending surface sample numbers and the blue are descending. b. The surface elevation profile along the route and the spatial distribution of the different sample sites.

Meteorological conditions
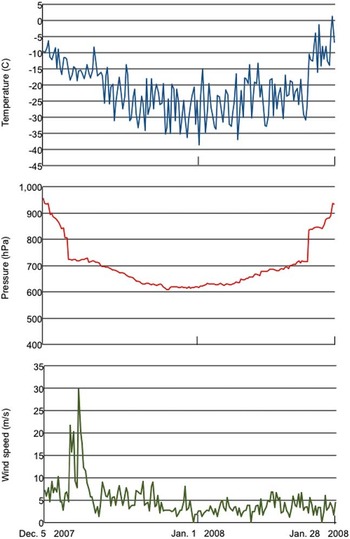
The traverse lasted for two months during the summer. The meteorological conditions varied over the season and with the local conditions of the sample sites. The meteorological conditions at 8 hour intervals during the traverse are presented in Fig. 2. The automatic weather station (AWS) was a portable commercial station (Oregon Scientific systems) that was mounted on the laboratory module of one of the vehicles.
Data from the automatic weather station installed on the traverse vehicle. Pressure, wind speed and temperature were sampled hourly.

Two major blizzards occurred during the expedition. The first, not recorded by the AWS, occurred on 19–26 November 2007 at Wasa Station. The second blizzard, recorded by the AWS on this occasion, occurred on 11–13 December when the traverse team were at site 1 (75.0°S, 10.1°W, 2528 m a.s.l.; Fig. 2). These two severe blizzard events provided the region with freshly deposited snow. Blizzards in DML are discussed by Birnbaum et al. (Reference Birnbaum, Freitag, Brauner, König-Langlo, Schulz, Kipfstuhl, Oerter, Reijmer, Schlosser, Faria, Ries, Loose, Herber, Duda, Powers, Manning and van den Broeke2010), who found that all strong wind events at Kohnen identified during a seven year period were caused by the influence of large scale forcings of a low pressure system. As a result of such cyclonic forcings, strong winds with upslope components occur, directing maritime air masses over DML. Birnbaum et al. (Reference Birnbaum, Freitag, Brauner, König-Langlo, Schulz, Kipfstuhl, Oerter, Reijmer, Schlosser, Faria, Ries, Loose, Herber, Duda, Powers, Manning and van den Broeke2010) suggested that such events occur more frequently in winter and spring than in summer and autumn. From 14 December 2007 until 24 January 2008 no further storm events occurred and most of the snow surface was compacted snow or depth hoar. Later in the season, after 2 January 2008, surface hoar was observed. However,~40% of the snow surface was covered with a very thin layer of fresh snow (0–1.0 cm thick). During the 41 days of the expedition without major storm events, clear-sky precipitation was occasionally observed. However, this precipitation was consumed by sublimation (evaporation) at the surface of the ice sheet. Therefore, we deduce that the snow particles observed after 14 December 2007 were most probably deposited prior to 14 December. We assume that the snow particles experienced metamorphism, redistribution by wind and morphological changes due to summer insolation. The climatology of the traverse route has been established using a transect of AWS (Reijmer & van den Broeke Reference Reijmer and van den Broeke2003, Birnbaum et al. Reference Birnbaum, Freitag, Brauner, König-Langlo, Schulz, Kipfstuhl, Oerter, Reijmer, Schlosser, Faria, Ries, Loose, Herber, Duda, Powers, Manning and van den Broeke2010). Reijmer & van den Broeke (Reference Reijmer and van den Broeke2003) showed that increments of accumulation occur as several discrete steps in a year, suggesting that cyclonic forcings are a major component of snow accumulation. In addition, Fujita & Abe (Reference Fujita and Abe2006) have shown that half of the annual precipitation was accumulated at Dome Fuji by only 11 events without evident seasonality. These studies further support our assumption that the snow at the surface of the ice sheet was most probably deposited by the early season storm events.
Methods
Collection of snow samples during the JASE 2007–08 traverse has enabled the investigation of several aspects of snow particle distribution that are important to the understanding and validation of remotely sensed snow surface data. Our semi-automated method for analysing the snow particle size provides objective size determination and distribution analysis of the extensive dataset. The expedition route from the coast to the polar plateau provides us with the possibility to study spatial differences in particle size. The sampling along essentially the same route twice on the ascending and descending legs provides the opportunity to investigate time-dependent changes in the snow properties. Sixty-two sites were sampled at the snow surface by taking three parallel samples (at the same time with 20 cm separation) at each site (Fig. 1) approximately twice each day of the traverse. Sampling site locations were determined by the logistical stops along the route. The sampling procedure was performed at upwind locations relative to the camp in order to retrieve snow unaffected by the traverse convoy. The surface samples constitute a spatial transect, sampled with a varying time lag between the ascending and descending leg samples (Fig. 1a). Three 3×3 sample site grids were sampled in each of the three topographical regions: the coastal zone, transition zone and polar plateau. These were undertaken to analyse and characterize local variability (Fig. 1b). During the descending leg, ten 1m pits were sampled for particle size with a vertical sampling resolution of 10 cm (Fig. 1b), and density and conductivity with 3 cm resolution (Sugiyama et al. Reference Sugiyama, Enomoto, Fujita, Fukui, Nakazawa, Holmlund and Surdyk2012).
Snow particle size was analysed using the DSPP method (Ingvander et al. Reference Ingvander, Johansson, Jansson and Pettersson2012, Reference Ingvander, Brown, Jansson, Holmlund, Johansson and Rosqvist2013). The method is based on digital camera images (Canon EOS 350D) and object-oriented image analysis (Definiens Developer 7.0 software; Definiens 2008). In the field, a sample is separated from the snow pack and placed on a reference plate marked with a millimetre dot-grid with micrometre accuracy. The snow particles were photographed on the reference plate with the dot-grid providing a geometric reference framework (Ingvander et al. Reference Ingvander, Brown, Jansson, Holmlund, Johansson and Rosqvist2013 figs 2 & 4). For each sample site, three parallel samples were taken to improve statistical reliability. The sample size varied from 20 to 180 snow particles with an average sample size of 92 snow particles. Each sample contained overlapping particles but these were removed from the analysis by delimiting size thresholds for the particles (Ingvander et al. Reference Ingvander, Brown, Jansson, Holmlund, Johansson and Rosqvist2013). The image analysis is based on segmentation and classification by object-oriented image processing. The resolution of the images is calculated based on the number of pixels between markers on the reference glass or by using elevation of the camera. The image is segmented by the software based on shape, compactness and scale parameters (Definiens 2008). The segmentation in the image is sequentially based on the brightness, contrast and the physical shape of the objects. The segmented image is classified by area, brightness and shape index (length to width ratio). The segmentation process generates polygons based on intensity and shape of the objects. The polygons are subsequently classified based on their specific properties into snow particle or not snow. The software and method is thoroughly described in Ingvander et al. (Reference Ingvander, Brown, Jansson, Holmlund, Johansson and Rosqvist2013). In order to extract bright snow particles from a dark background, limiting conditions for the brightness of each object were established, together with limiting conditions for size and shape in order to remove clusters and exclude the bright millimetre markers of the sample glass from being classified as snow particles. The size and shape parameters for the polygons classified as snow particles can be exported as object statistics.
The object statistics for each image were exported and analysed separately. Examples of retrieved basic size parameters from the DSPP method are length (l, longest axis), width (w, shortest axis), area and largest enclosed ellipse major radius. Here length and width have been extracted and analysed for the surface, grid and pit samples. For the grids, a subjective analysis of the snow hardness and type was performed for each sample in order to register local variations in snow type. Relative snow hardness is indicated by a number: 1=soft, 2=medium and 3=hard. The type of snow surface morphology is indicated by a lowercase letter: a=flat, b=ripples, c=sastrugi crest and d=sastrugi valley. Finally, the results were compared with elevation and distance to the coast. The distance from the coast was estimated by subtracting the latitudinal position of the sample location from 72°S latitude, which serves as a reasonable proxy for the location of the DML coastline, and converting the result into distance using the polar radius.
Results
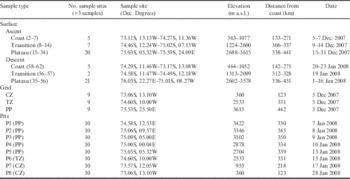
The dataset includes 227 samples of snow particle size images from 62 sample sites, three grids and ten pits. The samples have been grouped by type (surface, grid or pit) and their physical attributes recorded in order to get an overview of the extent of the dataset (Table I). The samples were grouped into sample types based on whether they were ascent (mainly spring) or descent (summer) samples and elevation (Table I). The 62 surface samples were collected over a distance of 1100 km with~50 km spacing and with a temporal difference between ascent and descent of 3–34 days on the polar plateau and 44–52 days in the coastal zone (Table I). The elevation varied between 360 and 3615 m a.s.l. for all samples, and the distance from the coast varied from 122 to 451 km.
Complete dataset including the 227 snow samples from 62 sample sites, three grids and ten pits.

CZ=coastal zone, TZ=transition zone, PP=polar plateau.
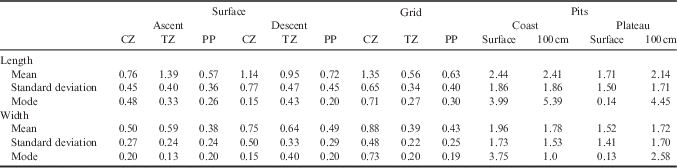
The size and shape parameters for each region and sample type are presented in Table II. Mean particle length was consistently larger for the samples collected on the descent compared to the ascent, with the exception of those from the transition zone where the opposite trend was observed. However, the relevance of the data from the transition zone is questionable because seven samples were collected on the ascent and only two on the descent. The standard deviation increases over time demonstrating wider size ranges. Wider ranges were recorded in the coastal zone than on the polar plateau. The length/width ratio decreases for the descending leg samples. The particles are consistently smaller on the polar plateau than in the coastal zone. The smallest particles (0.56 mm±0.34 mm) with the smallest standard deviation are found in the grid situated on the higher elevation of the transition zone, just south of Heimefrontfjella (Table II). For the snow pits, the particles are consistently larger in the coastal zone than on the polar plateau.
Size parameters (length (mm) and width (mm)) of the different types of snow samples. The surface samples are grouped into ascent and descent samples and divided into three separate regions. The grid values are represented by a mean of all nine grid samples for each site. The pits are separated into two regions and the surface samples represent the samples at 0 and 10 cm, and the 100 cm samples represent those taken at 90 and 100 cm.

CZ=coastal zone, TZ=transition zone, PP=polar plateau.
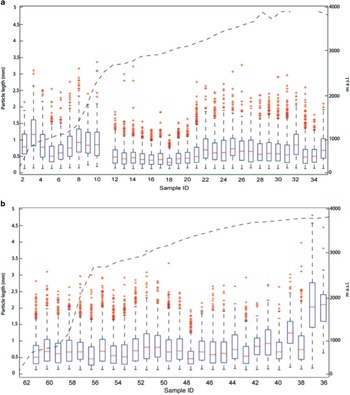
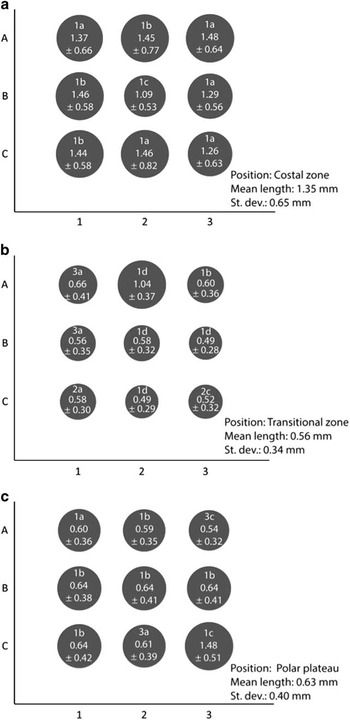
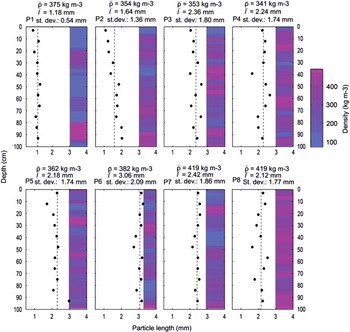
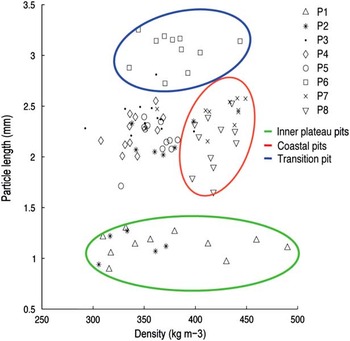
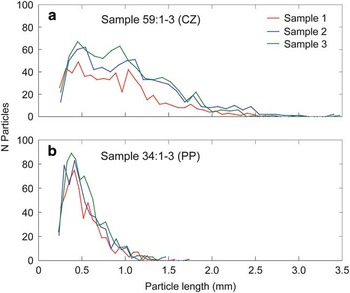
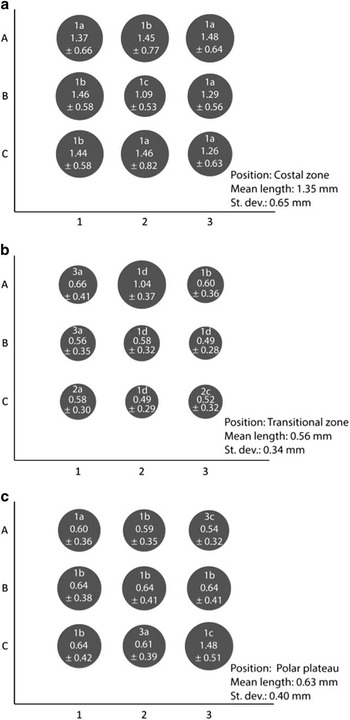
The results from the surface samples are shown in Fig. 3. The ascending samples (Fig. 3a) show a distinct difference in size between the coastal zone and the polar plateau. The transitional zone samples and the first ascending polar plateau samples show a clear difference from the coastal zone and inner polar plateau samples as they are smaller and more homogeneous than the other samples, which could be an effect of the position of the samples in the mountain range or at leeward side of the mountain range facing the plateau. The coastal zone samples collected during the descending leg show a greater variability in size and more outliers in smaller sizes than the coastal zone ascending leg samples. To address the variability along the route, a study of the local variations was performed by sampling a 10×10 m grid with 5 m resolution. One site in each region (coastal zone, transition zone and polar plateau) was investigated (Table I) and the results are presented in Fig. 4. The smallest particles were found in the transitional zone (coastal zone: 1.35 mm, transition zone: 0.56 mm, polar plateau: 0.63 mm). The variability (standard deviation) is largest in the coastal zone (70%), smallest in the transition zone (60%) and slightly larger on the polar plateau (63%). The local variability is affected by the hardness and the type of snow sampled ranging from hard crust to soft wind-accumulated snow. The smallest particles with smallest range are found in the transition zone and polar plateau grids but these grids also contain the highest number of outliers with greater sizes which indicate the presence of clusters. The size evolution over a longer time perspective was investigated by snow pit sampling down to 1 m with 10 cm resolution (Fig. 5). Snow pits in the coastal zone (P7 and P8, Table I and Fig. 5) show an increased particle size range (greater standard deviation) at depth; these pits also have the highest average density. The plateau snow pits are more homogeneous, and show less variability and poor correlation between size and density variations. The small snow particles in P1 and P2 are due to small sample sizes with absence of aggregates and few partial grains. Correlating the density of the snow with particle length showed no trends with depth but again the three different regions (coastal zone, transition zone and polar plateau) were clearly distinguishable (Fig. 6). The size distribution across all of the samples shows a general trend of negative skewness towards smaller particles, and a coarse-end tail of few larger particles that are probably created by aggregated smaller grains or particles. The size distribution of three parallel samples from two individual sample sites, one from the coastal zone and one from the polar plateau, are shown in Fig. 7. The coastal site (Fig. 7a) shows a broad, nearly double peak at 0.5 and 1.0 mm for samples 2 and 3, whereas the polar plateau sample (Fig. 7b) shows a peak size of~0.5 mm with few particles of greater size.
Surface samples of snow particle length and its logarithmic distribution in a. ascent samples and b. descent samples. The route elevation (dashed line) illustrates the distribution variation at different elevations. The red bars indicate the median, and the boxes show the 25th and 75th percentile. The maximum whisker length is±2.7 σ i.e. 99.3th percentile.

Analysis of local variation of mean (± standard deviation) particle length (mm) in grids from the three zones: a. coastal zone, b. transitional zone, and c. polar plateau. The resolution of the grids are 10×10 m and each position of the grid (co-ordinates A–C and 1–3) contains three parallel samples. Snow type is indicated by a number representing the hardness of the sample (1–3) and a letter indicating the type of sample (a=flat, b=ripples, c=sastrugi crest, d=sastrugi valley).
Snow particle size variations in snow pits measured with DSPP method, overlying density profile with 3 cm increments in pink and visually interpreted snow grain size in blue for each pit. The average density in kg m-3 is provided as
 ${\rm \bar {\rrho }}$
for each snow pit and the mean particle size for each pit is marked with the dashed line and provided as
 $\bar{1}$
. P1–P5 are from the polar plateau, P6 from the transition zone and P7–P8 are from the coastal zone.

Correlation matrix between the mean particle length for each 10 cm interval in the 1 m snow pit and the density for the same depth for P1–P7 separately. The samples not included in the coloured areas are pits that are located in between the inner polar plateau and the transition zone.

Snow particle distribution for three parallel samples from a. the coastal zone (sample 59) and b. the polar plateau (sample 34) demonstrating the reproducibility of the collected data.

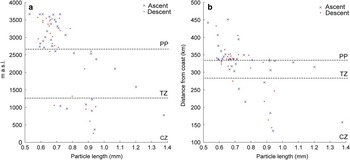
Finally, the correlations between mean particle length of the surface samples and elevation (Fig. 8a) and distance from the coast (Fig. 8b) were investigated. The high elevation samples create a cluster of datapoints at smaller sizes whereas the low elevation samples (coast) are spread over a wider range of sizes. The particle length correlation to distance from the coast provide a cluster of datapoints at the distance of 350 km (the lower part of the polar plateau) and between 0.6 and 0.7 mm. Particle size increases both towards the coast and towards the plateau from this cluster.
Scatter plots showing a. particle length (mm) and elevation (m a.s.l.), and b. particle length (mm) and distance from coast (km) calculated from positions distance to latitude 72°. The different regions (CZ=coastal zone, TZ=transition zone, PP=polar plateau) are separated by dashed lines.

In summary, our results show variability between 0.53 and 1.38 mm (range: 0.85 mm) in the surface samples, depending on the location and timing of sampling. The local variability is 1.09–1.48 mm in the coastal zone, 0.49–1.04 mm in the transition zone, and 0.59–0.77 mm on the polar plateau, as sampled by 10×10 m grids. From the surface to 1 m depth the sizes span up to 0.43 mm, and even within each sample the particle sizes vary from 0.21–3.52 mm in the coastal zone and 0.20–1.49 mm on the polar plateau. This variability shows the complexity in snow particle sampling and that statistical analysis should be used with caution when studying snow particle size. The choice of statistical distribution is important and dependent on the type of snow sampled.
Discussion
Traditional visual methods for analysing snow grain/particle size provide mean sizes for samples (Fierz et al. Reference Fierz, Armstrong, Durand, Etchevers, Greene, Mcclung, Nishimura, Satyawali and Sokratov2009, Ingvander et al. Reference Ingvander, Johansson, Jansson and Pettersson2012) determined by the observer. By using the DSPP method the range of sizes within one sample can be registered. The size distributions shown in Figs 3 & 7 are negatively skewed. This pattern has previously been observed through different methods by, for example, Mellor (Reference Mellor1965) at Byrd Station in West Antarctica, Lesaffre et al. (Reference Lesaffre, Pougatch and Martin1998) in field samples as well as in snow generated from a laboratory snow metamorphism experiment, and Kärkäs et al. (Reference Kärkäs, Martma and Sonninen2005) using samples from DML. Figure 7 focuses on three parallel samples from two individual sample sites, one from the coastal zone and one from the polar plateau. The samples are consistent for each site. Both sample sites have peak sizes just below 0.5 mm (particle length). The coastal zone sample site (59; Fig. 7a) also shows some evidence of a bimodal distribution through a less distinct peak at~1 mm in samples 2 and 3. It is possible that the bimodal pattern is the result of grains forming aggregates increasing the size of the particles incrementally based on the single grain size. If this is true, we may conclude that the snow in the coastal zone is more strongly sintered than the snow on the polar plateau which can be concluded from visual observation of the snow sample images. Higher temperatures present in the coastal zone, strong seasonal variations and higher moisture content in the air may aid such sintering processes (Libbrecht Reference Libbrecht2005). The slowly decreasing tail of the size distribution also implies a wider range of sizes in the coastal zone (Table II) together with outliers from the coastal surface samples from the descent sample sites (Fig. 3b) and the coastal zone grid samples (Fig. 4a). Although we do need to remember that the particle sizes form a distribution so when they become sintered the resulting aggregate will attain a wide variety of final sizes consistent with a long-tailed distribution. The skewed distribution pattern in sizes has previously been identified by Lesaffre et al. (Reference Lesaffre, Pougatch and Martin1998). The polar plateau sample (34; Fig. 7b) shows a distinct peak at~0.4 mm (particle length) and a quickly decaying tail towards larger sizes. This may imply less aggregation among grains in areas of low temperature and low atmospheric moisture content (Libbrecht Reference Libbrecht2005). The snow particles measured at the surface of the ice sheet in this study are dominated by crystal shapes classified as columns, bullet-type crystals or hexagonal plates. Such crystals either formed during a snowdrift situation or remained from the last snowfall. Aged and weathered snow grains or fragments forming firn skeletons are much less abundant on the snow surface due to the constant wind redistribution (Frezzotti et al. Reference Frezzotti, Gandolfi, La Marca and Urbini2002).
The systematic relationship of snow particle size to elevation and distance from the coast is clear. Our results (Table I and Figs 3–6) show consistently larger particle sizes in the coastal zone than on the polar plateau. The effects of elevation and distance from the coast are largely determined by the shape of the ice sheet and the topographical features of DML. There must also be an independent effect of distance similar to what is seen on any continent where distance to moisture source affects precipitation (Ahrens Reference Ahrens1999). Richardson et al. (Reference Richardson, Aarholt, Hamran, Holmlund and Isaksson1997 fig. 9) show how the accumulation rate varies as one traverses from the coast through the Heimefrontfjella up on the polar plateau. Their results show clear effects from elevation changes and distance to the coast. The coastal samples are located at relatively low elevation but in an area with significant elevation change (~300–1100 m a.s.l.; Table I). The coastal regions are exposed to the circumpolar weather systems and receive more precipitation than the plateau as the coast has higher pressure (due to elevation) and higher temperatures and humidity than the polar plateau (King & Turner Reference King and Turner1997), which in turn generates larger snow particles (Libbrecht Reference Libbrecht2005) as shown in Table I and Fig. 3. The polar plateau constitutes a lower gradient rise towards the interior of the ice sheet (Fig. 1), the precipitation is mainly by clear-sky precipitation (e.g. Radok & Lile Reference Radok and Lile1977), refrozen evaporated snow which generates small grains also evident in our data (Table I and Figs 3–6) although occasional significant precipitation events may reach as far south as 75°S (Massom et al. Reference Massom, Pook, Comiso, Adams, Turner, Lachlan-Cope and Gibson2004). The transitional zone samples are few but show smaller sizes than the polar plateau samples and contain outliers toward smaller sizes in the descending leg data (Table II and Figs 3 & 4). These results are not easily explained. The transitional zone is affected by weather systems from the coast rising over the mountain chain generating storms and the area is heavily affected by strong winds (King & Turner Reference King and Turner1997) which have strong shape altering effects and cause sublimation (Albert Reference Albert2002, Kikuchi et al. Reference Kikuchi, Fukushima and Nishimura2005). The wind in these regions redistributes the snow and the transport alters the size and shape of the particles (Sommerfeld & LaChapelle Reference Sommerfeld and LaChapelle1970). This size reduction due to transport skews the size distribution of the particles towards smaller sizes. Thus, it is possible that the small particle sizes in the transition zone come from transport of particles from the polar plateau by the katabatic wind systems (e.g. King & Turner Reference King and Turner1997). Such a hypothesis is supported by AWS measurements performed by Van den Broeke et al. (Reference Van den Broeke, Reijmer, van As, De Wal and Oerlemans2005) who conclude that the wind patterns in the region are dominated by katabatic winds. Opposing the hypothesis include, for example, Richardson et al. (Reference Richardson, Aarholt, Hamran, Holmlund and Isaksson1997) who indicate that the accumulation rates are very high in this zone with larger particles from orographic precipitation effects as coastal air masses are pressed up towards the Heimefronfjella Nunataks. It is, therefore, not clear why the deviations in the transitional zone occur and it is important to remember that the number of samples investigated in this zone was relatively small which makes any conclusions weak. Figure 3 shows that there are systematic variations in particle size that are affected by both elevation and distance to the coast. The smaller particle sizes in the transition zone and in the ascent samples from the polar plateau (Fig. 3a) could be explained by the storms in the area at the time of the traverse. This assumption can be verified by Schlosser et al. (Reference Schlosser, Manning, Powers, Duda, Birnbaum and Fujita2010) who identified cyclic precipitation events in the Kohnen area in DML. These effects add to Kärkäs et al. (Reference Kärkäs, Martma and Sonninen2005) who found a decreasing grain size with elevation and with increasing distance from the coast. However, it is clear that some of the details of the spatial variability in particle size is not easily explained and requires further research. Nevertheless, the local variability can be substantiated by the findings of Scambos et al. (Reference Scambos, Haran, Fahnestock, Painter and Bohlander2007) who identified grain size differences between wind and leeward side of accumulation features on the Antarctic Plateau.
The temporal differences between the ascending and descending legs provide an opportunity to investigate the effects of possible particle size evolution with time. Our results (Table I and Fig. 3) indicate that particle size increased over time in the coastal zone. In addition, the length/width ratio decreased indicating an increase in roundness during the Antarctic summer season. A particularly striking change occurred on the lower polar plateau where grain sizes consistently increased over a very large area from~1500–2500 m a.s.l. The cause of this regional change is not clear but dominant wind patterns indicate that this zone experiences different dominating wind directions compared to both higher and lower elevations (Fujita et al. Reference Fujita, Holmlund, Andersson, Brown, Enomoto, Fujii, Fujita, Fukui, Furukawa, Hansson, Hara, Hoshina, Igarashi, Iizuka, Imura, Ingvander, Karlin, Motoyama, Nakazawa, Oerter, Sjöberg, Sugiyama, Surdyk, Ström, Uemura and Wilhelms2011). The processes affecting particle size are primarily mechanical processes, such as crushing during snow drifting, and metamorphic processes, such as sublimation caused by evaporation, temperature gradients and wind (Sommerfeld & LaChapelle Reference Sommerfeld and LaChapelle1970). Snow drifting and evaporation should decrease grain size, whereas different metamorphic processes may increase particle size. Legagneux et al. (Reference Legagneux, Taillandier and Domine2004) showed that small particles rapidly disappear as large snow particles grow at the expense of smaller particles. Given the time that elapsed between coastal zone sampling during the ascending and descending legs, it is not inconceivable that new snow had accumulated so that measurements also reflect different snowfalls. We do not have any data or observations to refute or verify this. However, the changes are consistent at all elevations which indicates that changes are widely detectable in the surface snow. Our findings of grain size variability and distribution in the different regions can be supported by regional climate variations. Van den Broeke et al. (Reference Van den Broeke, Reijmer, van As, De Wal and Oerlemans2005) identified peaks of net radiation (Rnet) using AWS during the summer (December to January) both at the coast (AWS5, 73°06'S, 13°10'W) and at the plateau (AWS9, 75°00'S, 00°00'W/E). Van den Broeke et al. (Reference Van den Broeke, Reijmer, van As, De Wal and Oerlemans2005) concluded, based on the radiation balance, that sublimation processes are lower at the plateau compared to the coast supporting the differences in grain size in the region. The seasonal pattern discussed in Van den Broeke et al. (Reference Van den Broeke, Reijmer, van As, De Wal and Oerlemans2005) may also explain the difference in grain size between the ascending and descending legs of the traverse (Fig. 3). The data from snow pit samples (Fig. 5) also provide information on the time evolution of particle size since the pit represents a time transgressive chronology of snow accumulation. It is possible to distinguish greater variability and larger sizes in the pit samples from the coastal zone (P7 and P8) where we also find the highest mean densities. The absence of correlation between the manually and digitally analysed particle sizes is due to the differences in sample methodology and vertical resolution of each sample as the digital samples are sampled in 10 cm increments whereas the vertical resolution of the manual estimated sizes are based on the stratigraphy within the snowpack. The range in particle size and its variability with depth compares well with the results by Gay et al. (Reference Gay, Fily, Genthon, Frezzotti, Oerter and Winther2002) despite the differences in image analysis where they analysed the grain size using generic skeleton analysis in order to retrieve single crystal size. Increased particle size with age in a snow pack is to be expected. Thus we see changes in particle size with time in the surface snow but cannot attribute these changes to metamorphic processes alone.
Scambos et al. (Reference Scambos, Haran, Fahnestock, Painter and Bohlander2007) compiled the Mosaic of Antarctica in order to derive a continental snow grain size dataset of Antarctica. This dataset can be validated by the extensive particle size dataset retrieved from DML during the JASE 2007–08 (Fujita et al. Reference Fujita, Holmlund, Andersson, Brown, Enomoto, Fujii, Fujita, Fukui, Furukawa, Hansson, Hara, Hoshina, Igarashi, Iizuka, Imura, Ingvander, Karlin, Motoyama, Nakazawa, Oerter, Sjöberg, Sugiyama, Surdyk, Ström, Uemura and Wilhelms2011), as the goal of this investigation has been to provide a validation dataset for remote sensing purposes. A key question, therefore, concerns the representativeness of analysed surface samples since satellite imagery consists of pixels representing a given area depending on the resolution of the sensor. Figure 4 shows the local variability in the 9×9 m sample site grids which varies between 60% and 70% of the particle length. This in combination with the variability in surface hardness and type emphasizes the complex local variability of the snow surface properties. The range in particle size varies between 0.18 and 3.31 mm depending on the samples type (Table II) which confirms the difficulties in studying snow particle size due to the complex local distribution and range within each sample. On the polar plateau the wind pattern causes redistribution generating complex microtopographical effects, such as dunes and sastrugi (Frezzotti et al. Reference Frezzotti, Gandolfi, La Marca and Urbini2002), which generate accumulation and erosion areas (glazed surfaces) on sub-metre to kilometre scales. This affects the local variability and results in a continuous transformation of the surface properties (texture roughness), which explains the great variability in the grid samples and surface properties (Fig. 4). The variability in surface roughness produced by wind patterns can, on the other hand, generate air surface pumping through the snow pack which alters the sublimation rates (Albert Reference Albert2002) and affects the particle size (Fig. 5). Since microwave remote sensing penetrates the surface, the snow pit samples are important in providing a bulk view of the snow pack (Fig. 5). Our results show no systematic change with depth in either particle length or density. Again there are differences between the coastal zone and the polar plateau which can be explained by the precipitation rate in the regions (Oerter et al. Reference Oerter, Graf, Wilhelms, Minkin and Miller1999). By using the accumulation rates derived by Oerter et al. (Reference Oerter, Graf, Wilhelms, Minkin and Miller1999 table 3) from the waypoints Kottas Camp (coastal zone) and DML10 (polar plateau) our 1 m pits represent~8 years of accumulation on the polar plateau and~3 years of accumulation in the coastal zone. This emphasizes the difference in accumulation between the regions (coastal zone and polar plateau) and the difference in metamorphic processes that have influenced the upper first metre of the snow pack based on turnover rate in the different regions.
Conclusion
There are significant differences in particle size between the coast and the plateau. The transition zone is difficult to classify as it constitutes elevation differences of~800 m and is strongly affected by the topography in the region and the weather systems of the coast as they are pushed along the mountain range. These weather systems have strong effects on the accumulation and winds in the transition zone but not on the polar plateau. The range in snow particle size varies significantly between the geographical regions at local scale due to different surface conditions such as microtopography. The particle size varies locally, with depth and within the samples making measurement difficult and implying complex generic processes. The effect of snow metamorphism over the season and by surface processes can be identified by the increase of particle size and the more spherical shape over time. Our understanding of the local variability would improve by focusing on the variability in microtopography, the hardness of the surface and the variability of these properties both spatially and temporally. Our data indicate that improvements can be made in sampling strategy. Therefore, there is a need to perform co-ordinated field and remote sensing tests to quantify the coupling between ground control and remote sensing data.
Acknowledgements
We gratefully acknowledge the Swedish Polar Research Secretariat for logistic support, as well as the Swedish Research Council, Swedish National Space Board, the Bert Bolin Centre for Climate Research, the Swedish Society for Anthropology and Geography, the Ymer-80 foundation and the Helge Ax:son Johnson Foundation for financial support. We are indebted to all of our colleagues who participated in the field making the study possible. We are also grateful to the reviewers for their valuable comments on the manuscript.
Author contribution
Susanne Ingvander collected, analysed and interpreted the data, produced the figures and wrote the majority of the paper. Peter Jansson interpreted the data and prepared the paper. Ian A. Brown was the founder of the concept of the field sampling method and analysis; he also participated in proofreading the paper. Shuji Fujita, the leader of the Japanese expedition of the JASE 2007–08, wrote the meteorology section and compiled Fig. 1. Shin Sugyama collected and provided the data for Fig. 5. Sylviane Surdyk analysed and provided data for Fig. 1. Hiroyuki Enomoto collected the field data for Fig. 5 and supported interpretation of the snow surface in the field. Margareta Hansson provided data for Fig. 2 and supported the field work. Per Holmlund, leader of the Swedish expedition of the JASE 2007–08, provided proofreading support and discussions in the field.