INTRODUCTION
Most elections are not close contests. Take recent elections in the United States: in 2012, fewer than 20 percent of House seats were won by a margin of less than 10 percentage points, and in the presidential contest the electoral margin was less than ten points in only fifteen states. In environments where elections are not close, campaigns invest less,Footnote 1 voters learn less,Footnote 2 participation may be depressed,Footnote 3 and politicians may become less responsive to voter preferences.Footnote 4 Closeness is an important feature of democratic elections, which is why political scientists have poured so much energy into studying phenomena such as marginal elections,Footnote 5 incumbency advantage,Footnote 6 pivotal voters,Footnote 7 and the representational consequences of competition,Footnote 8 and it is why electoral closeness is the most commonly studied correlate of voter turnout.Footnote 9
However, many of the important consequences of electoral closeness rely on campaign operatives actually knowing when elections are close. Fear of losing a close contest may inspire a candidate or party to expend effort in campaigning,Footnote 10 but only if politicians and their associates can reasonably estimate their electoral chances. Beyond campaign investments, when politicians perceive that elections are close, they may provide better representation to their constituents. Stokes aptly summarizes this view: ‘Electoral competition induce[s] parties, and hence governments, to give voters what they [want], just as economic competition induce[s] firms to produce what consumers [want]’.Footnote 11 But the connection between competition and representation breaks down when elites lack sufficient information to perceive where voters stand.Footnote 12
In the current era of frequent polling, one might expect campaign operatives to have fairly accurate perceptions of electoral competition, but this expectation is not quite right for three reasons. First, many campaigns do not operate in the information-rich environment typical of presidential campaigns in the United States. Most races lack the resources and public interest. Without frequent public polling and media attention, a campaign may be genuinely uncertain of its expected vote share. Second, even in an information-rich electoral environment, campaigns – especially incumbent campaigns – might perceive a close race when all signs point to a rout. Moe calls this politicians’ ‘paranoid obsession with reelection’.Footnote 13 With voters, district boundaries, party politics, and circumstances in flux, politicians and staffers working in safe races may react to these uncertainties by expecting a close contest even when none exists.
Third, whereas fear may motivate some elites to expect the worst, over-confidence in the ability of one’s own side may distort a campaign’s perception in the opposite direction. In spite of the resources and sophistication of Mitt Romney’s presidential campaign, the public learned that even on the night of the election, contrary to nearly every poll, Romney’s campaign staff ‘went into the evening confident we had a good path to victory’, as one senior Romney adviser told CBS News. ‘I don’t think there was one person who saw this coming’, he said.Footnote 14 In their study of the 2012 campaign, Sides and Vavreck relate other similar examples of campaign staffers being unrealistically confident.Footnote 15
Perceptions of closeness are particularly important to understand in an electoral environment in which close races are the exception, not the rule. If through fear in the face of uncertainty, campaigners expect close races even when their races are not close, we may allay concerns about a dearth of marginal elections or seemingly insurmountable incumbency advantages. If campaigners expect closeness even in routs, then they may try harder to engage with voters than if they either accurately assess or even exaggerate their chances of winning. Whether or not outcomes of elections are close, if campaigners believe that they could lose, this can impact the attention elected leaders pay to the voters they represent.
To examine perceptions of closeness, we partnered with NGP-VAN, the company that supplied voter mobilization technologies for the 2012 Obama campaign and most other Democratic campaigns in the United States. We surveyed operatives every day for nearly six months of the campaign season, yielding a database of approximately 3,500 respondents from 200 campaigns. While surveys of political elites are rare to begin with, to our knowledge this is the first large-scale political science survey that was conducted in partnership with, and internal to, a political party. It is also unique in allowing us to access a segment of political operatives who are close to the ground of electioneering activities. In previous studies of political elites, scholars have focused on populations like convention delegates and caucus participants,Footnote 16 highly educated or politically engaged members of the mass public,Footnote 17 and ‘policy demanders’.Footnote 18 These kinds of elites are certainly worthy of study, but they tend to be quite further removed from campaigns.Footnote 19
As we will show, in general, campaign operatives across a range of environments over-estimate their probability of winning. We will explore variation in this over-estimation, but it is worthwhile to consider why this finding may be surprising: these operatives are involved in high-stakes contests and they are often thought of as paranoid single-minded seekers of re-election.Footnote 20 In this pursuit of election, information is key to decisions about strategy and resource allocation. Nevertheless, we show that a large portion of operatives are off-base in their assessments of one of the most fundamental pieces of information to their races.
We investigate individuals employed by political campaigns who are actively involved in electioneering. In down-ballot races, these workers are often important decision makers on the campaign team. In non-presidential campaigns, we directly surveyed over fifty campaign managers or candidates, and many others who were intimately involved in these smaller campaigns. We first focus on these down-ballot races. We then show that the same patterns hold at the Presidential level, where we surveyed thousands of lower-level paid staff and volunteers, which indicates the pervasiveness of the patterns and suggests that these patterns arise from psychological biases.
THEORETICAL MOTIVATION
There is an idea, commonly associated with Downs, that electoral competition can effectively stimulate investment in campaign mobilization and better representation of the median voter.Footnote 21 This idea has long been called into question; a cloud of uncertainty hangs over politicians that prevents them from perceiving exactly where the electorate stands.Footnote 22 Here, we assess campaign operatives’ uncertainty about the nature of electoral competition, but we make the case that this uncertainty stems not only from the difficulty in discerning where voters stand on issues, as others have researched; but that the uncertainty may also stem from more primitive attributes of actors that might make them fear close competition when there is none and, more typically, that might make them expect to win elections, and by wide margins, when that seems very unlikely.
Many previous studies of elite uncertainty have focused strictly on strategic factors. Consider scholarship like Ferejohn and Noll, Geer, Shepsle, and Canes-Wrone and Shotts.Footnote 23 Like us, these scholars ask how political elites behave, given a level of uncertainty about voter preferences. They consider incentives that are primarily strategic and logistical. For example, in Ferejohn and Noll’s model, politicians may not know voters’ preferences on a particular issue, and so they decide whether to invest in a poll through which they can ascertain voters’ opinions. Their decision to gain information or not may be influenced by considerations like the cost of acquiring information and perceptions of their opponents’ position.
The uncertainty that campaign operatives have about electoral competition is not captured entirely by these strategic formulae.Footnote 24 The uncertainty we study in this article is basic and fundamental. It is not an uncertainty about where voters stand on complex questions of policy. We simply ask how accurately operatives perceive the closeness of their next election. Under a purely strategic model, this is a question that operatives should be able to answer quite easily, assuming they can afford the investment in information. But there are a number of forces that make these assessments more complicated than simply acquiring objective indicators of competition. For example, psychological biases, such as risk aversion,Footnote 25 consensus bias,Footnote 26 and numeracy bias,Footnote 27 as well as the quality of the information environment, are likely to influence how political elites assess their chances.
In the 1970s, Mann engaged with the question of why candidates feel ‘unsafe at any margin’, and pointed to the decline in party attachments of that era.Footnote 28 Mann’s argument was that incumbent congressmen felt more personally responsible for their vote share in the 1970s than in earlier periods in which congressional vote was better predicted by party. Our study, based on 2012 data, takes place in a time period of strong and distinct parties. And yet, we see campaign operatives misjudging their vote share. We think that a particular set of psychological and environmental factors are at play.
Influences on Campaign Perceptions of Closeness
Campaign operatives’ perceptions of electoral closeness are likely to be affected both by contextual and individual-level psychological mechanisms. We assess two key contextual hypotheses. First, we expect to see a difference between campaign workers and candidates associated with incumbent campaigns and those associated with challenger or open-seat campaigns. We link the observation by many political scientists that incumbents strongly fear losingFootnote 29 to findings in psychology and behavioral economics demonstrating that people think differently about potential losses than about potential gainsFootnote 30 and that fear leads to pessimistic assessments.Footnote 31 Along with this pessimism, we also expect incumbents, on average, to be more accurate than challengers. Incumbents and their associates have more to lose than challengers, since their jobs are on the line. Furthermore, the uncompetitive nature of many races means that many challengers are low-quality challengersFootnote 32 and may not have the competences or resources to have the same information about their district or the election as incumbents. Altogether, we expect incumbents to be better assessors of the likely outcome than challengers.
A second contextual hypothesis relates to the information environment of the race, which is primarily a function of the type of election at stake and where the election is conducted. Because presidential elections are so thoroughly inundated with polls, we take it as uncontroversial that presidential campaign operatives ought to have a clearer understanding of the closeness of their election than campaign operatives in ‘down-ballot’ races should have about their contests. Similarly, congressional campaigners ought to perceive their competition better than state house campaigners. Notably in down-ballot races, media attention and the availability of polls is often a function of whether an election is in a presidential battleground state. In general, any elections that are perceived as either particularly important or particularly close will be given more attention by the media, and so campaign elites should have more accurate assessments of closeness in these kinds of contests.
As important as contextual considerations are the individual-level dispositions of elite campaigners. First, we expect a floor effect on campaign operatives’ expectations. Invested as they are in their efforts, workers may exercise motivated cognition that makes them unwilling to accept defeat. The worst outcome they may expect is a 50/50 contest. Thus, while a campaigner that expects to win may predict a wide range of outcomes, a losing campaign might insist, until the end, that the race’s worst-case-scenario is a near tie.
Second, we expect that campaign operatives of different backgrounds will be differentially equipped to predict electoral closeness. In the down-ballot races we study, where resources are often limited and staffers are few, variation across individuals is potentially important. Volunteer-activists and professional staffers may see elections in different lights. While both may be motivated by an ideological commitment to their candidate, professional staffers are more likely to have a financial or career stake in the electoral contest. We expect that their experience in politics and financial interest make them more accurate assessors of outcomes. Professional staffers may also have access to private information about the state of the campaign to which volunteers are not privy. As a corollary to this hypothesis, we also expect that campaign workers who claim to be ideologically extreme (e.g. Democratic staffers who report they are very liberal on an ideology measure) ought to be less accurate in their assessments, as they might be less inclined to admit defeat. This is because ideologues may experience more dissonance or distress if their candidate loses and thus may be unable to assess their standing accurately.
Third, we expect the operatives’ level of sophistication to affect their perceptions. Campaign operatives vary substantially in their educational backgrounds. This could matter because predicting an outcome in an election requires considerable sophistication. Moreover, the simple act of offering a number (like the expected vote share in a race) requires a degree of numeracy that might be more common among well-educated workers than poorly-educated ones. Thus, we expect that campaign operatives who are more sophisticated, proxied by their educational attainment, are better at assessing their chances.
At the end of the article, we will explore the implications of the findings of our analysis. But here, it is worthwhile to emphasize that these hypotheses offer insights about the kinds of offices and kinds of political operatives who understand when elections are meaningfully contested. Knowing what types of operatives are good at predicting outcomes helps us understand the circumstances in which political campaigns operating in a world of landslide elections will behave as if the stakes are high.
DATA
The primary data source for our study is the Ground Campaign Project, a survey that we conducted in conjunction with NGP-VAN, Obama for America, and twenty-five state Democratic parties. The inspiration for the project came from our realization that nearly all Democratic campaigns in the United States use the same web-based user interface to engage with voters in mobilization activities. The presidential race, as well as all races in all states but California can access their voter files through NGP-VAN. This new centralization of data management on the Democratic side of politics provides a platform for systematic and broad research access to workers on these campaigns. This dataset has been described in detail in Enos and Hersh and in Hersh.Footnote 33
Details about the sampling strategy are reviewed in the supporting material. For the Obama campaign, we solicited workers from 11 June 2012 through election day. For down-ballot races, which we surveyed in twenty-five states, we solicited respondents from 22 August through election day.
The main survey item assessed in this article uses a sliding scale that allows respondents to estimate how much of the vote share their candidate will receive in the election. The text of the down-ballot question, which preceded the sliding scale is this:
Thinking about the candidate whose campaign you are currently working on, how well do you think the candidate will do in the general election? Use your mouse and the sliding scale below to answer this question. For example, moving the scale to 100 means that you think your candidate will win 100% of the vote. Moving it to 0 means that you think your candidate will win 0% of the vote. The middle of the scale means that your candidate will win 50% of the vote.
On the presidential level, the question asked respondents about Obama’s vote share in the state in which they were campaigning. To benchmark our survey of elites against a comparison group, we also asked the presidential closeness question on 1,000-person modules of the Cooperative Congressional Election Study (CCES) and the Cooperative Campaign Analysis Project (CCAP).
Not every campaign operative has an account and log-in permissions in NGP-VAN, and thus our sampling universe includes only workers in particular roles. On the staff side, staffers associated with direct, strategic voter contact use NGP-VAN most regularly. It is important to realize that no contact list exists from which one could draw a truly representative sample of all campaign workers. The database of log-in information to NGP-VAN might be the closest thing to such a list.
The Supporting Information shows summary statistics for the sample. As a rule, the lower the level of the race, the higher the level of the typical staffer within that campaign that is interviewed, which is why we begin by focusing on down-ballot races. In down-ballot campaigns, it was common for campaign managers and even candidates themselves to log-on to NGP-VAN and take our survey. On the presidential level, our sample of staffers is dominated by field organizers and deputy field organizers. Because the group of operatives taking our survey ranges from volunteers to candidates, we pay particular attention to assessing the results by key sub-populations within the sample.
Our study only includes Democratic organizations. Of course, ideally, we would have included both Democrats and Republicans. However, we did not attempt to partner with Republican campaigns because it might have compromised the research partnership that enabled us to observe and collect sensitive campaign data in the midst of an election cycle.
Our exclusive attention to the Democratic side raises the question about whether our findings would have been different if we had studied the Republicans instead. Republican campaigners’ expectations of closeness could be different. First, the demographic characteristics of the activists and operatives who run campaigns differ on Democratic and Republican sides. Second, the contextual characteristics of the races, such as incumbency and competitiveness, are different on the Democratic and Republican sides in 2012.
On both these points, our intuition is that our findings from Democrats would be likely to apply to Republicans. While individual-level characteristics differ between operatives on the two sides, campaigns on both sides are populated by hyper-partisans, and partisanship, we think, is the main driver of inaccurate predictions. As we show in the Conclusion to this article, when we compare the predictions of workers with ideologically extreme members of the mass public, we think the motivated reasoning of partisans is likely to affect the predictions of workers on both sides. We are also about to show that incumbent campaigns and competitive campaigns have the most accurate predictions. We thus might hypothesize that the incumbent Obama campaign was more clear-eyed than the challenger campaign. However, below the presidential level, we have data on a wide range of challenger and open-seat campaigns, some of which won in an overall positive year for the Democrats, but many of which lost. This variation in the data helps us assess campaigns that, unlike the presidential campaign, were not engaged in a competitive incumbent race. Having stated these points, it is worth reiterating that questions of external validity remain. Future research on Republican campaign workers and in different election cycles would help us to determine whether the biased predictions we observed among Democrats in 2012 can be found more widely.
ANALYSIS
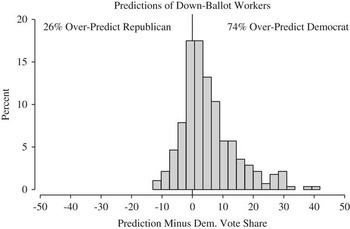
Our analysis begins with down-ballot races, where campaign budgets are small and thus where our respondents tend to be closer to strategic actors. In many down-ballot races, campaigns operate in the absence of much polling information, which means their perceptions of closeness may be particularly important. Figure 1 is a summary of the accuracy of assessments of down-ballot operatives. In this plot, positive values indicate respondents who thought their campaign would garner more vote share than it did. Negative values indicate respondents who thought the opposite. A value of zero means the prediction matched the eventual outcome in the race.
Summary histogram: campaign operatives are over-optimistic, but generally accurate predictors Note: N=280. Vertical line at x=0 indicates perfect prediction.

We note two features of this distribution. First, the histogram shows that campaign workers tend to exaggerate the outcome in favor of their candidate. Campaign operatives were three times more likely to indicate that their side would do better than the actual outcome rather than worse than the actual outcome, with many making extreme over-predictions and only a few badly under-predicting.
Second, despite the tendency to favor their candidate, campaign workers were fairly accurate in their assessments. The distributions are centered around zero, and the modal respondent predicted the outcome accurately. We can measure accuracy by calculating the absolute value of the deviation between a respondent’s estimate of the election outcome and the actual election outcome. In this measure, we disregard whether the respondent over-predicted or under-predicted and focus just on the closeness of the prediction. The mean deviation among operatives is 7.41 (95 percent CI: 6.51–8.31). Campaign workers were, on average, twice as accurate as members of the mass public we interviewed, which we explore below. Whether this accuracy is consistent across sub-groups of operatives in different contexts is the question to which we now turn.
Predicting Closeness by Electoral Environment
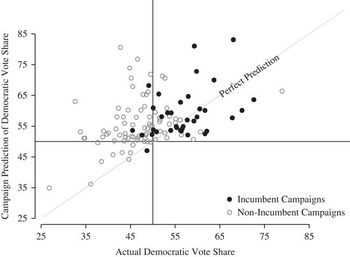
We first approach the contextual hypotheses about the kinds of workers who will be better or worse at predicting accuracy. Here, we focus on basic two-variable and three-variable analyses; later in the article, we will engage in model-based multivariate analysis. We first turn to Figure 2, which shows the down-ballot races in the sample with an eye toward the effect of incumbency. The x-axis measures the average prediction of the Democratic vote share for each campaign. The y-axis measures the actual Democratic vote share in the race. Here, we collapse multiple respondents by race in order to derive an average prediction for the entire campaign. For the modal down-ballot race, we interviewed just one or two respondents during the campaign cycle. There are a few outliers – closely contested Federal Senate and House races – in which we interviewed a relatively large number of respondents in the race. The graph uses different symbols for campaigns associated with incumbent politicians and those associated with non-incumbent politicians. The graph also displays several reference lines. The plot is divided into four quadrants representing predicted victory (NW and NE) versus predicted loss (SW and SE) and actual victory (NE and SE) versus actual loss (NW and SW). The 45° line represents perfect predictions. Dots above that line indicate optimistic predictions and dots below the line indicate pessimistic predictions.
Incumbent campaigns are more pessimistic predictors Note: Each point represents the mean value of all respondents associated with a particular candidate’s campaign. The name of each campaign cannot be revealed. The plot incorporates eighty-nine non-incumbent campaigns and thirty-eight incumbent campaigns. Among incumbent campaigns, 50 percent over-predict their vote share; among non-incumbent campaigns, 93 percent over-predict their vote share.

Compared to non-incumbents, incumbent campaign operatives are both better at predicting their outcome (i.e. there is a better linear fit between predictions and outcomes) and less likely to overstate their likely vote share. Non-incumbents nearly always overestimate their vote share. Notice, incumbency is correlated with winning, but the propensity to under-predict election outcomes is particular to incumbents who win. If we focus on just the actual winners (points in the NE quadrant), 55 percent of incumbents predict a closer election than the final outcome demonstrates whereas only 25 percent of non-incumbents predict a closer election than the final outcome demonstrates (difference of means two-tailed t-test significant with p-value of 0.04). This result is consistent with the notion, put forth by Fenno, that incumbent legislators operate in a state of fear of being in a close election even when they are not. It is also consistent with the expectation from psychology research that risk aversion is associated with pessimism.Footnote 34
Figure 2 is also informative in two other ways. First, notice the stark absence of data points in the southeastern quadrant. There is not a single campaign in our dataset in which an eventual winner expected to lose. In contrast, the northwestern quadrant is populated by the plurality of campaigns that thought they would win but ended up losing. Second, notice evidence of a ‘floor effect’. No matter their eventual outcome, most of the campaigns that ended up losing expected a 50/50 race. There is a concentration of campaigns along the 50 percent horizontal line. The data are consistent with the idea that campaign workers have a hard time admitting they will lose (i.e. motivated cognition). If signs point to a loss, they might hold out hope, as the Romney campaign apparently did, that they could win in a ‘squeaker’.
We now compare the accuracy of predictions across congressional races (both House and Senate) and state races. The state races consist primarily of races for state legislature. Our attention to the differences in accuracy across different offices stems from our hypotheses about the election environment. Namely, races are generally given more attention as they involve higher ranks of elected office. As a result, we suspect congressional staffers to have much more information they can bring to bear on their estimate of the likely outcome, perhaps leading to a more accurate assessment of the race. Higher offices are also more coveted, possibly leading to operatives devoting more resources to understanding the state of the campaign. This too can lead to more accurate assessments among operatives for higher level campaigns.
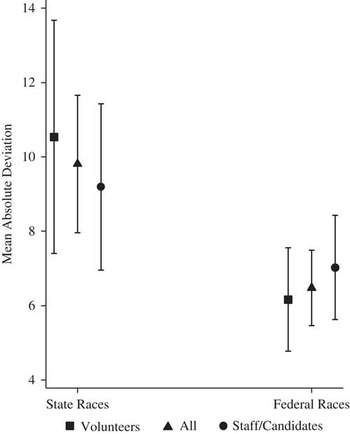
Figure 3 shows the absolute deviation between a respondent’s prediction and the eventual outcome for Federal House and Senate and for state races. Campaign workers in federal races are almost 4 percentage points more accurate than workers in state races, a statistically significant difference. We further subdivide this grouping of races into volunteers and professional staffers. In down-ballot races, there is not a significant difference between the perceptions of volunteers and the perceptions of staffers. In fact, even high-level staffers and candidates in down-ballot races are not that much better than down-ballot volunteers at predicting vote share. The highest level staffers (i.e. campaign managers) and candidates are actually slightly worse at predicting the outcome than lower-level staffers, but they are slightly better than the volunteers.Footnote 35
Workers for higher offices are generally better predictors Note: 95 percent confidence intervals are displayed. The y-axis plots the average absolute deviation between a worker’s prediction of the campaign’s expected vote share and the actual vote share in the election.

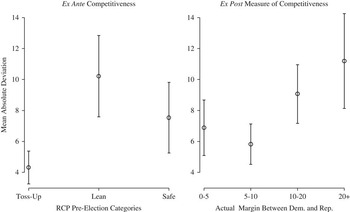
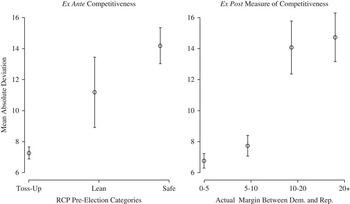
A second take on the information environment requires that we look at races that were perceived as toss-up races in comparison to those that were perceived as safe. We expect campaigns operating in races treated as toss-ups to be better informed about the likely outcome than campaigns operating without much informational feedback. Figure 4 shows this hypothesis generally holds. In Figure 4, we show two measures of competitiveness. The first is a pre-election division of races into those that are toss-ups, those that are leaning toward one party, and those that are safe.Footnote 36 The second measure of competitiveness is simply the actual election outcome in the state or race. As Fraga and Hersh note, using the election outcome to study competitiveness is quite common in political science research and has some advantages over ex ante measures of competitiveness.Footnote 37
Predictions are more accurate in competitive races Note: 95 percent confidence intervals are displayed. Pre-election definitions of toss-up, lean and safe races were taken from http://www.realclearpolitics.com. Only federal races are measured in the left graph (due to data availability of pre-election media estimates of closeness). All races are included in the right graph.

Using the ex post competitiveness measure, as expected, campaign operatives were better at assessing the outcome in races that were closer. In the left graph, the toss-up down-ballot races exhibit the best predictions, but workers in lean races were not more accurate than workers in safe races. Unlike the right plot, the left plot only includes federal races. Among these, the safest are often races associated with incumbent legislators and, as we saw in Figure 2, campaign operatives in these races perceive their election more accurately than operatives in other kinds of races.
So far, we have shown that, consistent with our expectations, incumbent campaigns are both more accurate and more pessimistic at predicting their election outcome than open-race or challenger campaigns. We have also shown that races that are competitive and for higher offices are generally associated with better predictions. With these findings in mind, we now turn to a similar examination of operatives from the presidential campaign. While these workers are obviously less directly responsible for making campaign decisions as those from down-ballot races, an analysis of Obama workers can help us to understand the underlying mechanisms for accuracy: most of these workers operate in a high-information environment, where both the media and the campaign have invested substantial resources in understanding the state of competition. However, as we will demonstrate, these workers still show remarkably similar biases to those observed among down-ballot races, indicating that information effects are only part of story.
Accuracy of Predictions in the Obama Campaign
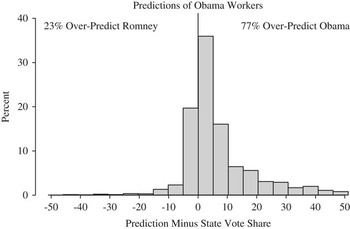
In Figure 5, we display the responses of Obama workers as we did for down-ballot workers in Figure 1. Recall that for the Obama campaign, respondents were asked about the state in which they were working, not the national race. Obama workers demonstrate a similar pattern to down-ballot workers, with a tendency to over-predict their candidate’s chances. The mean assessment among Obama workers was 8.45 points off the actual outcome in their state (95 percent CI 8.05–8.86), so Obama workers were on average actually slightly worse predictors than down-ballot campaign operatives, despite operating in a high-information environment.
Summary histogram: Obama workers are over-optimistic, but generally accurate predictors Note: N=2,583. Vertical line at x=0 indicates perfect prediction.

In Figure 6, we show how the predictions of Obama workers are also a function of context. Their responses are related to competitiveness in the expected manner, with competitive states having the most accurate operatives.
Predictions are more accurate in competitive races Note: 95 per cent Confidence Intervals are displayed. Pre-election definitions of toss-up, lean and safe states were taken from http://www.realclearpolitics.com.

Accuracy of Predictions among the Mass Pubic
Is the optimism we witness a characteristic particular to campaign workers or is optimism a feature of partisans in general? To investigate this, we replicated our closeness question on mass surveys, asking respondents in the 2012 CCES and CCAP how close the presidential race would be in their state.
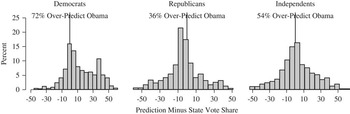
We display the responses of CCAP and CCESS respondents, by party, in Figure 7. Members of the mass public over-predicted their candidate’s probability of victory, and they were less accurate than the workers. Democrats in the mass public over-predicted Obama’s vote share (mean deviation 18.74, 95 percent CI 17.56–19.92), and the Republicans in the mass public thought their side would do better than it ended up doing (mean deviation 15.19, 95 percent CI 14.01–16.37). Independent voters, who could probably evaluate the expected outcome without their judgement being clouded by partisan loyalties, ended up over-predicting and under-predicting the Democratic vote share about evenly (mean deviation 16.41, 95 percent CI 15.31–17.51). Thus, campaign operatives are much more accurate than members of the mass public, but partisans both among the mass public and among campaign operatives seem to over-predict their chances. This suggests that one reason for the over-prediction among campaign operatives is simply partisan-motivated reasoning. In the supporting material (Figure A.3), we replicate Figure 7 while restricting the sample to highly-educated respondents who are either very liberal Democrats, very conservative Republicans, or moderate independents. Except for the moderate independents, who have balanced predictions, high-information partisans over-predict candidates’ vote share in a manner similar to campaign operatives, demonstrating the powerful effect of partisanship in motivating responses.
Partisans in the mass public are over-optimistic predictors and less accurate than campaign operatives Note: Data come from a combined sample of two 1,000 person modules of the 2012 CCES and 2012 CCAP. Observation counts for this survey item are 702 Democrats, 476 Republicans, and 631 Independents. Vertical line at x=0 indicates perfect prediction.

Individual-Level Correlates of Accuracy
Turning to individual-level correlates of campaign operatives’ predictions, we focus on their educational background, ideological extremity, and professional status. We have hypothesized that hyper-ideologues ought to be less accurate than moderately ideological workers, as their judgement may be clouded by their political commitments. We have also hypothesized that better educated workers and paid staffers will have more resources and incentives, both cognitive and informational, to gauge the closeness of their contest. As we assess these individual mechanisms, we also engage with larger statistical models that account for the timing of the interview during the campaign season as well as traits of workers’ races, such as the factors of incumbency, closeness, and level of race.
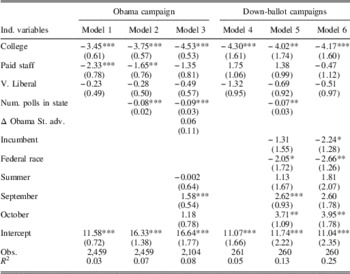
In Table 1, we separate Obama campaign workers from down-ballot campaign workers, and we show three models for each group. The variable college is an indicator variable in which those with a college degree or who appear to be in college have a value of 1.Footnote 38 Paid staff is an indicator representing staff as well as candidates. V. liberal is an indicator distinguishing respondents who consider themselves very liberal from those who chose other options on a seven-point ideology scale (nearly all respondents claimed to be moderately liberal, liberal or very liberal). The Num. of polls in state is a variable representing the total number of presidential polls taken in the state over the course of the fall campaign. The variable relates directly to polling information to which campaign workers have access through the mass media and is thus a representation of the information environment.Footnote 39
Which Campaign Workers Accurately Predict Election Outcomes?

Note: Dependent variable is |prediction – outcome|. Standard errors are in parentheses. ***p<0.01, **p<0.05, *p<0.1. Models 1–3 employ robust clustered standard errors, where the state of Obama workers is the clustering variable. Models 4–5 cluster standard errors around the specific down-ballot campaign of the worker. For an alternative specification, Model 6 employs state fixed effects instead of clustered standard errors. The number of presidential polls in the state is collinear with the set of state indicators in Model 6.
The next variable listed in Table 1 represents the weekly change in Obama’s advantage in each state based on state-specific polls. For example, if Obama held 55 percent of the two-party support in a state poll in the first week of October, but 50 percent of the two-party support in the second week of October, then respondents filling out the survey in the second week of October would have a value of −5 on this variable. For down-ballot races, incumbent equals 1 if the respondent is working for a campaign of an incumbent Democrat, and federal race distinguishes races for US Senate and US House from state races. Finally, we include indicator variables for interviews taking place before September, in September, and in October. November interviews are the omitted category.
To aid in the interpretation of Table 1, consider Model 4. According to Model 4, down-ballot campaign workers who were non-college educated and volunteers were, on average, 11.07 points off in their estimate of the expected outcome, as represented by the intercept coefficient. Notice, because smaller deviations between the respondent’s estimate and the outcome represent more accurate responses, negative values in the independent variables indicate higher levels of accuracy. The coefficients on College and Paid Staff indicate that college educated workers were 4.3 points more accurate and paid staff were 1.8 points less accurate.
Across all models in Table 1, education bears a strong relationship to accuracy. The coefficient suggests that well-educated workers are more accurate at assessing electoral closeness.Footnote 40 For Obama workers, there is also a consistent effect of being a paid staffer. However, similar to the discussion of volunteers in Figure 3, paid staffers are not better assessors of closeness on down-ballot campaigns relative to volunteers. Table 1 also shows no effect of being very liberal on accuracy. Contrary to our expectation that ideologically extreme respondents would be unable to observe the state of the race clearly, ideology bears no relationship to accurate assessments when other variables are included in the model. Despite ideology seeming to have some effect on responses in the mass public, within campaign operatives, very liberal respondents are no less accurate than others.
In Models 2 and 3, we add a measure of the information environment. The table shows that the more presidential polls conducted in the state, the more accurate are the respondents’ assessments. This variable is also correlated with more accurate predictions in down-ballot races, as shown in Model 5. The variable is absent from Model 6 because Model 6 incorporates state fixed-effects, which are collectively collinear with this variable. Notice that measuring the change in Obama’s state advantage does not significantly alter the coefficients for the individual-level variables, indicating that campaign workers are doing more than just reporting signals in their perceptions of closeness; rather they are also likely drawing on private information and responding to their own psychological motivations. Regarding Models 5 and 6, notice that perceptions are more accurate among operatives on federal races versus state races and elites working for incumbent campaigns versus non-incumbent campaigns. This is consistent with the bivariate analysis above.
It is worth lingering on measures of temporal change. After all, the GCP sample was collected over a period of months ahead of the election. But time, it turns out, is not a strong predictor of accuracy. The way that time is incorporated into Table 1 is through dummy variables for month of interview. Perceptions of closeness were more accurate in the first week of November than at any other time, particularly than in October. But perceptions of closeness were about as accurate in November as in the summer. Other specifications of time indicate similar minimal effects. In Figure A.1 in the supporting material, we show the time trend by itself, for Obama workers and down-ballot workers. There is essentially no movement in the prediction accuracy for Obama workers and a curvilinear movement for down-ballot workers, with better predictions in late August and November, consistent with the coefficients in Table 1. Additionally, we have modeled time in several different ways, including measuring workers’ predictions by weekly changes in Obama’s national poll standing, and by incorporating linear time trends into the models in Table 1. We have also tried restricting the sample just to paid staff. Even among paid staff, there is no relationship between time of interview and accuracy. No matter how we slice it, perceptions of accuracy seem to be driven more by individual-level and race-level measures than by the time of interview. This again indicates that rather than simply relying on public signals of closeness, which should be more accurate as the campaign progresses, campaign operatives are largely influenced by their own information and biases.
DISCUSSION
In an analysis of campaign operatives interviewed during the 2012 election season, we have learned that perceptions of electoral closeness are a function of attributes of the information environment, the type of race, and type of worker. We have also learned that predictions are more accurate among workers who are better educated, workers who are associated with higher offices, incumbent re-elections, and close contests, and workers who are paid staffers on the presidential campaign.
Our evidence suggests that operatives are uncertain about the nature of their contests not because it is too costly for them to invest in information, but because objective signals of competition are insufficient to motivate campaigners to always see the nature of their competition clearly. Our focus on demographic and contextual traits leads us to assess campaign strategic behavior in a new light. For example, political operatives are not motivated to participate in politics because they have a strict sense of pivotality. Contrary to a strategic model in which political operatives engage in activities when they can make a difference to the outcome, we see that many operatives engage in races they think they will lose badly or, more often, will win handily. They report this even when they are working sixty hours a week on campaigns. Just as pivotality seems to matter little to voter participation,Footnote 41 our evidence suggests that it matters little to elite participation as well.
The non-strategic factors that contribute to the misperception of electoral closeness can also help us understand elite misperceptions of voters’ policy preferences. For example, why might legislators fail to assess constituent opinion on important matters of policy when it should not be particularly difficult for them to find out where voters stand? Our perspective may provide an answer to this puzzle. The decision to invest in information about constituent opinion may result from a perception of competition. Why bother knowing where voters stand on any one issue if the race is not close? The perception of competition may, in turn, depend on attributes like elite sophistication and the information environment. If elites are not even able to discern when their election is close, they may not know when it is useful to gauge opinion on issues.
At a normative level, there are two ways to interpret the evidence. In one interpretation, citizens should not want campaigners to assess their chances accurately; rather they should want them always to think their contest is close – even when it is not – and thus engage with the electorate. This means we want winners to be pessimistic and losers to be optimistic about their chances. From this perspective, the results are encouraging. Losing campaigners nearly always think they have a chance of winning. Campaigners facing uphill electoral battles seem to make themselves believe they have a chance of winning, and this is probably a good thing if it helps losing candidates exert effort. Similarly, many winning campaigners, especially those supporting incumbent legislators, perceive the race to be more competitive than is evidenced by the end result of the election. This implies that incumbents do not always take their election for granted; they worry about losing and may exert effort as a result. This also demonstrates that despite the potential for frequent polling to allow accurate assessments of where they stand, incumbents are nevertheless often unable to overcome the tendency to be pessimistic about their chances.
A second way to interpret the results is that electorates are better served by politicians who assess their chances accurately than by politicians who always expect a close contest. There are at least two rationales for an imperative like this. First, the upside of the incumbency advantage is that legislators may actually have time to legislate rather than to campaign; if there is little chance that an election is close, the public might be better served by politicians who are not obsessed with their next election. A second rationale is that there is a general premium on politicians’ accurately gauging how well they are doing.Footnote 42 For political elites to be responsive to popular sentiment, they need some basic awareness of where they stand with the public. From the perspective of valuing accuracy, the evidence is mixed. Compared to the mass public, campaign workers are twice as accurate at assessing competitiveness. At the same time, workers are still not very good at it. According to models estimated in Table 1, the prediction made by even a college-educated professional campaign staffer is, on average, about ten points off of the final outcome.
No matter the interpretation, we expect more accurate (and generally more fearful) perceptions of closeness in higher offices than lower offices, in incumbent campaigns rather than non-incumbent campaigns, and among better educated workers rather than less educated workers. If perceptions of closeness can be tied to campaign effort or to policy responsiveness of candidates, we can thus expect different kinds of effects depending on both the electoral environment and on the composition of the campaign team that a candidate puts together. For example, a strategic candidate may make good or poor judgements about when to invest in campaigning or when to gauge voter opinion on an issue depending on the type of race she is in and the type of campaign team she assembles.
The normative implication of our finding depends, in part, on the relationship between perceived closeness and actual decisions made by campaigners about policy positions and campaign investments. While proving a connection between perceptions and strategic choices is beyond the scope of this article, there are reasons to believe this connection is present: our survey is unique among political science surveys in directly interviewing campaign workers, some of whom are important decision makers on political teams, through an instrument that was disclosed internally to party operatives. In the down-ballot races in particular, these people were often close to a campaigner’s decision making, and thus we have reason to take respondents seriously and to assume that their opinions bear on actions of campaign strategists.
Broadly, the results of our study indicate yet another obstacle for the already complicated elite–voter relationship. Political scientists have long known that politicians have difficulty interpreting where voters stand. In the past, the most salient obstacle was information acquisition, an obstacle that was largely logistical; it was plainly difficult and expensive to monitor voter opinion with any precision. Certainly, modern technology has mitigated the costs of acquiring information, but this still does not mean that politicians can size up their voters as well as might be expected if technology was all that shaped their perceptions. Campaigners face other obstacles too. These obstacles are less logistical than that they are tied to basic biases that affect human judgement when people are asked to form predictions. Operatives have trouble assessing where voters stand not only because they lack resources to invest in information or because they lack motivation to do so, but because it is often hard for people, even strategic political actors, to form accurate predictions. In future studies of elite responsiveness, we must continue to engage with models that account for the uncertainty elites have about voters stemming not from a lack of resources or technology, but also from an inability to overcome pervasive perceptual biases.
To be sure, this article leaves many questions unanswered. Using new technologies that allow us to survey hard-to-reach political operatives in a novel way, we have aimed to capture and describe perceptions of closeness. We focus on perceptions of closeness because a robust literature has theorized that elite perceptions of closeness are important for understanding how politicians behave in office and on the campaign trail. Our contribution here is in providing the most comprehensive empirical assessment of elite perceptions of closeness to date. Our contribution here is not in digging deep into causal mechanisms that precede elite perceptions nor in examining downstream effects, such as by tracing how a candidate or campaign manager behaves on the campaign trail or in office when possessing an apparently false perception of electoral closeness. Rather, our focus is on providing an account of the empirical contours of the perceptions themselves. This is a necessary first step in this research agenda. Future research will be needed to fully flesh out the psychological roots and downstream effects of perceptions held by an important but under-studied cohort in any democracy – the campaign elites who dedicate themselves to electoral victory.
Supplementary Material
To view supplementary material for this article, please visit http://dx.doi.org/10.1017/S0007123415000435