I. INTRODUCTION
Yttria (Y2O3)-stabilized tetragonal zirconia polycrystals (Y-TZP) are one of the most highly anticipated structural ceramics, because of their superior toughness, which is attributed to fracture-energy consumption by a stress-induced tetragonal-to-monoclinic phase transformation with ∼4% volume expansion. In addition to the high strength and toughness, Y-TZP nanocrystallization enhances its high-speed superplasticity, which is required for product molding. Electric current-activated/assisted sintering Reference Kumagai1 is a technique for the rapid densification of nanocrystalline Y-TZP powder compacts by resistance heating and concurrent uniaxial pressing in a closed conductive die. However, it is difficult to fabricate a full dense body that shows sufficient translucency, i.e., has a residual porosity of less than 0.05%, Reference Krell, Blank, Ma and Hutzler2 in an extremely short time.
Hot extrusion is a processing method that is used to apply the highest compressive and shear stresses to materials, especially brittle materials such as ceramics, without generating defects. From the point of view of material molding but also defect removal, it is important to determine the plastic deformation behavior of Y-TZP during extrusion.
Unfortunately, limited studies exist concerning the hot-extrusion properties of Y-TZP. Kellett Reference Kellett3 investigated the direct extrusion behavior of 3Y-TZP at 1773 K and a constant uniaxial applied stress of 35.5 to 49.5 MPa, and highlighted the similarity between extrusion and uniaxial creep deformation. However, the obtained stress exponent (n) of 2.5 is somewhat larger than 2, which is the widely accepted value for uniaxial creep experiments at 1523–1723 K and at 20–80 MPa. Reference Melendo and Rodríguez4 In general, when the deformation temperature increases at a constant uniaxial stress, the dominant creep mechanism changes from dislocation creep (n > 3) to diffusion creep (n = 1). For ceramic materials with difficulties in dislocation activity, such as 3Y-TZP, grain-boundary sliding (n = 2) plays a major role in place of dislocation creep. Thus, it is interesting to determine whether an increase in n as caused by an increase in temperature at a similar stress level is specific to extrusion deformation.
The purpose of this study was to investigate the deformation behavior of 3 mol% Y-TZP (3Y-TZP) during hot extrusion. An estimation of the thermal characteristics, including n and Q, and a discussion of the dominant mechanism for hot extrusion are also provided.
II. EXPERIMENTAL PROCEDURES
A. Preparation of 3Y-TZP billets
Billets were prepared by densifying as-received 3Y-TZP powder (product TZ-3Y, Tosoh Co. Ltd., Tokyo, Japan) within a closed cylindrical graphite die by using electric current-activated/-assisted sintering equipment (PAS-III-ES, Elenix Inc., Kanagawa, Japan). Reference Kumagai1 The chemical composition, including the impurities and Y2O3, as specified by the supplier was as follows: 0.005 wt% Al2O3, 0.002 wt% SiO2, 0.002 wt% Fe2O3, 0.020 wt% Na2O, and 5.22 wt% Y2O3 (= (ZrO2)97.1(Y2O3)2.9). The cylindrical graphite die had an inner and outer diameter of 15 and 45 mm, respectively, and a height of 40 mm. Powder (10.0 × 10⁻³ kg) packed in the die was pressed at a constant uniaxial pressure of 46.5 MPa using a pair of graphite rams (15-mm diameter, 30-mm length). Here, the one side of an upper ram next to the compact was recessed conically with a cone angle of 118°. After evacuating the chamber to 10 Pa, a short rectangular current pulse with an amplitude of 800 A (on and off times of 30 ms, i.e., an on/off ratio of 1) was applied for 30 s, followed by a constant direct current for 999 s. The temperature was monitored using a type-B thermocouple (Pt/Rh 70%/30%–Pt/Rh 94%/6%, by weight) attached inside the die at 7.5 mm from the die surface. The thermocouple temperature was corrected using an empirically derived equation for the die temperature distribution, which was obtained from a preliminary experiment. The average billet density as measured by Archimedes' method was 5.91 g/cm3, which is close to the reported theoretical density of 6.08 g/cm3.
B. Hot indirect extrusion of 3Y-TZP billets
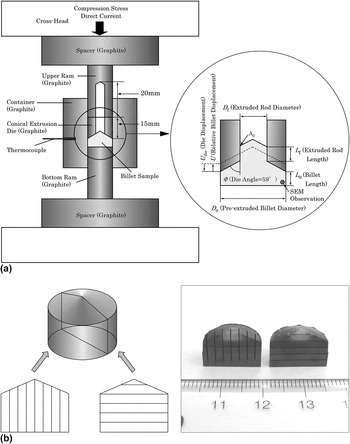
Hot-extrusion experiments were carried out by using the same electric current-activated/-assisted sintering equipment. The difference from densification is that the graphite extrusion conical die with a height of 15 mm, which was drilled with a diameter of 6 mm in the center, was inserted between the billet and the upper ram as shown in Fig. 1(a). A ∼20-mm-deep hole was drilled in the center of the upper ram. Billets were extruded at an extrusion ratio of 6.25 (15-mm diameter to 6-mm diameter) opposite to the ram travel, i.e., indirect extrusion. To reduce friction, all billets were lubricated by graphite foil with a thickness of 0.13 mm (Alfa Aesar, Lancashire, United Kingdom). After evacuating to 10 Pa, a constant compression stress of 60, 70, and 80 MPa was applied to the upper ram, followed by a constant direct current for ∼999 to 8000 s, without charging the rectangular current pulse.
(a) Schematic of apparatus used for indirect extrusion experiments and (b) billet with slits for graphite foil markers.

For visual observations of the material flow, graphite foil markers were inserted parallel and perpendicular to the extruded direction in each half of the billet, as shown in Fig. 1(b). Cuttings with a 2-mm depth for inserting the markers were made using a 0.2-mm-diameter diamond wire saw (Saw Model 228080, Diamond Wire Materials Technologies, Colorado Springs, Colorado). Billets with graphite foil marker inserts were returned to the original form, and the outer surfaces were lubricated by the graphite foil.
C. Microstructure observation
Billet crystal structures after the extrusion experiments were examined by x-ray diffractometry (XRD; M03XHF22, Bruker AXS K.K., Bruker Corporation, Kanagawa, Japan) using Cu Kα radiation at 50 kV and 32 mA. Microstructures were studied by scanning electron microscopy (SEM; S-4500, Hitachi Ltd., Tokyo, Japan). SEM samples were etched thermally at 1323 K for 600 s and coated with carbon after polishing with diamond paste.
III. RESULTS AND DISCUSSION
A. Extrusion behaviors
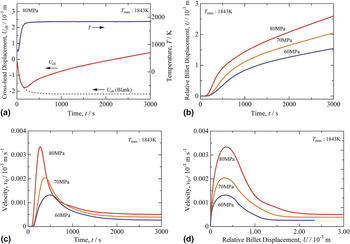
A typical cross-head displacement (U ch) versus extrusion-time (t) curve extruded at the final temperature of 1843 K (hereafter referred to as the extrusion temperature) under a constant compression stresses (σ0) of 80 MPa is shown in Fig. 2(a). Before reaching 1843 K (that corresponds to ∼t = 150 s), U ch showed a negative slope because of the large thermal expansion of the graphite extrusion die and rams, as shown by the broken curve (blank) in Fig. 2(a). The actual displacement of the extrusion die could be obtained by subtracting the thermal expansion [U ch (blank)] from U ch. Figure 2(b) shows the obtained actual displacement of the extrusion die versus time curves at 1843 K and the constant σ0 of 60, 70, and 80 MPa. Instead of the actual displacement of the extrusion die, the vertical axis is a “relative” billet displacement (U), which is equivalent to the billet displacement in direct extrusion. Figures 2(a) and 2(b) show that extrusion starts after ∼150 s, which corresponds to ∼1700 K, and the U value at an arbitrary time increases with increasing σ0.
(a) Crosshead displacement (U ch) and temperature (T) as a function of time (t) for a 3Y-TZP billet indirect extruded at a constant external compression stress (σ0) of 80 MPa (broken line is the U ch versus t plot for blank). (b) Relative billet displacement (U) as a function of t, (c) relative moving billet velocity (v 0) as a function of t, and (d) v 0 as a function of relative billet displacement (U) for 3Y-TZP billets indirect extruded at 1843 K and σ0 of 60, 70, and 80 MPa.

Figure 2(c) shows changes of velocity (v 0), which correspond to the gradient of the U ch–t curves in Fig. 2(a), as a function of t at the same T and σ0 as in Fig. 2(b). The re-plot of Fig. 2(c) is shown in Fig. 2(d), in which the horizontal axis is U instead of t. As shown in Fig. 2(c), in the early stage of extrusion, all the v 0–t curves showed velocity peaks. Afterward, v 0 decreases rapidly and then gradually approaches a constant v 0 value (after ∼t = 2000 s). The t value that corresponds to a maximum v 0 shifts to the longer side in accordance with the decrease in σ0. Interestingly, as shown in Fig. 2(d), all the U values that correspond to a maximum v 0 show an almost constant value of 0.4 mm, irrespective of σ0.
In general, for direct extrusion at constant extrusion ram velocity, an externally applied extrusion stress decreases gradually after the initial rapid increase, because of a decrease in sliding friction stress generated between the cylindrical portion of the billet and the container. For indirect extrusion, sliding friction is not generated between the billet and container. Thus, σ0 is constant value after the initial rapid increase. Consequently, for constant σ0, v 0 is considered to increase (direct extrusion) or assume a constant value (indirect extrusion, this study), which differs from the results in Figs. 2(c) and 2(d). A similar discrepancy has been reported in the direct extrusion experiments of 3Y-TZP by Kellett, Reference Kellett3 where the v 0 values decrease continuously, and approach a constant value by increasing the extrusion time (e.g., v 0 = 1.2 × 10⁴ s−1 at 1773 K, σ0 = 49.5 MPa, and 200 min).
Kellett suggested that no increase in v 0 is probable because of dynamic grain growth during extrusion. Reference Kellett3 Studies on uniaxial creep properties have suggested that the high-temperature plastic deformation of 3Y-TZP ceramic bulk can be described by
 $${\dot \varepsilon _{\rm{e}}} = A{{Gb} \over {kT}}{\left( {{b \over d}} \right)^p}\left[ {{D^*}\exp \left( { - {Q \over {RT}}} \right)} \right]{\left( {{{{\sigma _{\rm{e}}}} \over G}} \right)^n}\quad ,$$
where
 $\dot \varepsilon$
is the equivalent strain-rate, A is a dimensionless constant, G is the shear modulus, b is the magnitude of the Burgers vector, k is the Boltzmann constant, T is the absolute temperature, d is the grain size, p is the grain-size exponent, D* is the pre-exponential factor for diffusion, Q is the activation energy for creep deformation, R is the gas constant, σe is the equivalent stress, and n is the stress exponent.
Based on Eq. (1), when T, p, Q, σe, and n are constant,
 ${\dot \varepsilon _{\rm{e}}}$
is proportional to 1/d
p
. The dynamic grain growth (if it occurs) causes a decrease in
 ${\dot \varepsilon _{\rm{e}}}$
, and thus a decrease in v
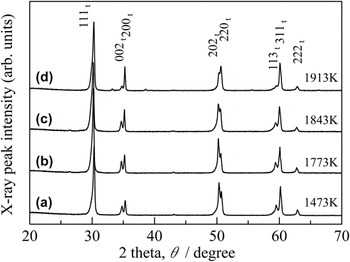
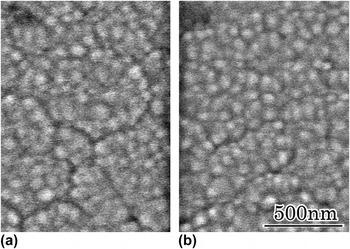
0. Figure 3 shows XRD patterns of the bottom portion of the pre-extruded billet and the remaining billets [as shown in Fig. 1(a)] after indirect extrusion at σ0 = 60 MPa and at various constant values of T of 1773 to 1913 K for 999 s. All crystalline peaks correspond to the tetragonal phase, irrespective of the extrusion temperature. Although the peak intensities that contain a c-axis component, i.e., 002, 202, and 113, are weakened in the billet extruded at 1913 K, the other billets extruded at and below 1843 K show a similar XRD profile. Figure 4 shows SEM images of the pre-extruded billet and the bottom portion of the remaining billet after extrusion at 1843 K and 60 MPa for 999 s. There is no difference in grain size (∼80 nm in diameter) before and after extrusion. These results suggest that apparent dynamic grain growth does not occur during extrusion, even at 1843 K, and the continuous decrease in v
0 in Figs. 2(c) and 2(d) is caused by other factors.
X-ray diffraction patterns from (a) a pre-extruded billet and remaining bottom portions [see Fig. 1(a)] of the billets indirect extruded for 999 s at σ0 = 60 MPa and (b) 1773 K, (c) 1843 K, (d) 1913 K.

SEM images from (a) a pre-extruded 3Y-TZP billet and (b) the remaining bottom portion [see Fig. 1(a)] of a billet extruded indirectly at σ0 = 80 MPa and 1843 K for 999 s.

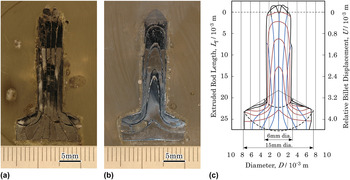
The most probable reason for the continuous decrease in v 0 is heterogeneous deformation flow. To clarify the material flow, a billet containing foil markers [as shown in Fig. 1(b)] was extruded at constant T = 1843 K and σ0 = 70 MPa for 8000 s. Figures 5(a) and 5(b) show a cross-section of the billet inserted with foil markers (a) parallel and (b) perpendicular to the extrusion direction. It was concerned that the slits for the foil markers and the reaction between the billet and the foil markers affect the extrusion behavior. However, the obtained relative billet displacement versus time curve is quite similar to that for the billet without foil markers in Fig. 2(b). Thus, the effects of the slits and the foil markers on the extrusion behavior are considered to be small. Figure 5(c) shows a delineated presentation of the foil markers in Figs. 5(a) and 5(b). The left-side vertical axes show the actual sample size, in which the initial die–billet interface is zero [point A 0 in Fig. 1(a)], and the right-side vertical axes show the corresponding relative billet displacement (U). Several interesting features include the fact that plastic deformation occurs between the two spherical surfaces [broken lines in Fig. 5(c)]. Next, in the initial extrusion stage, the central portion is extruded predominantly; the extruded rod contains only three vertical marker lines from L f = 0 to 7.5 (U = 0 to 1.2), but five vertical marker lines are visible from L f = 7.5 to 22.5 (U = 1.2 to 3.6). Deviations in the vertical marker lines from the extrusion direction decrease rapidly with an increase in L f. Thirdly, the occurrence of a “slight” dimple on the back of the billet predicted from the spherical surface [bottom side of the broken lines in Fig. 5(c)] is confirmed in Figs. 5(a) and 5(b). These results indicate that the material flow during extrusion changes gradually from a heterogeneous to a homogeneous deformation, which is well represented by a spherical velocity field. Thus, the rapid decrease in v 0 from U = 0 to 1.2 in Fig. 2(d) occurs because of the early severe nonuniform material flow, and this inhomogeneity decreases with decrease in σ0 and increase in extrusion time.
Photographs from a billet that is extruded indirectly at σ0 = 70 MPa and 1843 K for 8000 s; the graphite foil markers were inserted (a) parallel and (b) perpendicular to the extrusion direction. (c) Delineated presentation of graphite foil markers in (a) and (b).

B. Estimation of thermodynamic parameters
The strain-rate of the high-temperature plastic deformation of ceramic 3Y-TZP is related to stress by material factors of the stress exponent (n), grain-size exponent (p), grain size (d), and activation energy (Q), as shown in Eq. (1). Recent uniaxial creep experiments for 2-4Y-TZP with a d of 0.3–0.6 μm, at T = 1523–1723 K and σe = 20–80 MPa suggest that creep deformation proceeds by grain-boundary sliding and the constitutive equation can be expressed by using a threshold-compensated stress (σth) as follows Reference Melendo and Rodríguez4,Reference Retamal, Lagos, Moshtaghioun, Cumbrera, Rodríguez and García5 :
 $${\dot \varepsilon _{\rm{e}}} = {{{A_1}} \over {T{d^p}}}\exp \left( { - {Q \over {RT}}} \right){\left( {{\sigma _{\rm{e}}} - {\sigma _{{\rm{th}}}}} \right)^n}\quad ,$$
where A 1 = A(Gb/k)(b p /G n )D*. The threshold stress is considered to be the stress required to overcome the inhibition of grain-boundary sliding, because of the Y3+ segregation at the grain boundaries, Reference Melendo and Rodríguez4 and the theoretical interpretations has been attempted. Reference García, Martín, Bernabé and Rodríguez6 The empirical expression of the threshold stress is as follows Reference Melendo and Rodríguez4 :
 $${\sigma _{{\rm{th}}}} = {B \over d}\exp \left( {{{{Q_{{\rm{th}}}}} \over {RT}}} \right)\quad ,$$
where B is a constant, and Q th is the activation energy related to the threshold stress.
Activation energies for deformation (Q) and threshold stress (Q
th) have also been estimated by densification experiments
Reference Kumagai1
of nanocrystalline 3Y-TZP powder compacts with a considerably small d of 80 nm. However, in the case of densification, the stress that contributes to the actual deformation is variable as a function of relative density (ρ). Thus, the external compression stress (σ0) is normalized by ρ and ρint (initial relative density) to {(1 − ρint)/[ρ2(ρ − ρint)]}σ0. The densification rate
 $\left( {\dot \rho = {\rm{d}}\rho /{\rm{d}}t} \right)$
is also normalized by ρ to
 $\dot \rho /\rho$
.
 $\dot \rho /\rho$
and {(1 − ρint)/[ρ2(ρ − ρint)]}σ0 values are used as
 ${\dot \varepsilon _{\rm{e}}}$
and σe, respectively, in Eq. (2a).
For the uniaxial creep experiments, coefficient A 1 and Q in Eq. (2a) and coefficient B and Q th in Eq. (3a) are presented as follows Reference Melendo and Rodríguez4 :
 $${\dot \varepsilon _{\rm{e}}} = {{3 \times {{10}^{10}}} \over {T{d^2}}}\exp \left( { - {{460\;\left[ {{{{\rm{kJ}}} \mathord{\left/ {\vphantom {{{\rm{kJ}}} {{\rm{mol}}}}} \right. \kern-\nulldelimiterspace} {{\rm{mol}}}}} \right]} \over {RT}}} \right){\left( {{\sigma _{\rm{e}}} - {\sigma _{{\rm{th}}}}} \right)^2}$$
 $${\sigma _{{\rm{th}}}} = {{5 \times {{10}^{ - 4}}} \over d}\exp \left( {{{120\;\left[ {{{{\rm{kJ}}} \mathord{\left/ {\vphantom {{{\rm{kJ}}} {{\rm{mol}}}}} \right. \kern-\nulldelimiterspace} {{\rm{mol}}}}} \right]} \over {RT}}} \right)$$
with σe and σth in MPa and d in μm. In the densification experiments, the values of σth/G have been reported as 0.01164, 0.00722, 0.00574, 0.00380, 0.00278, and 0.00161 at 1150, 1200, 1250, 1300, 1350, and 1400 K, respectively. Reference Kumagai1 Because G = 66,051 − 13.3T (MPa), Reference Balasubramanian and Langdon7 the σth values are 591, 362, 284, 185, 134, and 76 (MPa). Thus, Eq. (3a) can be expressed as follows:
 $${\sigma _{{\rm{th}}}} = {{5.30 \times {{10}^{ - 4}}} \over d}\;\exp \left( {{{104.97 \pm 18.97\;\left[ {{{{\rm{kJ}}} \mathord{\left/ {\vphantom {{{\rm{kJ}}} {{\rm{mol}}}}} \right. \kern-\nulldelimiterspace} {{\rm{mol}}}}} \right]} \over {RT}}} \right)$$
with σth in MPa and d in μm. There is no information about A 1 in Eq. (2a) for densification, but Q has been reported to be 459.89 ± 26.02 kJ/mol.
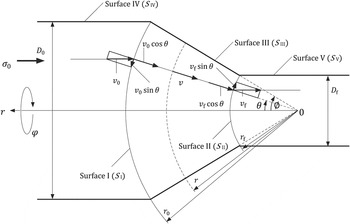
For indirect extrusion from a conical die, the plastic deformation flow of 3Y-TZP proceeds toward the apex of the cone as shown in Fig. 5(c). Thus, v
0, which is equivalent to the velocity of the relative moving billet displacement
 $\left( {\dot U} \right)$
, is related to σ0 as follows (details in appendix A, B, C, and D):
 $${{{v_0}} \over {{D_0}}} = {C \over {4{{\left( {4nK} \right)}^n}}}\sigma _{{\rm{eff}}}^n\quad ,$$
where D
0 is the billet diameter, C = (A
1/Td
p
) exp(−Q/RT), σeff is the effective extrusion stress obtained by subtracting the resistive stress that is generated by sliding friction (σsf) from σ0 [i.e.,
 ${\sigma _{{\rm{eff}}}} = {\sigma _0} - {\sigma _{{\rm{sf}}}}$
: appendix Eq. (D4)], and
 $$K = \left[ {{{\left( {{{{r_0}} \over {{r_{\rm{f}}}}}} \right)}^{{3 \over n}}} - 1} \right]{\sin ^{{1 \over n} - 2}}\phi \left\{ {{1 \over 3}\left[ {{{1 - {{\cos }^{2 + {1 \over n}}}\phi } \over {\left( {2 + {1 \mathord{\left/ {\vphantom {1 n}} \right. \kern-\nulldelimiterspace} n}} \right){{\sin }^{2 - {1 \over n}}}\phi }}} \right] + {1 \over {12}}\left( {{{{{\cos }^{{{2n + 1} \over n}}}\phi } \over {2n + 1}} - {{\cos }^{{1 \over n}}}\phi + {{2n} \over {2n + 1}}} \right)} \right\}\quad .$$
When an extrusion behavior is constrained by σth, similar to the uniaxial creep deformation, Eq. (4) can be corrected as follows:
 $${{{v_0}} \over {{D_0}}} = {C \over {4{{\left( {4nK} \right)}^n}}}{\left( {{\sigma _{{\rm{eff}}}} - {\sigma _{{\rm{th}}}}} \right)^n}\quad .$$
When T, d, and p are fixed, and there is no change in extrusion mechanism (i.e., constant n and Q), C is constant and, thus, Eqs. (4) and (5) can be rewritten as follows:
 $$\ln {v_0} = n \cdot \ln \left( {{\sigma _{{\rm{eff}}}}} \right) + \ln {{{D_0}C} \over {4{{\left( {4nK} \right)}^n}}}\quad ,$$
 $$\ln {v_0} = n \cdot \ln \left( {{\sigma _{{\rm{eff}}}} - {\sigma _{{\rm{th}}}}} \right) + \ln {{{D_0}C} \over {4{{\left( {4nK} \right)}^n}}}\quad .$$
The n values are slopes of the least-square lines for the log–log plots of
 ${v_0}$
versus σeff (or σeff − σth).
To obtain σeff and thus σsf, the sliding friction stress (τsf) must be estimated. Kellett Reference Kellett3 suggested that the tangential sliding friction at the interface between the billet lubricated by graphite foil and the graphite extrusion die is 1.8 MPa, when the billet was extruded directly at σ0 = 35.5 MPa. When the friction agrees with the classical Coulomb law, the sliding friction coefficient (μsf) is obtained by dividing τsf by the normal stress (i.e., σ0 in extrusion) and is estimated to be 0.050. We assume that the stress dependence of μsf is negligible, and so the τsf values are calculated by using μsf = 0.050. The resistive stress as generated by sliding friction (σsf) is obtained from the product of τsf and a contact area between the billet and the die (indirect extrusion) or the billet and the die and container (direct extrusion) (appendix C).
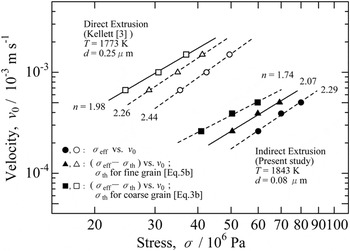
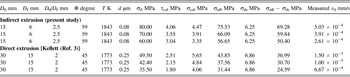
Figure 6 shows the log–log plot of v 0 versus σeff or (σeff − σth). The grain size of 80 nm in this study is considerably smaller than that for ordinary uniaxial creep experiments (0.3–1.2 μm). Reference Melendo and Rodríguez4 Thus, direct extrusion results by Kellett Reference Kellett3 using 3Y-TZP with a grain size of 0.25 μm are also shown in Fig. 6 for comparison. Kellett already estimated n (n = 2.5), but he used the v 0 values in the middle of the rapid decline (t = 100 min). Thus, v 0 values near steady-state (t = 200 min) were used in Fig. 6. With reference to the direct extrusion results, the instantaneous length (L 0) of the pre-extruded billet (cylindrical portion) at t = 200 min is estimated from L 0 = 15 mm at t = 100 min. In his direct extrusion experiments, σ0 changed periodically during a single extrusion experiment. Thus, L 0 at t = 200 min was obtained by subtracting 0.12 mm/min × 50 min (σ0 = 49.5 MPa) + 0.06 mm/min × 25 min (σ0 = 42.4 MPa) + 0.04 mm/min × 25 min (σ0 = 35.5 MPa) from L 0 = 15 mm at t = 100 min, to be 6.5 mm. All experimental parameters and measured velocities (v 0) for direct and indirect extrusion are listed in Table I.
Log–log plots of σeff versus v 0 (circle), (σeff − σth) versus v 0 by using Eq. (5b) for fine grain (triangle), and (σeff − σth) versus v 0 by using Eq. (3b) for coarse grain (square), for indirect (solid symbols) and direct (open symbols) extrusion experiments.

Extrusion parameters and measured velocity.

In Fig. 6, open and solid circles are log σeff versus log v 0 plots for direct and indirect extrusion, respectively. Both n values are larger than 2, but the n = 2.44 (t = 200 min) for direct extrusion is slightly smaller than the previously reported value of n = 2.5 (t = 100 min). Reference Kellett3 Open and solid squares are the log(σeff − σth) versus log v 0 plots, in which σth is estimated from Eq. (3b) for a larger grain size. Although the n = 1.74 for indirect extrusion is considerably smaller than n = 2, interestingly, n = 1.98 for direct extrusion is extremely close to n = 2. In contrast, when σth is compensated by Eq. (5b) for a smaller grain size, the n value for direct extrusion (n = 2.26) is larger than n = 2, but that for indirect extrusion (n = 2.07) is quite similar to n = 2. Despite the different processing modes, a similar n value of 2 is obtained for direct extrusion Reference Kellett3 and uniaxial creep deformation Reference Melendo and Rodríguez4 of 3Y-TZP with larger grain size, and also indirect extrusion and densification Reference Kumagai1 of 3Y-TZP with smaller grain size, respectively. These results indicate that plastic flow during direct and indirect extrusion at “higher” temperatures of 1773–1843 K is preceded by grain-boundary sliding (n = 2), similar to ordinary uniaxial creep deformation and densification at “lower” temperatures of 1523–1723 K and 1100–1473 K. Because Q th that eventually leads to n = 2 for a smaller grain size is smaller than that for a larger grain size, the grain-size refinement (from submicron to several tens of nanometers) reduces Q th, and thus σth. With respect to sliding friction, the μsf value of 0.050, and an assumption of its ignorable stress dependence seem to be reasonable for hot extrusion of the billets lubricated by the graphite foil.
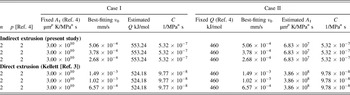
In this study, there are no available v 0 values at temperatures except for 1843 K. Thus, Q for extrusion could not be determined directly from the Arrhenius plot. However, when the measured v 0 value at given parameters of (σeff − σth) and n is substituted into Eq. (5), the C value is determined automatically. Because C = (A 1/Td p ) exp(−Q/RT), A 1 and Q are correlated, and Q (or A 1) can be estimated by using the reported value of A 1 (or Q) for uniaxial creep experiments in Eq. (2b). Reference Melendo and Rodríguez4 The obtained results are listed in Table II. Here, the obtained n value of 2 and the widely accepted P value of 2 are used in calculations. When A 1 is fixed at 3 × 10¹⁰ (μm2 K/MPa2 s) (referred to as Case I), the calculated Q values for direct and indirect extrusion are 524 and 553 kJ/mol, respectively. These values are slightly, but larger than 460 (kJ/mol) for uniaxial creep experiments in Eq. (2b). When Q is fixed at 460 (kJ/mol) (referred to as Case II), the calculated A 1 values for direct and indirect extrusion are 3.86 × 10⁸ and 6.83 × 10⁷ (μm2 K/MPa2 s), respectively. These values are smaller than A 1 = 3 × 10¹⁰ (μm2 K/MPa2 s) for uniaxial creep experiments Reference Melendo and Rodríguez4 [in Eq. (2b)] by two or three orders of magnitude. It has not been possible to decide which is appropriate in Case I or II. However, (i) the indirect extrusion temperature of 1843 K is close to 1913 K, which is near the starting temperature of the tetragonal-to-cubic transformation as shown in Fig. 3(d). (ii) For uniaxial creep deformation in 1.7Y-TZP, Reference Mora, García, Melendo and Rodríguez8 an n value of 2 is obtained without compensation of σe by σth (i.e., little Y segregation at the grain boundary), and the corresponding Q has a high value of 630 kJ/mol. (iii) Because of Y segregation at the grain boundary, the Y2O3 content in the grain interior of 3Y-TZP decreased from ∼3 to 4 to ∼2 mol% with an increase in sintering temperature from 1573 to 1773 K. Reference Matsui, Yoshida and Ikuhara9 Thus, when the Y2O3 contents in the grain interior of 3Y-TZP and 1.7Y-TZP are 3–4 and 1.7 mol%, and the corresponding Q values are 460 and 630 kJ/mol, respectively, it is considered that the Y2O3 contents in the grain interior of 3Y-TZP at 1773 K (direct extrusion) exist between 3 and 1.7, and the corresponding Q value lies between 460 and 630 kJ/mol. Unfortunately, there is no report of Y2O3 content in the grain interior of 3Y-TZP at 1843 K (indirect extrusion in this study). However, the increase in T from 1773 to 1843 K seems to cause a decrease in Y2O3 content in the grain interior, and an increase in Q from 524 to 553 kJ/mol. These features agree well with the results in Case I.
Estimated activation energy for extrusion and coefficient in constitutive equation for extrusion.

IV. CONCLUSIONS
Indirect hot extrusion of fully dense nanocrystalline 3Y-TZP billets with a grain size of 80 nm was investigated. Although ordinary uniaxial creep experiments were carried out mainly at 1523–1723 K, higher temperatures of ∼1800 K are required for extrusion, in which the billets are subjected to high compressive and shear stresses. Such a high-temperature extrusion flow in the plastic region is well presented by a spherical velocity field. Interestingly, despite the high temperature (1843 K), the extrusion behavior is rate-controlled not by diffusional creep (n = 1, i.e., Nabarro–Herring and Coble creep), but by grain-boundary sliding (n = 2), similar to ordinary uniaxial creep deformation at lower temperature (1523–1723 K).
New problems have also been revealed. (i) Grain-size refinement is effective to reduce the threshold stress (σth), thus much of the external compression stress (σ0) is expended for plastic deformation. However, too high a temperature is less efficient for increasing the extrusion velocity (v 0). High temperatures near ∼1850–1900 K cause the formation of a cubic phase (or its precursor) and a reduction in yttria content within the tetragonal grain interior. As a consequence, Q increases and v 0 decreases. (ii) The increase in σ0 is effective for increasing v 0, but causes initial severe nonuniform material flow. To obtain a uniform extruded rod in as short a period of time as possible, optimizations of extrusion stress, extrusion temperature, quantity of lubrication, and lubrication thickness are required.
NOMENCLATURE

ACKNOWLEDGMENTS
The author would like to acknowledge the experimental support of Mr Ryuta Nakano and Ms Kaori Nakase, National Defense Academy.
APPENDIX
A. Internal power of deformation
When materials flow toward the apex in the deformation zone between S I and S II (spherical velocity field Reference Avitzur10 ) in Fig. A, the relative moving velocity of the billets is expressed as follows:
 $${\dot U_{\rm{r}}} = v = - {v_{\rm{f}}}\cos \,\theta {\left( {{{{r_{\rm{f}}}} \over r}} \right)^2},\;\;{\dot U_\theta } = {\dot U_\varphi } = 0\quad .$$
Schematic of spherical velocity field proposed by Avitzur. Reference Avitzur10

From Eq. (A1), the strain-rates as a function of velocity components are
 $${\dot \varepsilon _{rr}} = {{\partial {{\dot U}_r}} \over {\partial r}} = 2{v_{\rm{f}}}r_{\rm{f}}^2{{\cos \theta } \over {{r^3}}}\quad ,$$
 $${\dot \varepsilon _{\theta \theta }} = {{{{\dot U}_r}} \over r} + {{\partial {{\dot U}_\theta }} \over {r\partial \theta }} = - {v_{\rm{f}}}r_{\rm{f}}^2{{\cos \theta } \over {{r^3}}}\quad ,$$
 $${\dot \varepsilon _{\varphi \varphi }} = {{{{\dot U}_r}} \over r} + {{\partial {{\dot U}_\varphi }} \over {r\partial \theta }} = - {v_{\rm{f}}}r_{\rm{f}}^2{{\cos \theta } \over {{r^3}}}\quad ,$$
 $${\dot \varepsilon _{rr}} = - 2{\dot \varepsilon _{\theta \theta }} = - 2{\dot \varepsilon _{\varphi \varphi }}\quad ,$$
 $${\dot \varepsilon _{r\theta }} = {1 \over 2} \cdot {1 \over r} \cdot {{\partial {{\dot U}_r}} \over {\partial \theta }} = {1 \over 2}{v_{\rm{f}}}r_{\rm{f}}^2{{\sin \,\theta } \over {{r^3}}}\quad ,$$
 $${\dot \varepsilon _{\theta \varphi }} = {\dot \varepsilon _{\varphi r}} = 0\quad .$$
The equivalent strain-rate is defined as follows:
 $$\dot \varepsilon _{\rm{e}}^2 =\; {2 \over 9}\left[ {{{\left( {{{\dot \varepsilon }_{rr}} - {{\dot \varepsilon }_{\theta \theta }}} \right)}^2} + {{\left( {{{\dot \varepsilon }_{\theta \theta }} - {{\dot \varepsilon }_{\varphi \varphi }}} \right)}^2} + {{\left( {{{\dot \varepsilon }_{\varphi \varphi }} - {{\dot \varepsilon }_{rr}}} \right)}^2}} \right] \;+ {4 \over 3}\left( {\dot \varepsilon _{r\theta }^2 + \dot \varepsilon _{\theta \varphi }^2 + \dot \varepsilon _{\varphi r}^2} \right)$$
 $$= \dot \varepsilon _{rr}^2 + {4 \over 3}\dot \varepsilon _{r\theta }^2\quad .$$
Because of volume constancy (
 ${v_0}r_0^2 = {v_{\rm{f}}}r_{\rm{f}}^2$
), the equivalent strain rate (Eq. A3) with Eqs. (A2d) and (A2e) can be rewritten as follows:
 $${\dot \varepsilon _{\rm{e}}} = 2{v_{\rm{f}}}r_{\rm{f}}^2{1 \over {{r^3}}}\sqrt {1 - {{11} \over {12}}{{\sin }^2}\,\theta } = 2{v_0}r_0^2{1 \over {{r^3}}}\sqrt {1 - {{11} \over {12}}{{\sin }^2}\,\theta } \quad .$$
The constitutive equation for steady-state plastic deformation at high temperature is represented as follows Reference Kellett3 :
 $${\dot \varepsilon _{\rm{e}}} = C\sigma _{\rm{e}}^n\quad .$$
Because
 ${{{{\dot \varepsilon }_{ij}}} \over {{\sigma _{ij}}}} = {3 \over 2}{{{{\dot \varepsilon }_{\rm{e}}}} \over {{\sigma _{\rm{e}}}}}$
, the stress component is rewritten by using Eq. (A5) as follows:
 $${\sigma _{ij}} = {2 \over 3}{\left( {{{{{\dot \varepsilon }_{\rm{e}}}} \over C}} \right)^{{1 \over n}}}{{{{\dot \varepsilon }_{ij}}} \over {{{\dot \varepsilon }_{\rm{e}}}}}\quad .$$
Thus, by using Eq. (A6), the internal power per unit volume within the deformation zone can be represented as follows:
 $${\dot w_1} = {\sigma _{ij}}{\dot \varepsilon _{ij}} = {1 \over {\root n \of C }}{\left( {{{\dot \varepsilon }_{\rm{e}}}} \right)^{{{n + 1} \over n}}}\quad .$$
After integration of Eq. (A7),
 $${\dot W_1} = \int_V {{\sigma _{ij}}{{\dot \varepsilon }_{ij}}{\rm{d}}V} = {1 \over {\root n \of C }}\int_V {{{\left( {{{\dot \varepsilon }_{\rm{e}}}} \right)}^{{{n + 1} \over n}}}\,{\rm{d}}V} \quad ,$$
where
 ${\rm{d}}V = 2\pi r\sin \,\theta r\,{\rm{d}}\theta \,{\rm{d}}r$
. By using Eq. (A4), Eq. (A8a) is rewritten as follows:
 $${\dot W_1} = {1 \over {\root n \of C }}\int_0^\theta {{{\int_{{r_f}}^{{r_0}} {\left[ {{{2{v_0}r_0^2} \over {{r^3}}}\sqrt {1 - {{11} \over {12}}{{\sin }^2}\,\theta } } \right]} }^{{{n + 1} \over n}}}2\pi r\sin \,\theta r\,{\rm{d}}\theta \,{\rm{d}}r}$$
 $$= 2\pi {{{{\left( {2{v_0}r_0^2} \right)}^{{{n + 1} \over n}}}} \over {\root n \of C }}\int_0^\phi {\left[ {{{\left( {1 - {{11} \over {12}}{{\sin }^2}\,\theta } \right)}^{{{n + 1} \over {2n}}}}\sin \theta \int_{{r_{\rm{f}}}}^{{r_0}} {{{\left( {{1 \over {{r^3}}}} \right)}^{{{n + 1} \over n}}}{r^2}\,{\rm{d}}r}}\right]} {\rm{d}}\theta}}$$
Because
 $\int_{{r_{\rm{f}}}}^{{r_0}} {{{\left( {{1 \over {{r^3}}}} \right)}^{{{n + 1} \over n}}}{r^2}\,{\rm{d}}r = {n \over 3}{{\left( {{1 \over {{r_0}}}} \right)}^{3 \over n}}\left[ {{{\left( {{{{r_0}} \over {{r_{\rm{f}}}}}} \right)}^{3 \over n}} - 1} \right]}$
, and r
0 sin ϕ = D
0/2, Eq. (A8b) is rewritten as follows:
 $${\dot W_1} =\; {{n\pi } \over 3}{v_0}D_0^2{\left( {{{4{v_0}} \over {C{D_0}}}} \right)^{{1 \over n}}}\left[ {{{\left( {{{{r_0}} \over {{r_{\rm{f}}}}}} \right)}^{{3 \over n}}} - 1} \right]{\sin ^{{1 \over n} - 2}}\phi \int_0^\phi {{{\left( {1 - {{11} \over {12}}{{\sin }^2}\,\theta } \right)}^{{{n + 1} \over {2n}}}}\sin \theta \;{\rm{d}}\theta } \quad .$$
An approximation of
 $1 - {{11} \over {12}}{\sin ^2}\,\theta \simeq 1 - {\sin ^2}\,\theta$
leads to
 $${\dot W_1} = {{n\pi } \over 3}{v_0}\,D_0^2{\left( {{{4{v_0}} \over {C{D_0}}}} \right)^{{1 \over n}}}\left[ {{{\left( {{{{r_0}} \over {{r_{\rm{f}}}}}} \right)}^{{3 \over n}}} - 1} \right]{\sin ^{{1 \over n} - 2}}\phi \left[ {{{1 - {{\cos }^{2 + {1 \over n}}}\phi } \over {\left( {2 + {1 \mathord{\left/ {\vphantom {1 n}} \right. \kern-\nulldelimiterspace} n}} \right){{\sin }^{2 - {1 \over n}}}\phi }}} \right]\quad .$$
B. Power loss because of velocity discontinuities
The stress component along S I is represented by Eq. (A6) as follows:
 $${\sigma _{r\theta }} = {2 \over 3}{\left( {{{{{\dot \varepsilon }_{\rm{e}}}} \over C}} \right)^{{1 \over n}}}{{{{\dot \varepsilon }_{r\theta }}} \over {{{\dot \varepsilon }_{\rm{e}}}}}\quad .$$
The strain-rate component along S I is represented by Eq. (A2e) as follows:
 $${\dot \varepsilon _{r\theta }}\left( {{S_{\rm{I}}}} \right) = {1 \over 2}{v_0}r_0^2{{\sin \theta } \over {r_0^3}} = {{{v_0}} \over {{D_0}}}\sin \phi \sin \theta \quad .$$
The equivalent strain-rate component along S I is represented by Eq. (A4) as follows:
 $${\dot \varepsilon _{\rm{e}}}\left( {{S_{\rm{I}}}} \right) = 2{v_0}{r_0}{1 \over {r_0^3}}\sqrt {1 - {{11} \over {12}}{{\sin }^2}\,\theta } = 4{{{v_0}} \over {{D_0}}}\sin \phi \sqrt {1 - {{11} \over {12}}{{\sin }^2}\,\theta } \quad .$$
Modification of Eq. (B3) leads to
 $${v_0} = {{{D_0}} \over {4\sin \phi }}{\left( {1 - {{11} \over {12}}{{\sin }^2}\,\theta } \right)^{ - {1 \over 2}}}{\dot \varepsilon _{\rm{e}}}\quad .$$
Because
 ${\rm{d}}S = 2\pi {r^2}\sin \theta \,{\rm{d}}\theta$
, power loss of velocity discontinuity along S
I is obtained through Eqs. (B1), (B2), (B3), and (B4) as follows:
 $${\dot W_2} = \int_{{S_{\rm{I}}}} {\left| {\Delta {v_{{S_{\rm{I}}}}}} \right|{\sigma _{r\theta }}{\rm{d}}S} = \int_{{S_{\rm{I}}}} {\left| {{v_0}\sin \theta } \right|{\sigma _{r\theta }}{\rm{d}}S}$$
 $$= - \int_0^\phi {\left[ {{{{D_0}} \over {4\,\sin \phi }}{{\left( {1 - {{11} \over {12}}{{\sin }^2}\,\theta } \right)}^{ - {1 \over 2}}}}\sin \theta {2 \over 3}{{\left( {4{{{v_0}} \over {C{D_0}}}\sin \phi \sqrt {1 - {{11} \over {12}}{{\sin }^2}\,\theta } } \right)}^{{1 \over n}}}\left( {{{{v_0}} \over {{D_0}}}\sin \phi \sin \theta } \right)} \right]2\pi r_0^2\sin \theta \,{\rm{d}}\theta }$$
 $$= - {{\pi {v_0}D_0^2} \over {12}}{\left( {{{4{v_0}} \over {C{D_0}}}} \right)^{{1 \over n}}}{\sin ^{{1 \over n} - 2}}\phi \int_0^\phi {{{\sin }^3}\,\theta {{\left( {1 - {{11} \over {12}}{{\sin }^2}\,\theta } \right)}^{{{1 - n} \over {2n}}}}{\rm{d}}\theta } \quad .$$
An approximation by
 $1 - {{11} \over {12}}{\sin ^2}\,\theta \simeq 1 - {\sin ^2}\,\theta$
leads to
 $${\dot W_2} = - {{n\pi {v_0}D_0^2} \over {12}}{\left( {{{4{v_0}} \over {C{D_0}}}} \right)^{{1 \over n}}}{\sin ^{{1 \over n} - 2}}\,\phi \left( {{{{{\cos }^{{{2n + 1} \over n}}}\phi } \over {2n + 1}} - {{\cos }^{{1 \over n}}}\,\phi {{2n} \over {2n + 1}}} \right)\quad .$$
Power loss of velocity discontinuity along S
II (
 ${\dot W_3}$
) is obtained in the same manner as
 ${\dot W_2}$
. The strain-rate component along S
II is represented by Eq. (A2e) as follows:
 $${\dot \varepsilon _{r\theta }}\left( {{S_{{\rm{II}}}}} \right) = {1 \over 2}{v_{\rm{f}}}r_{\rm{f}}^2{{\sin \theta } \over {r_{\rm{f}}^3}} = {{{v_{\rm{f}}}} \over {{D_{\rm{f}}}}}\sin \phi \sin \theta \quad .$$
The equivalent strain-rate component along S II is represented by Eq. (A4) as follows:
 $${\dot \varepsilon _{\rm{e}}}\left( {{S_{{\rm{II}}}}} \right) = 2{v_{\rm{f}}}{r_{\rm{f}}}{1 \over {r_{\rm{f}}^3}}\sqrt {1 - {{11} \over {12}}{{\sin }^2}\,\theta } = 4{{{v_{\rm{f}}}} \over {{D_{\rm{f}}}}}\sin \phi \sqrt {1 - {{11} \over {12}}{{\sin }^2}\,\theta } \quad .$$
Modification of Eq. (B7) leads to
 $${v_{\rm{f}}} = {{{D_{\rm{f}}}} \over {4\sin \phi }}{\left( {1 - {{11} \over {12}}{{\sin }^2}\,\theta } \right)^{ - {1 \over 2}}}{\dot \varepsilon _{\rm{e}}}\quad .$$
Thus, power loss because of velocity discontinuity along S II is
 $${\dot W_3} = \int_{{S_{{\rm{II}}}}} {\left| {\Delta {v_3}} \right|{\sigma _{r\theta }}{\rm{d}}S} = \int_{{S_{{\rm{II}}}}} {\left| {{v_{\rm{f}}}\sin \theta } \right|{\sigma _{r\theta }}{\rm{d}}S}$$
 $$= {{\pi {v_{\rm{f}}}D_{\rm{f}}^2} \over {{\rm{12}}}}{\left( {{{4{v_0}} \over {C{D_0}}}} \right)^{{1 \over n}}}{\sin ^{{1 \over n} - 2}}\phi \int_0^\phi {{{\sin }^3}\,\theta {{\left( {1 - {{11} \over {12}}{{\sin }^2}\,\theta } \right)}^{{{1 - n} \over {2n}}}}{\rm{d}}\theta }$$
Because
 ${v_{\rm{f}}}r_{\rm{f}}^2 = {v_0}r_0^2$
and D
f = D
0(r
f/r
0),
 ${{{v_{\rm{f}}}} \over {{D_{\rm{f}}}}} = {{{v_0}} \over {{D_0}}}{\left( {{{{r_0}} \over {{r_{\rm{f}}}}}} \right)^3}$
, Eq. (B9a) can be rewritten as follows:
 $${\dot W_3} = {{\pi {v_0}D_0^2} \over {12}}{\left( {{{4{v_0}} \over {C{D_0}}}} \right)^{{1 \over n}}}{\sin ^{{1 \over n} - 2}}\phi {\left( {{{{r_0}} \over {{r_{\rm{f}}}}}} \right)^{{3 \over n}}}\int_0^\phi {{{\sin }^3}\,\theta {{\left( {1 - {{11} \over {12}}{{\sin }^2}\,\theta } \right)}^{{{1 - n} \over {2n}}}}{\rm{d}}\theta } \quad .$$
Approximation by
 $1 - {{11} \over {12}}{\sin ^2}\,\theta \simeq 1 - {\sin ^2}\,\theta$
leads to
 $${\dot W_3} = {{n\pi {v_0}D_0^2} \over {12}}{\left( {{{4{v_0}} \over {C{D_0}}}} \right)^{{1 \over n}}}{\sin ^{{1 \over n} - 2}}\phi {\left( {{{{r_0}} \over {{r_{\rm{f}}}}}} \right)^{{3 \over n}}}\left( {{{{{\cos }^{{{2n + 1} \over n}}}\phi } \over {2n + 1}} - {{\cos }^{{1 \over n}}}\phi + {{2n} \over {2n + 1}}} \right)\quad .$$
C. Power loss because of sliding friction
Power loss because of sliding friction along the conical portion of S III is represented as follows:
 $${\dot W_4} = \int_{{S_{{\rm{III}}}}} {{\tau _{{\rm{sf}}}}\left| {\Delta {v_{{\rm{III}}}}} \right|{\rm{d}}S} = \int_{{r_{\rm{f}}}}^{{r_0}} {{\tau _{{\rm{sf}}}}{v_0}\cos \,\emptyset {{\left( {{{{r_0}} \over r}} \right)}^2}2\pi r\sin \,\emptyset \,{\rm{d}}r}$$
 $$= \left[ {{\tau _{{\rm{sf}}}}2\cot \,\emptyset \,{\rm{ln}}\left( {{{{r_0}} \over {{r_{\rm{f}}}}}} \right)} \right]\pi {\left( {{{{D_0}} \over 2}} \right)^2}{v_0}\quad .$$
For indirect extrusion, there is no need to consider power loss because of sliding friction along the cylindrical portion of S
IV (
 ${\dot W_5}$
). However, for direct extrusion,
 ${\dot W_5}$
is an important factor that affects extrusion behavior.
 ${\dot W_5}$
is represented as follows:
 $${\dot W_5} = \int_{{S_{{\rm{IV}}}}} {{\tau _{{\rm{sf}}}}\left| {\Delta {v_{{\rm{IV}}}}} \right|{\rm{d}}S} = \int_0^L {{\tau _{{\rm{sf}}}}{v_0}\pi {D_0}\,{\rm{d}}L} = {\tau _{{\rm{sf}}}}{v_0}\pi {D_0}L = \left[ {{\tau _{{\rm{sf}}}}{{4L} \over {{D_0}}}} \right]\pi {\left( {{{{D_0}} \over 2}} \right)^2}{v_0}\quad .$$
D. Applied power
When the applied power equals to the upper bound energies, Reference Avitzur10 the applied stress (σ0) is represented as follows:
 $${\sigma _0}\pi {\left( {{{{D_0}} \over 2}} \right)^2}{v_0} = {\dot W_1} + {\dot W_2} + {\dot W_3} + {\dot W_4} + {\dot W_5}\quad .$$
Equation (D1) is rewritten through Eq. (A8d), (B5b), (B9c), (C1), and (C2) as follows:
 $$\left[ {{\sigma _0} - {\tau _{{\rm{sf}}}}2\,\cot \emptyset \ln \left( {{{{r_0}} \over {{r_{\rm{f}}}}}} \right) - {\tau _{{\rm{sf}}}}{{4L} \over {{D_0}}}} \right]\pi {\left( {{{{D_0}} \over 2}} \right)^2}{v_0}$$
 $$= \pi n{v_0}D_0^2{\left( {{{4{v_0}} \over {C{D_0}}}} \right)^{{1 \over n}}}\left[ {{{\left( {{{{r_0}} \over {{r_{\rm{f}}}}}} \right)}^{{3 \over n}}} - 1} \right]{\sin ^{{1 \over n} - 2}}\phi \left\{ {{1 \over 3}\left[ {{{1 - {{\cos }^{2 + {1 \over n}}}\phi } \over {\left( {2 + {1 \mathord{\left/ {\vphantom {1 n}} \right. \kern-\nulldelimiterspace} n}} \right){{\sin }^{2 - {1 \over n}}}\phi }}} \right] \quad+ {1 \over {12}}\left( {{{{{\cos }^{{{2n + 1} \over n}}}\phi } \over {2n + 1}} - {{\cos }^{{1 \over n}}}\phi + {{2n} \over {2n + 1}}} \right)} \right\}\quad .$$
Equation (D2) is rewritten as follows:
 $${{{v_0}} \over {{D_0}}} = {C \over {4{{\left( {4nK} \right)}^n}}}\sigma _{{\rm{eff}}}^n\quad ,$$
where
 $$K = \left[ {{{\left( {{{{r_0}} \over {{r_{\rm{f}}}}}} \right)}^{{3 \over n}}} - 1} \right]{\sin ^{{1 \over n} - 2}}\phi \left\{ {{1 \over 3}\left[ {{{1 - {{\cos }^{2 + {1 \over n}}}\phi } \over {\left( {2 + {1 \mathord{\left/ {\vphantom {1 n}} \right. \kern-\nulldelimiterspace} n}} \right){{\sin }^{2 - {1 \over n}}}\phi }}} \right] \quad\;+ {1 \over {12}}\left( {{{{{\cos }^{{{2n + 1} \over n}}}\phi } \over {2n + 1}} - {{\cos }^{{1 \over n}}}\phi + {{2n} \over {2n + 1}}} \right)} \right\}$$
and
 $${\sigma _{{\rm{eff}}}} = {\sigma _0} - {\sigma _{{\rm{sf}}}}\quad .$$
The external stresses required to overcome the interfacial sliding friction stress (σsf) in Eq. (D4) are given as follows:
For direct extrusion,
 $${\sigma _{{\rm{sf}}}} = {\tau _{{\rm{sf}}}}2\,\cot \,\emptyset \,\ln \left( {{{{r_0}} \over {{r_{\rm{f}}}}}} \right) - {\tau _{{\rm{sf}}}}{{4L} \over {{D_0}}}\quad .$$
For indirect extrusion,
 $${\sigma _{{\rm{sf}}}} = {\tau _{{\rm{sf}}}}2\cot \,\emptyset \,{\rm{ln}}\left( {{{{r_0}} \over {{r_{\rm{f}}}}}} \right)\quad .$$
E. Uniaxial creep deformation
The constitutive equation for steady-state uniaxial creep deformation obtained experimentally Reference Melendo and Rodríguez4 is
 $${\dot \varepsilon _{rr}} = A{{Gb} \over {kT}}{\left( {{b \over d}} \right)^p}\left[ {{D^*}\exp \left( { - {Q \over {RT}}} \right)} \right]{\left( {{{{\sigma _{rr}}} \over G}} \right)^n}\quad .$$
When the stress exponent (n) and grain size exponent (p) are constant during uniaxial creep deformation, Eq. (E1) can be rewritten as follows:
 $${\dot \varepsilon _{rr}} = {{{A_1}} \over {T{d^p}}}\left[ {\exp \left( { - {Q \over {RT}}} \right)} \right]{\sigma _{rr}}^n\quad ,$$
where
 $${A_1} = A{{Gb} \over k} \cdot {{{b^p}} \over {{G^n}}}{D^*}\quad .$$
In uniaxial creep deformation,
 ${\dot \varepsilon _{rr}}$
and
 ${\sigma _{rr}}$
equal
 ${\dot \varepsilon _{\rm{e}}}$
and
 ${\sigma _{\rm{e}}}$
, respectively, and Eq. (E2) can be rewritten as follows:
 $${\dot \varepsilon _{\rm{e}}} = {{{A_1}} \over {T{d^p}}}\left[ {\exp \left( { - {Q \over {RT}}} \right)} \right]{\sigma _{\rm{e}}}^n\quad .$$
A comparison of Eqs. (A5) and (E4) yields
 $$C = {{{A_1}} \over {T{d^p}}}\exp \left( { - {Q \over {RT}}} \right)\quad .$$