1. Introduction
Social scientists have long been aware that voting technology may have important effects on elections, making valid voting harder or easier, and favoring some candidates over others. In particular, many studies have sought to study the impact of the fastest-growing voting technology in the 21st century, electronic voting machines, or EVMs (sometimes called DRE machines, or e-voting machines).Footnote 1 These studies mostly look at the impact of EVMs on valid and invalid votes, finding that, in general, voting machines lead to small reductions in invalid or “residual” votes (Ansolabehere and Stewart, Reference Ansolabehere and Stewart2005; Card and Moretti, Reference Card and Moretti2007; Allers and Kooreman, Reference Allers and Kooreman2008; Fujiwara, Reference Fujiwara2015). This reduction is interpreted in a normatively positive fashion, since invalid votes are assumed to be the result of unintentional error, and thus reducing such errors should increase overall political participation.
However, many have argued that invalid ballots are often consciously cast by voters to signal their dissatisfaction with the electoral system (Power and Garand, Reference Power and Garand2007; Uggla, Reference Uggla2008; Katz and Levin, Reference Katz and Levin2018; Moral, Reference Moral2016; Cohen, Reference Cohen2018). This literature argues that invalid votes are used by voters to protest against poor government performance (Cohen, Reference Cohen2018), a manifestation of discontent with the electoral alternatives on the ballot (Uggla, Reference Uggla2008), or the lack of distinguishable policy offerings (Moral, Reference Moral2016). Of course, voters have other means of protest at their disposal, such as voting for insurgent parties (Alvarez et al., Reference Alvarez, Kiewiet and Núñez2018). Scholars have argued that votes for extra-parliamentary parties—parties that are not expected to gain representation in the parliament—and votes for niche parties may be affected by the same variables as for invalid votes (Uggla, Reference Uggla2008; Moral, Reference Moral2016).
A natural question to pose is thus: If EVMs make invalid voting difficult, what do the voters who would previously have cast invalid ballots do after their introduction? Knowing that invalid votes could serve as a tool of voter protest, if EVMs force a decrease in invalid voting could it manifest itself in another form? In this paper, we develop and test a simple theory of the effect of the introduction of EVM on vote choice, and, in particular, on the ways in which voters express discontent. We suggest that many of the voters who spoiled their ballots did so deliberately, to protest the political system or the set of candidates presented to them. After the introduction of voting machines, these voters should begin to vote for candidates of non-viable and/or non-establishment parties. To use Alvarez et al.'s (Reference Alvarez, Kiewiet and Núñez2018) terminology, the change in voting technology leads to a decline in “BNS protest voting” (blank, null, or spoiled ballots) and a corresponding increase in “insurgent party protest voting.” This implies that the various types of protest voting are fungible, and that invalid voting may represent voter dissatisfaction as much as voter confusion.
We test this theory using data from India. To identify the causal effect of electronic voting machines in India, we take advantage of their gradual introduction in the national Lok Sabha (parliament) elections, using a difference-in-differences design with both constituency and year fixed effects to account for confounding spatial and temporal effects. While the subset of 45 “pilot” constituencies in which the voting machines were introduced early (in 1999) was not representative of the country, we show that the two types of constituencies have fairly similar trends in electoral behavior before the introduction of EVMs. This strategy is supplemented by the use of a set of time-varying controls, and the use of alternative samples with less variance between the treatment and control conditions. This is the first study to our knowledge to examine the effect of EVMs on any outcome in India, or in any country with an income significantly below the world's average income. The effects of Indian EVMs are also of direct significance: The inexpensive Indian model is the world's second most used voting technology of any kind (after paper ballots), and is currently in use for elections in India, Kenya, Namibia, Nepal, and Bhutan.
We find that the introduction of EVMs in India had substantial effects on voter behavior. The rate of invalid voting was slashed by more than 90 percent. This stems directly from the design of Indian voting machines, which make invalid voting impossible without notifying polling staff. More interestingly, we find evidence consistent with a move from BNS protest voting to insurgent party protest voting. The introduction of voting machines is associated with a sharp rise in voting for minor parties, on the order of between one and three percentage points, leading to increased fragmentation of the overall vote.
We present several additional pieces of evidence that this result is a product of deliberate action by protest voters. Firstly, candidates that receive a very small vote share do not benefit from the introduction of voting machines, suggesting that the increase in minor party vote share is not a product of random button pressing. Secondly, this effect holds even within parties: The vote share for the left parties and the Bahujan Samaj Party (BSP) rises or stays constant with voting machines in states where they are insignificant electorally, but fall with the introduction of EVMs in states where these parties are contenders for office. Thirdly, the effect on minor candidate vote share is moderated by the invalid voting rate in the constituency in 1998, suggesting that invalid votes are being funneled to minor candidates after the advent of voting machines. Finally, the introduction of a “None of the Above” (NOTA) option (an “officially sanctioned protest voting” option in Alvarez et al.'s (Reference Alvarez, Kiewiet and Núñez2018) terminology) in 2014 is associated with a fall in minor party vote of similar size to the rise that occurred at EVM introduction.
Our results thus broadly suggest that the various forms of protest voting discussed by Alvarez et al. (Reference Alvarez, Kiewiet and Núñez2018) are fungible, and that these substitutions are affected by technology. They also imply that a large portion of invalid votes in some countries may be protest votes. To the best of our knowledge, this is the first study that analyzes the potential substitutability between different forms of protest votes, and provides evidence in favor of this claim. This is also the first study that investigates the interaction between electronic voting technology and protest voting. In the context of India, our results also indicate that one of the unanticipated consequences of the introduction of EVMs in India was the subsequent removal of the possibility of casting an invalid vote as a method of voter protest. The decision to add a NOTA option to Indian voting machines now allows a more direct reflection of voter preferences for protest.
By contrast, we find little evidence for other possible second-order effects of EVM introduction. EVMs are associated with reductions in voter turnout, but these results are not robust, and may stem from unobserved differences between constituencies. Similarly, there is little or no evidence that voting machines have altered the number of voters who unintentionally vote for the wrong candidate, as measured by the tendency of voters to choose based on ballot position. We find no evidence for voting machines favoring specific parties, including state incumbents, or the major national parties. Similarly, there is no evidence that turnout was reduced in constituencies that could be prone to ballot box stuffing. These results focus on the introduction of machines that did not have any form of paper receipt or auditable record, which was only introduced in some constituencies in 2014. We find that voter verifiable paper audit trail (VVPAT) enabled machines have no effect on any major electoral outcome.
2. Theoretical Framework
2.1. Protest voting as an empirical phenomenon
Invalid voting may be either intentional or unintentional. Unintentional invalid voting may reflect voter confusion with the voting technology, which leaves them to deviate from the proper voting procedure even though they wished to cast a valid ballot. However, invalid voting may also reflect a deliberate choice of a voter who dislikes the candidates on offer. To quote Katz and Levin (Reference Katz and Levin2018), spoiled ballots “arise from a combination of voter errors and deliberate attempts to signal political discontent.” The act of using an invalid vote to protest the political system could be expressive in nature. In this scenario, casting an invalid ballot is akin to proclaiming one's discontentment with the political system (Power and Roberts, Reference Power and Roberts1995; Power and Garand, Reference Power and Garand2007; Uggla, Reference Uggla2008; Moral, Reference Moral2016; Cohen, Reference Cohen2018). The literature on spoiled ballots has found evidence that voters in Brazil (Power and Roberts, Reference Power and Roberts1995), Germany (Stiefbold, Reference Stiefbold1965), France (Rosenthal and Sen, Reference Rosenthal and Sen1973), among others, use a spoiled ballot to register their protest with the political system, or with the lack of political alternatives.
Intentional casting of invalid ballots is not the only type of way that voters cast protest votes. Alvarez et al. (Reference Alvarez, Kiewiet and Núñez2018) provide a typology of such protest voting, which includes both “BNS protest voting” and “insurgent party protest voting,” in which voters choose parties that are “anti-establishment, unorthodox, ideologically extreme, frivolous, or some convex combination of these characteristics.” As this definition makes clear, the definition of a protest party is usually ad hoc and context specific. Often, particularly in first-past-the-post systems, these candidates will be highly unlikely to be electorally viable.
Insurgent party protest voting can be seen as a result of voter dissatisfaction with major political parties, or the party system as a whole (Bardi, Reference Bardi1996; Bélanger, Reference Bélanger2004). For example, Bélanger (Reference Bélanger2004) finds that third parties in Australia, Britain, and Canada, or parties that are outside the two-party dominance in these countries, benefit from a general dislike of major party alternatives. Similarly, Uggla (Reference Uggla2008) also examines whether “extra-parliamentary” votes—that is, votes for minor parties that are unlikely to get representation in the parliament—are affected by alienation. He finds that, like with invalid voting, these votes are also affected by the structure of political competition. Moreover, since these parties rarely win elections, or are rarely included in electoral coalitions, they do not have any effect on policies implemented by governments (Bélanger, Reference Bélanger2004). As a result, votes cast for them tend to only increase the overall fractionalization of the vote. However, despite the commonalities between the variables determining the support for minor parties and for invalid ballots (Uggla, Reference Uggla2008), no study focuses on the potential substitutability of these two forms of voter protest.
2.2. Potential substitutability between different forms of protest votes
In this section, we build on the decision theoretic model from Katz and Levin (Reference Katz and Levin2018), and show that invalid voting and voting for minor parties may be substitutable. Consider an election in a first-past-the-post system. The voters face a choice between voting for one of the candidates presented to them, casting an invalid ballot, or abstaining. The rational choice literature on electoral participation has identified certain instrumental and non-instrumental benefits to voting (Riker and Ordeshook, Reference Riker and Ordeshook1968). These include benefits from getting a preferred candidate to win the election, denoted by pB where p is the probability that the voter is pivotal to the election, and B refers to the relative benefit that the voter gets in return for the preferred candidate winning the election. In addition to the instrumental benefit from voting, there are intrinsic benefits to the act of casting a vote, denoted by D V. These benefits stem from the very act of casting a vote, which could be related to, but not limited to, fulfilling their civic duty of voting.
As Katz and Levin (Reference Katz and Levin2018) outline, a voter wishing to cast a valid vote must also bear informative and cognitive costs, which are related to spending effort figuring out the right choice to vote for, and to follow the instructions to mark ballots correctly. These are labeled C C. In general, all voters face costs to go to the polling station, represented by C P. Taking into account that voters may also cast invalid ballots in order to express their discontentment with the political establishment (Uggla, Reference Uggla2008; Cohen, Reference Cohen2018), a voter can derive expressive benefits, E, from voting in this fashion. As with valid votes, there may be some intrinsic benefits from casting an invalid vote, which we denote by D I. A voter wishing to intentionally cast a invalid vote does not face cognitive costs of choosing the right candidate or to make sure that ballot meets the stipulated conditions to be counted as valid. Normalizing the benefit from abstaining to 0, the decision calculus faced by the voter is to compare the expected utility from casting a valid vote for a candidate on the ballot, ${\opf E}(U_V)$ , to that for submitting an invalid vote, ${\opf E}(U_I)$
 :


Thus, the voters choice, Y, reflects the following decision rule (Katz and Levin, Reference Katz and Levin2018):

Thus, in this framework, a voter casts an invalid vote if the expressive benefit, E, is relatively high, or if the cognitive cost of voting in a valid way, C C, is relatively high.
Now suppose that the option of invalid voting is taken away exogenously, potentially through the introduction of a voting technology that makes it nearly impossible to cast such a ballot. The literature on insurgent party protest voting suggests that voters may vote for parties that are “extra-parliamentary” as an expression of their disenchantment with parties that win elections more regularly (Bélanger, Reference Bélanger2004; Uggla, Reference Uggla2008). Thus, voting for such party also carries with it an expressive component, E M, like in the case of invalid voting. Furthermore, since these parties are not part of the major political system, they are very unlikely to win the election (Bélanger, Reference Bélanger2004). This would be even more likely in a first-past-the-post system. Thus, pB is likely to be close to 0 if an individual votes for a minor party. Moreover, the cognitive costs of voting for such a party are likely to be close to 0, because it is relatively easy to identify a party that is not part of the major party system. Thus, the expected utility from voting for a minor party is given by the following

Compare the expected utility from casting an invalid ballot in (2) to the expected utility from voting for a minor party (4). Faced with a forced choice, a voter who intentionally used to cast an invalid vote can choose to vote for a minor party if the expressive benefit from doing so (E M) is relatively similar to that from invalid voting (E). The literature suggests that both options carry equivalent expressive forces (Uggla, Reference Uggla2008; Moral, Reference Moral2016). This would imply that both these options are substitutable.
Many authors find that the introduction of voting machines reduces the level of invalid voting (Stewart, Reference Stewart2006; Fujiwara, Reference Fujiwara2015; Katz and Levin, Reference Katz and Levin2018), often due to the design of the machines. In general, the literature has concluded that the reduction in residual votes is normatively good, because of the implicit assumption that invalid votes were mostly unintentional, and cast by poor and unsophisticated voters. However, no study focuses on explaining what happens to intentionally cast invalid ballots after the introduction of voting machines. Given the preceding discussion regarding the potential substitutability between invalid votes and minor party voting as forms of protest, we derive our core hypothesis:
Hypothesis 1
The introduction of EVMs is associated with increases in electoral fragmentation and in the vote share of minor parties, through a forced decline in invalid votes.
In addition, we investigate several subsidiary hypotheses, outlined in greater detail in the online Appendix. They deal with confused voting, turnout, and electoral fraud.
3. Electronic Voting in India
3.1. Background
India is a federal parliamentary republic, and the world's largest democracy by population. Its electoral system closely mirrors that of Britain, with single-member districts whose members are elected using a first-past-the-post system. The directly elected lower house of the national parliament, the Lok Sabha, contains 543 single member districts, each with a population of approximately two million. Since only the lower house of the legislature is directly elected, and because national, state, and local elections are on different cycles, in most cases Indian voters only vote in one race in any given election.
State and national elections in India are administered by an independent national body, the Election Commission of India (ECI), which is granted wide powers over the bureaucracy and police during the election period. The ECI also supervises the creation of a register of eligible voters, enrollment which is automatic. The commission is widely regarded as politically neutral and relatively efficient (McMillan, Reference McMillan2012), and takes extensive measures to guarantee the security of voters and the neutrality of the electoral process. Note that the national administration of election and common ballot structure means that these factors are unlikely to cause spatial variation in elections, unlike the United States (Stein et al., Reference Stein, Vonnahme, Byrne and Wallach2008; Herrnson et al., Reference Herrnson, Hanmer and Niemi2012). Furthermore, voting in India is not compulsory, and a sizeable proportion of voters choose to abstain. In general, the turnout rate is around 60 percent in national elections.
Prior to 1998, all elections in India used paper ballots, with the names of candidates and printed on ballots. To help illiterate voters, all parties and independent candidates were distinguished by symbols. The voters marked the square next to the symbol of their preferred candidate and folded the ballot first vertically and then horizontally before putting it in the ballot box. The ballots were then counted in the presence of ECI officials and the parties, with “invalid votes” being those where no candidate preference could be assigned. Voters were not allowed to write in candidate names, or vote for a “none of the above” option without notifying the returning officer.Footnote 2
Note that a large portion of the electorate in India are illiterate—48 percent of adults in 1991, and 35 percent in 2001. Despite extensive information campaigns by the ECI and the parties, India's very simple ballot structure, and the heavy use of party symbols, illiterate voters may sometimes have found it difficult to navigate and mark written ballots. This may plausibly have increased their likelihood of casting invalid or residual votes. In 1998, 1.86 percent of voters cast invalid ballots, though (as we will see) many of those invalid ballots may have been intentional.
3.2. Electronic Voting in India
The ECI decided to implement the use of voting machines in national elections in 1999. Forty-five constituencies were selected in 17 states and three union territories. Importantly, these constituencies were not randomly selected. In general, they appear to have been more urban and wealthy than the country as a whole. The treated constituencies included all constituencies in Delhi, all but one constituency in Mumbai, and larger cities in many other states. All other constituencies continued to use paper ballots.
Because of the perceived success of EVMs in this election, the ECI decided to use the machines nationwide from 2004 onwards. In this paper, we focus on three elections: 1998, 1999, and 2004. To review, in 1998 none of the parliamentary constituencies (PCs) had voting machines, in 1999 only 45 PCs did, and in 2004 all PCs used EVMs.
The EVM adopted in India is manufactured by two government-owned companies, Electronics Corporation of India (ECIL) and Bharat Electronics Limited (BEL). It differs considerably from the EVMs in use in the United States, having a much simpler design, with only a basic set of programing instructions hardwired into the circuit board. The units are portable, can operate on battery power, and are (at approximately US $200 a unit) relatively cheap (Wolchok et al., Reference Wolchok, Wustrow, Halderman, Prasad, Kankipati, Sakhamuri, Yagati and Gonggrijp2010). There is space for 16 candidates on each ballot unit. If, for any constituency, there are more than 16 candidates, additional ballot units are linked together. Each polling booth can hold four ballot units and so up to 64 candidates can be accommodated. If there are more than 64 candidates, (a very rare event) then paper ballots are used.
The basic design of the machine includes two main parts, a control unit and a ballot unit. By pressing a button on the control unit, the returning officer authorizes one vote from a particular ballot unit. The voter then presses the button on the ballot unit next to the symbol of their preferred candidate. This choice is then transmitted back to the control unit, where it is stored before the total votes for each booth are read out during the counting process. Using Indian voting machines, overvoting (the casting of multiple votes that invalidate a ballot) is thus impossible, since only the first press of the button is recorded. Undervoting (casting no valid votes for a particular office) also impossible without a cumbersome and public procedure, since the voter cannot leave the booth without the returning officer being aware that she did not cast a ballot.Footnote 3
Indian machines are dramatically simpler than the DRE machines discussed in the American literature, a simplicity made possible by India's one office, first-past-the-post elections. Indian voters only have to press a single button to vote, rather than navigating through the complex set of menus and offices found in some US voting machines. Indian machines also place even higher barriers to invalid voting than American EVMs, which eliminate overvoting but leave open the possibility of intentional or unintentional undervoting.
4. Data and Specifications
The primary data used for this project is a three-year panel (1998, 1999, and 2004) of Lok Sabha elections,Footnote 4 though we will also examine some trends involving earlier and later Lok Sabha elections. There are 543 elected seats in the Lok Sabha, so our sample contains 1629 constituency-year observations. The data is taken from Kollman et al. (Reference Kollman, Hicken, Caramani and Backer2011), and is supplemented by information taken directly from the Election Commission's reports. India had no constituency reapportionment between 1977 and 2004, so the unit of analysis remains constant.Footnote 5
There are obvious difficulties in interpreting even a strong association between the presence of EVMs on political outcomes as causal since “treated” constituency-years are both later in time, and (within years) disproportionately urban and wealthy. For this reason, we use a difference-in-differences design to estimate the causal effect of electronic voting.Footnote 6 The econometric specification is as follows:

where y it is the dependent variable, EVM it is the treatment assignment, δt is a vector of time fixed effects, φi is a vector of constituency fixed effects, and εit is a noise term. Under the assumption that δt is the same for all i (treated or non-treated), the treatment effect is ${\opf E}(y_{it} \vert EVM_{it} = 1) - {\opf E}(y_{it} \vert EVM_{it} = 0) = \beta$ . In the next section, we will discuss in greater detail the assumption that time trends in election dynamics are similar across the two groups.
To further guard against confounding by differing time trends, some models include a set of time-varying controls. These include the proportion of the vote for each of the two largest national parties, the Bharatiya Janata Party (BJP) and the Indian National Congress (INC), the total number of candidates within the constituency, the margin of victory of the winning candidate, and turnout (in models where turnout is not the dependent variable).
A second set of tests uses phase-year fixed effects. In each national election, the ECI divides the constituencies into 4–5 phases, each with its own polling day. This is done to make the task of the ECI easier and to ensure that adequate security measures can be implemented. Altogether, the data from the three elections in our study can be divided into 14 phase years. Disaggregating the data in this fashion allows us to account for confounders specific to particular elections days, such as season, or national news events.
An additional set of tests limits the sample to only urban constituencies, defined as those where the largest district in the constituency had an urban population of more than 40 percent at the 2001 census.Footnote 7 Overall, 27 of the 45 early treatment constituencies met this criterion, as did 57 of the 398 late treatment constituencies. While this approach does not create even quasi-random assignment, it does reduce the observed (and, possibly, unobserved) differences in political trends between the two groups.
As an additional test, we created two subsamples, through two different approaches, to alleviate selection bias concerns. In the first approach, we selected urban pilot constituencies, and all non-pilot urban constituencies that bordered these pilot constituencies. This allowed us to compare constituencies with the EVM pilot to proximate constituencies, with similar urban population rates. This gives us a sample of 27 early treatment constituencies and 21 neighboring constituencies. We also created a matched sample using propensity score matching. The propensity score of being a pilot constituency was calculated with respect to 1998 characteristics, such as turnout rates, vote shares of major parties, the fractionalization of the constituency, the number of candidates, eventual margin of victory, urban population, literacy rate, agricultural labor rate, and unemployment rate. We then used caliper matching on the logit of the propensity score, with an optimal caliper of 0.2 standard deviations of the logit, using the method advocated by Austin (Reference Austin2011), to generate a matched subsample. This subsample contains 27 early treatment constituencies and 27 late treatment constituencies. We also report the results from one-to-one nearest neighbor matching in the appendix.
The unit of observation in our econometric model is the constituency-year and treatment is at the constituency level. There could be potential correlation of error terms across different years for the same constituency. This can lead to inconsistent standard errors. Thus, whenever possible, we account for this problem by clustering standard errors at the constituency level. Clustering at the state-year, or state level generally leads to larger standard errors. Since all core results are robust to either clustering strategy, and because treatment is at the PC level, we report constituency-clustered standard errors. In a few models (noted in the table notes), there are very few observations and clusters and so we report robust standard errors.
5. Results
5.1. Effects on Invalid Voting
The identifying assumption in a difference-in-differences model is that the treatment group and the control group have parallel trends. This means that, absent the intervention, average changes would be the same across the treated and non-treated units. Below, we provide evidence that pre-treatment trends were similar between the treatment and control groups.
Our identifying strategy relies on the fact that while all constituencies used paper ballots in 1998, 45 pilot constituencies used voting machines in 1999. Thus, these 45 pilot constituencies serve as our treatment group, and the rest are grouped as a control. Figure 1 shows over-time trends for invalid voting (calculated as the difference between turnout and the number of valid votes for candidates as a proportion of turnout) for the early-treatment and control groups. The trends tend to move together over time, with the relatively wealthy early-treatment constituencies tending to have lower levels of invalid voting. This evolution is interrupted in 1999, when invalid voting rates fell sharply in the early-treatment constituencies, with no corresponding effect in the control constituencies. These findings are supported by Table A.22, which compares the effect of the intervention in the treatment districts to the lagged and led treatment, which should have no effect. The first column of that table compares the effect on invalid vote rates in the pilot constituencies in the treatment year (1999) versus all other election years. All of the placebo treatments are statistically insignificant, and all are much smaller in magnitude. These results suggest that the parallel-trends assumption is justified for invalid votes.
Pre-trends for invalid vote rate. Notes. The blue solid line plots the average invalid rate in all pilot constituency across election years while the red dashed line plots the average invalid vote rate in non-pilot constituencies. The year 1998 marks the last election before the introduction of EVMs. Thus, 1999 is the first post-treatment year for the pilot constituencies. In the year 2004, the non-pilot constituencies also used EVMs.

Table 1 shows that the introduction of EVMs is associated with a large, statistically significant reduction in the rate of invalid voting. This holds in the baseline OLS regression, the standard difference-in-differences model, the model with controls, and the urban subsample. The substantive size of the coefficient is very high, and the model fit in Column 1 suggests that EVMs explain a large amount of variability in spoiled ballots (46 percent in the bivariate model, 77 percent with the full set of fixed effects). Overall, the rate of invalid voting in India at the constituency level declined from 1.93 percent in 1998 to .04 percent in 2004. In Table A.14, the effect of EVMs is significantly negative even when restricting the sample to the urban geographically proximate constituencies, or constituencies matched on 1998 electoral variables.
Effects of EVMs on invalid vote rates

Standard errors in parentheses + p < 0.10, * p < 0.05, ** p < 0.01, *** p < 0.001
Notes. This table shows the impact of EVMs on invalid vote rates in Lok Sabha electoral constituencies. Column (1) runs a simple OLS model, Column (2) reports the results of a basic diff-in-diff regression with constituency-specific fixed effects and electoral year fixed effects, Column (3) includes time-varying control variables such as the INC vote share, BJP vote share, number of candidates in the constituency, the eventual margin of victory, and turnout rate, Column (4) replaces electoral year fixed effects by phase-year fixed effects. Finally, Column (5) conducts a basic diff-in-diff regression with constituency and year fixed effects on constituencies with more than 40 percent of its population living in urban areas. Standard errors have been clustered by constituency for all models.
These results indicate that EVMs succeed in reducing the rate of invalid voting—in fact, invalid voting appears to have been virtually eliminated. This result stems directly from the design of the machine: Indian EVMs, with their finite menu of buttons, make it almost impossible to cast an invalid ballot, whether deliberately or accidentally.
5.2. Effects on Minor-Party Voting
If voters previously intentionally casting spoilt ballots now cannot do so, they may now wish to cast valid votes in such a way as to protest the political system. However, at least in the late 1990s, there existed no major party that could unambiguously be described as an anti-system party, and thus an attractive target for insurgent party protest votes. At least at the national level, there existed a high degree of ideological agreement between the parties on many issues, with a general tendency toward a “moderate pluralism” that supports the legitimacy of the regime (Sridharan and Varshney, Reference Sridharan and Varshney2001). Moreover, parties have difficulty becoming electorally viable without becoming involved in the system of funding irregularities, violence, over-centralization, and clientelism that might repel a protest voter (Vaishnav, Reference Vaishnav2017). Indian protest voters, then, must vote for small parties, who do not have high chances of winning the election.
We show here that, consistent with insurgent party protest voting, the vote for minor candidates increased in constituencies that used voting machines. We use several measures of a “minor candidate,” all based on a certain threshold of vote share that the candidate managed to gain in the election.Footnote 8 As such, it is an ex post measure of minor candidates.Footnote 9 We ran four different models where we designated candidates that received less than 2.5, 5, 7.5, and 10 percent of votes in the district as minor candidates. We looked at the effects of EVMs on the sum of the vote shares of such candidates. These candidates included independents and candidates of minor local or regional parties. However, the many strong regional party candidates were effectively excluded from the analysis. Note that the average effective number of parties in the 1998, 1999, and 2004 Lok Sabha elections was 2.69, while the average vote share of the candidate coming third in the election was 10.94 percent. Thus, all our measures of minor candidates capture the vote shares of candidates that placed on average worse than third in the election, and most include candidates who are even less relevant.
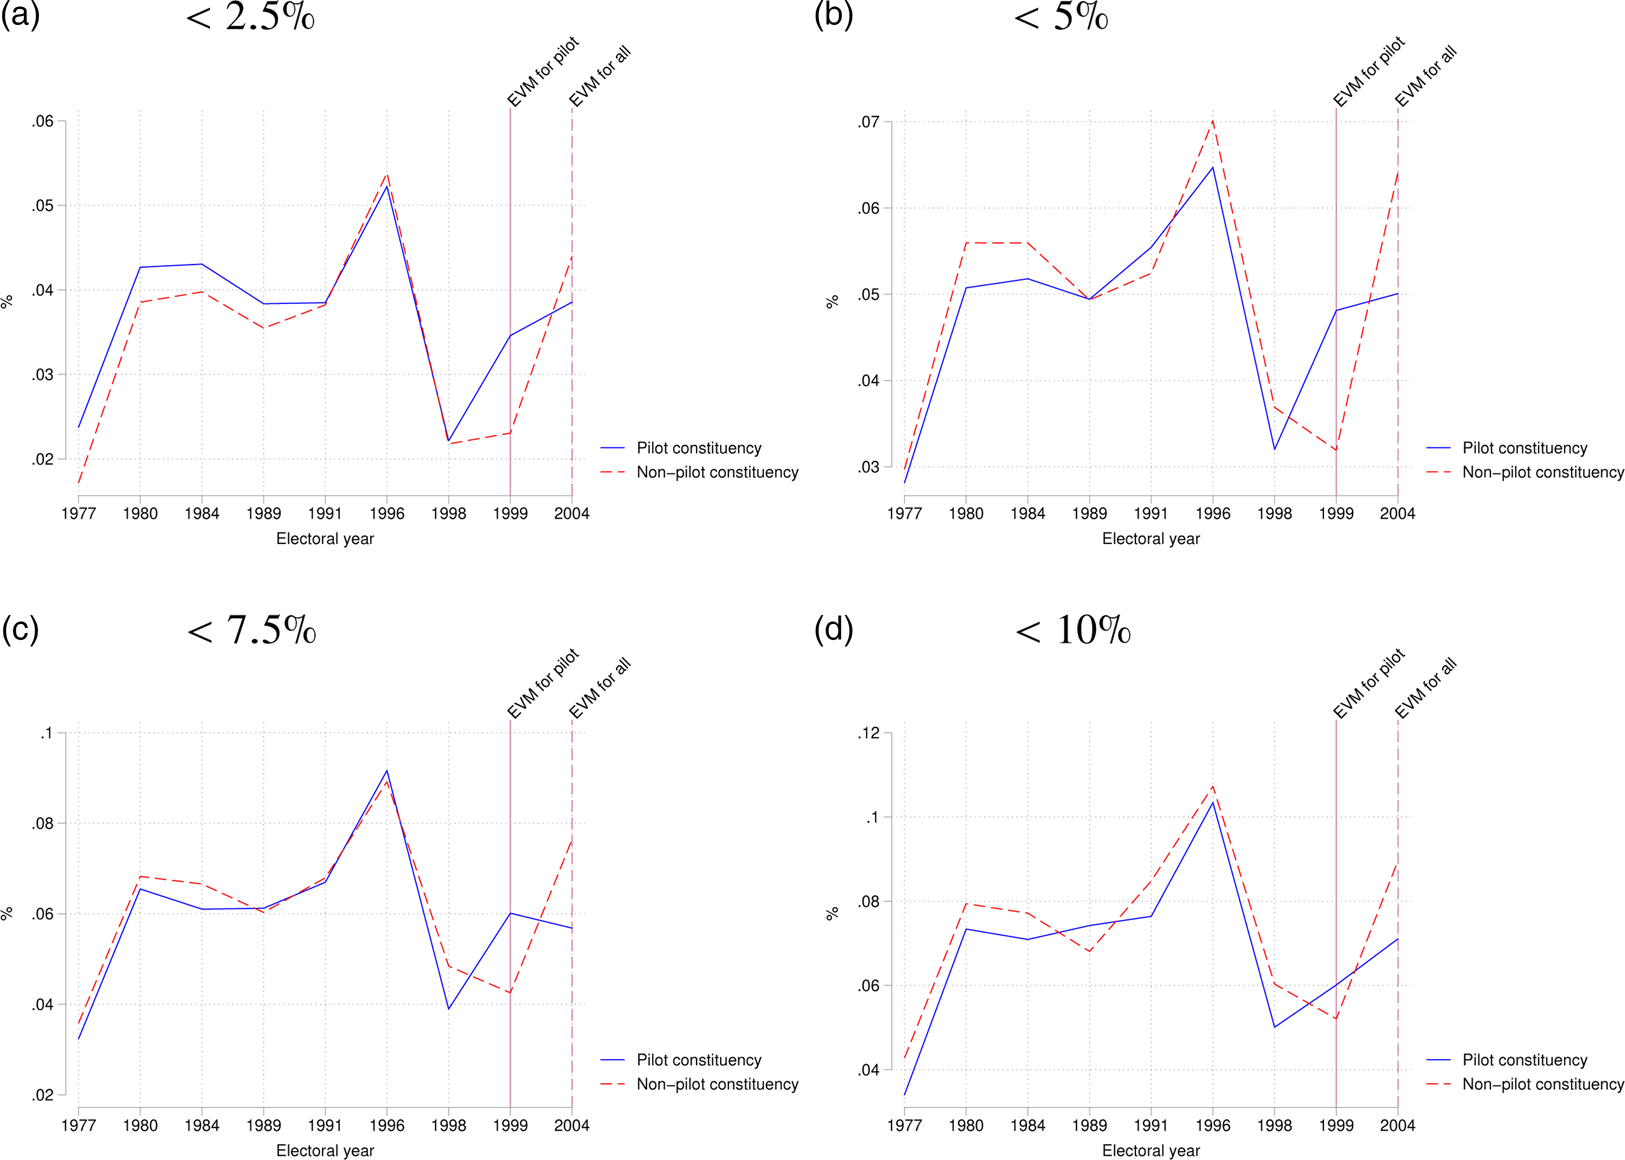
As with other dependent variables, we first present the pre-trends of the early-treatment and control groups. Figure 2 shows how these trends evolved before and after the treatment year in 1999 for all four measures of minor party vote share. All pre-trends appear parallel. The jump in the average minor party vote share in pilot constituencies in the year 1999 is perceptible, as is the jump for the late-treatment constituencies (or the non-pilot constituencies) in 2004, when all constituencies used voting machines. The claim that pilot and non-pilot constituencies had parallel trends with regards to minor-candidate vote shares is further bolstered by the results in Table A.22, where the coefficients on the interaction of pilot constituency and treatment leads are insignificant in all models.
Pre-trends for vote share of “minor parties”. Notes. The blue solid line plots the average summed minor party/candidate vote share (with different thresholds) in all pilot constituencies across election years while the red dashed line plots the average summed minor party/candidate vote shares in non-pilot constituencies. The year 1998 marks the last election before the introduction of EVMs. Thus, 1999 is the first post-treatment year for the pilot constituencies. In the year 2004, the non-pilot constituencies also used EVMs.

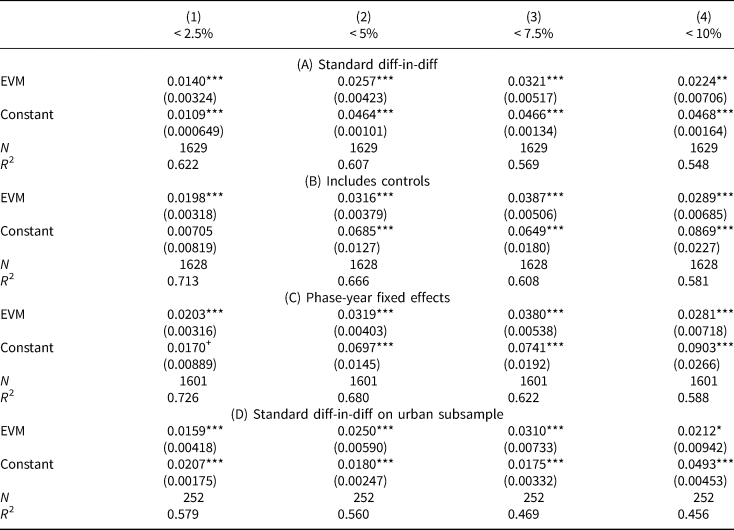
The results of the difference-in-differences analysis are presented in Table 2. Overall, we estimate that EVM introduction was associated with a 1.5–3.5 percentage point increase in the vote share of minor candidates in the Lok Sabha elections. There are four separate panels in the table. The first panel presents the result of the base difference-in-differences analysis of all four models. Every model has a significant positive coefficient on EVM. This positive effect of voting machines on minor party vote shares is robust and remains significant after the addition of control variables, the disaggregating of the data by phase-year, and running the standard difference-in-differences regression (without control variables) on the urban sub-sample. Additionally, Table A.10 looks at the effect of voting machines in the geographically proximate constituency subsample as well as the matched constituency subsample. In both panels, the machines have a positive and significant effect on all minor party vote share variables except for the “< 10%” model. The results in Table A.11 from one-to-one nearest neighbor matching further bolster our results. In Section A.3, we show thata decline in the minor party vote share led to increases in the levels of electoral fragmentation.
Effects of EVMs on Minor party vote shares

Standard errors in parentheses + p < 0.10, * p < 0.05, ** p < 0.01, *** p < 0.001
Notes. Panel (A) conducts a basic diff-in-diff regression for all five measurements of minor candidate vote share on EVM, Panel (B) includes controls, Panel (C) replaces electoral year fixed effects with phase-year fixed effects, and Panel (D) focuses on the urban subsample (without controls). All standard errors have been clustered at the constituency level.
One interesting observation is that the estimated increase in minor party vote associated with EVM introduction in Table 2 is very similar to the estimated decrease in invalid voting associated with voting machine introduction in Table 1. This would imply that the entire decrease in invalid voting was transferred to minor parties, and that most invalid voting in India before 1999 was deliberate and expressive rather than a product of confusion. We should note, however, that these findings suffer from typical problems of ecological inference. The data that we use in our analysis are aggregated at the constituency level. It is thus possible that our results do not reflect individual behavior.
5.3. Voter Confusion as an Alternative Mechanism
One potential interpretation of these results is that they reflect unintentional voting: That is, confused voters vote for each candidate with an equal probability. Since there are many more electorally unviable candidates than there are major candidates in a single member electoral system, these minor candidates gain more vote share, thereby increasing fractionalization as well as votes for minor candidates (and all candidates in general). However, we provide evidence against the purely random voting claim. In Table A.8, we show that voting machines have no effect on the summed vote share of candidates receiving less than 0.5 percent of votes. Furthermore, in Table A.10, which displays the results of a difference-in-differences analysis in the geographically proximate and matched subsamples, we see that the effect of voting machines is focused on candidates who receive less than 7.5 percent of vote share, with the final column, looking at vote shares of candidates receiving less than 10 percent of votes, showing no effect. This is also the case in Table A.11, where one-to-one nearest neighbor matching also suggests that the effects of EVMs are concentrated on candidates who receive less than 7.5 percent of the vote share. Thus, the effect of voting machines is not uniform across the candidates, suggesting that voters may be focusing on a set of minor candidates with some level of name recognition, rather than all names on the ballot.
5.4. Within-Party Results
The consequences of the increase in protest voting can be illustrated for two political parties or groups of parties that might appeal to some groups of protest voters. The BSP was founded upon the grievances of voters from the formerly “untouchable” Scheduled Castes, and is vocal in its belief that other political parties cannot properly represent these voters (Chandra, Reference Chandra2007). Similarly, India's major left wing partiesFootnote 10 are all vocal in their condemnation of the other parties, who they see as tools of global capitalism and rural “feudalism.” These parties' ideologies would thus seem a good fit for the type of anti-establishment views usually associated with protest parties.
However, the nature of these parties differs from state to state. In many states, both the BSP and the left resemble classic protest parties, winning few elections, dispensing no patronage, and depending upon the support of the poor. In the states where they are strongest, however, (Uttar Pradesh for the BSP, and, at the time of study, West Bengal, Kerala, and Tripura for the left) they are the establishment, frequently winning elections and forming the state government. As a consequence, the parties in these areas include many more “normal” office-seeking politicians, win support from a wide variety of social groups, and form mutually profitable relationships with the states' business communities. For these reasons, voters in these states with a grudge against the party system would be unlikely to choose these parties. Thus, our protest-voting hypothesis would imply that the vote share of these parties should increase in states where they are considered to be “minor” and weakly decrease in states where they are competitive.
Table A.3 shows that the effect of voting machines on support for the BSP depends on what state the BSP candidate is competing in. While their vote share decreases in their strongholds in Uttar Pradesh (where they identified with the establishment) it increases in other states (where their rhetoric may qualify the BSP as a protest party). Similarly, Table A.4 also shows that the vote share of a candidate affiliated to a communist party is falling in states where these parties are well-established, and increasing in states where the Communist parties are minor parties. While two out of the four models report insignificant coefficients, the signs on all models are in the expected direction.Footnote 11
5.5. Moderated Effects
If our core hypothesis holds, then invalid votes should translate to votes for minor parties due to the voters' preference for protest voting. While it is difficult to test the assumption that invalid votes served as a tool for protest for Indian voters given the aggregate nature of our data, it is clear that in order for our hypothesis to hold, voting machines should have a greater impact on minor party vote shares where past invalid vote rates were high. That is, minor party vote shares should increase by a higher rate in constituencies that used a voting machine and that had more invalid voting in the pre-electronic voting era.
In order to test this claim, we interact EVM with the 1998 constituency level invalid vote rate. Table A.6 shows that the moderating effect of invalid vote rates in 1998 on the effect of EVMs on minor party vote share is positive. As is evident, the coefficients on the interaction of the invalid vote rate in 1998 and the presence of EVMs in the constituency in the < 5% and < 7.5% models are significant at the 10 percent level, and close to 1. There is thus evidence which suggests that the effect of EVMs on vote share of minor parties was moderated by the past level of invalid rates. This implies that the votes that were previously discarded as invalid are being funneled instead to minor parties.
5.6. Introduction of the “None of the Above” (NOTA) Option
The introduction of EVMs in India effectively ended the possibility for a voter to anonymously participate in the election without voting for any of the candidates on the ballot. With the advent of EVMs, the only way for an invalid vote to be recorded was to inform the clerk in the polling booth of one's intention to do so. The NGO People's Union for Civil Liberties (PUCL) filed a petition in the Supreme Court of India in 2004 advocating the inclusion of an option “None of the Above” (NOTA) for voters who wish to participate in the election but do not want to vote for any candidate on the ballot. In 2013, the Supreme Court of India directed the ECI to add a NOTA button to EVMs, noting that it was important in a democracy to have the right not to vote for any candidate.
The impact of this policy measure is related to our analysis here because NOTA is an effective tool for regularizing protest voting. NOTA voting is essentially an “officially sanctioned” protest vote (Alvarez et al., Reference Alvarez, Kiewiet and Núñez2018). Ujhelyi et al. (Reference Ujhelyi, Chatterjee and Szabó2018) look at the introduction of NOTA in Indian state legislative assembly elections in a structural model of voter demand. They find that while the introduction of NOTA increases turnout, it also reduces the vote share of small “fringe” parties, which often have anti-system campaigns. This ties in with our core hypothesis that invalid votes served as a tool for protest for Indian voters, and the removal of such an option led to a spike in the vote share of minor parties. We consequently look at whether NOTA introduction in the 2014 national Lok Sabha elections also resulted in a decrease of vote shares of minor parties.
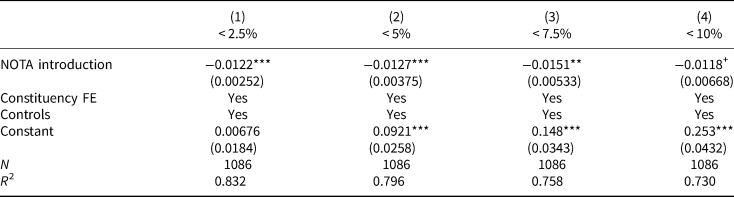
Note that, since the Supreme Court's decision in 2013 meant that every PC included a NOTA option in 2014 elections, we cannot use a difference-in-differences methodology to estimate the effect of NOTA on minor party vote shares. We instead regress our different measures of minor party vote shares on Lok Sabha elections in 2009 and 2014, with a dummy for the year 2014, time-varying controls, as well as constituency fixed effects. The results presented in Table 3 highly suggest that the introduction of NOTA did lead to a reduction in the vote shares of minor parties. Note that the coefficients estimated in Table 3 are very similar to the coefficients estimated in Table 1 which looks at the effect of the introduction of EVMs on invalid vote rates. This would imply that the introduction ofEVMs in 1999 induced the transfer of BNS protest votes to minor or fringe parties, and then to the officially sanctioned NOTA protest voting option after 2014.
Effect of NOTA introduction in 2014 on minor party vote shares

Standard errors in parentheses + p < 0.10, * p < 0.05, ** p < 0.01, *** p < 0.001
Notes. This table shows the impact of the introduction of a NOTA option on the vote share of minor parties in Lok Sabha electoral constituencies. Each column looks at a specific definition of minor party, controls for election-specific variables, and includes constituency fixed effects.
6. Results for Subsidiary Hypotheses
Do voters who previously cast invalid ballots still turn out? In the Indian case, since EVMs make it impossible to cast an invalid ballot, voters who intentionally casted spoiled ballots could now lose their incentive to go to the polls. In Table A.13, we estimate the effects of EVM introduction on turnout, though this estimation is complicated by the fact the turnout date does not show evidence of parallel pre-trends. We find evidence that EVMs are associated with slight reductions in voter turnout, though we are cautious interpreting these results due to the possibility of time-varying confounders. Furthermore, comparison with the matched control group, or with geographically proximate urban constituencies, shows that EVMs did not lead to any change in turnout rates, as summarized in Table A.14.
For reasons of space, our tests of voter confusion, and of variables connected with fraud are discussed in Sections A.4 and A.6 of the online Appendix. To summarize, we find little evidence for any of the various predictions: EVM introduction does not favor candidates placed first or proximate to the eventual winner, EVM introduction is not associated with increases in the vote for state incumbent parties or particular national parties, the effect of voting machines does not differ when the machines are provided with an auditable paper trail, and EVM introduction is not associated with decreased turnout in areas that might be thought to be at risk for fraud.
7. Conclusion
These results show that the switch from paper to electronic voting in India was associated with substantial political effects. Invalid voting was virtually eliminated, with this decline also being associated with an increase in the vote for smaller political parties, often from outside the traditional party system. At the same time, EVMs had modest or null effects on voter error and voter turnout. There is also little evidence that EVMs had an impact on fraud, either for better or for worse. Furthermore, despite fears of partisan or pro-incumbent results, voting machines have no systematic effect on state incumbent party vote shares, or vote shares of specific national parties.
In several respects, these results, particularly the decline of invalid voting, echo the findings of the existing literature. However, they show that this effect represents less of a reduction in votes cast in error than a redirection of protest votes. A fairly constant section of Indian voters are dissatisfied with the Indian political system and wish to cast protest ballots. They do so by casting blank or spoiled ballots before 1998, voting for minor parties when electronic voting was introduced, and then switching to NOTA after the introduction of this option. This type of protest voting appears to be large in magnitude relative to the unintentional casting of invalid or confused ballots. The results thus indicate that the addition of a NOTA option to the machines in 2014 was a step in the right direction, as it provided voters with an avenue to explicitly cast protest votes.
These results suggest that protest votes are fungible across different forms of protest, and that voting technology can transform generalized anti-system sentiment into support for specific candidates. Taken more broadly, the findings suggest that voting technology can have a substantial, and consequential, effect on how anti-system sentiments are expressed within the electoral system.
Supplementary material
To view supplementary material for this article, please visit https://doi.org/10.1017/psrm.2019.51.