Introduction
The oriental armyworm, Mythimna separata (Walker) (Lepidoptera: Noctuidae) is a highly migratory and destructive pest that poses a severe threat to cereal crops across the globe, resulting in substantial yield losses (Behmann et al., Reference Behmann, Mahlein, Rumpf, Römer and Plümer2015; Liu et al., Reference Liu, Shi, Tian, Li, Hao, Wen, Zhang, Wang, Li and Fan2022). Its larvae are particularly notorious for causing extensive damage during sudden and unpredictable population outbreaks, which can overwhelm existing pest management strategies. These outbreaks underscore the urgent need for effective and timely monitoring systems to mitigate potential economic losses (John et al., Reference John, Bankole, Ajayi-Moses, Ijila, Jeje and Patil2023; Zhou et al., Reference Zhou, Arcot, Medina, Bernal, Cisneros-Zevallos and Akbulut2024b).
A key component of such monitoring systems is the accurate identification of larval instars, as this information is crucial for predicting outbreaks dynamics and implementing targeted control measures (Zhou et al., Reference Zhou, Huang, Sun, Chu, Zhang, Qu and Yang2024a). M. separata larvae exhibit stage-specific feeding behaviours and physiological traits that influence the effectiveness of pest control strategies (Lin, Reference Lin1990). For instance, early instar larvae exhibit lower feeding rates and are more vulnerable to biological control (BC) agents, such as ectoparasitic mites (Tian et al., Reference Tian, Wang, Liu, Qiao and Li2020), endoparasitoid (Li et al., Reference Li, Coudron, Pan, Liu, Lu and Zhang2006), and entomopathogenic nematodes (Patil et al., Reference Patil, Vijayakumar, Linga and Sivakumar2020). In contrast, after the third instar, larval feeding rates increase significantly, with fifth and sixth instar larvae entering a voracious feeding phase that can cause severe damage to crops (Lin, Reference Lin1990). These differences underscore the importance of precise larval stages identification for optimizing pest control efforts (Chen et al., Reference Chen, Chen, Guo, Wang and Wang2023; Gao et al., Reference Gao, Xue, Qin, Li, Liu, Zhang and Li2024).
Traditional pest monitoring methods, although widely employed, are time-consuming, error-prone, and require substantial expertise and resources, which limits their applicability in large-scale agricultural operations (Dong et al., Reference Dong, Du, Jiao, Wang, Liu, Teng and Wang2022; Huang et al., Reference Huang, Lan, Thomson, Fang, Hoffmann and Lacey2010; Tian et al., Reference Tian, Wang, Liu, Qiao and Li2020). These limitations underscore the need for automated, high-precision systems to accurately identify larval instars and support precise pest management (Choe et al., Reference Choe, Lee and Yoe2023; Kariyanna and Sowjanya, Reference Kariyanna and Sowjanya2024). Such systems can also support integrated pest management (IPM) programs by enablingstage-specific interventions, including the timely release of BC agents or the application of chemical control methods at optimal developmental windows.
Recent advancements in smart agriculture have facilitated the integration of computational vision and machine learning approaches into pest monitoring, enabling a transformative shift from traditional approaches to automated, data-driven systems (Mishra and Mishra, Reference Mishra, Mishra, Chouhan, Saxena, Singh and Jain2024) For instance, a recent study developed a transfer learning-based image processing model utilizing Convolutional Neural Networks (CNNs) to accurately recognise and distinguish the larval stages of four lepidopteran crop pests, including M. separata (Qin et al., Reference Qin, Abbas, Abbas, Alam, Chen, Hafeez, Ali, Romano and Chen2024). This approach achieved high classification accuracy, demonstrating the potential of deep learning models in automating pest developmental stage identification.
However, while CNNs are particularly effective in extracting visual features from images, making them ideal for functions such as insect growth stage identification such as East Asian migratory locusts (Ye et al., Reference Ye, Lu, Bai and Gu2020), Metisa plana (Walker) (Johari et al., Reference Johari, Khairunniza-Bejo, Shariff, Husin, Masri and Kamarudin2023), they often require large datasets and significant computational resources. In contrast, machine learning models such as Multi-Layer Perceptron (MLP) and Support Vector Machines (SVM) are highly effective for identification tasks in high-dimensional feature spaces, providing robust performance in challenging identification scenarios (Kabir et al., Reference Kabir, Guindo, Chen and Liu2021). For instance, LU and YE (Reference LU and YE2020) employed SVM for instar classification in locusts, while Nurul Afiah Mohd Johari et al. (Reference Nurul Afiah Mohd Johari, Khairunniza-Bejo, Rashid Mohamed Shariff, Azuan Husin, Mazmira Mohd Basri and Kamarudin2022) compared multiple models for M. plana instar identification. Similarly, Xu et al. (Reference Xu, Feng, Tang, Liu, Ding, Lyu, Yao and Yang2022) improved Random Forest (RF)-based classification accuracy for Spodoptera frugiperda instars. These models can be trained with smaller datasets and offer greater interpretability, which is advantageous in agricultural settings where data may be limited.
Despite significant advancements in pest monitoring technologies, several challenges persist. While many methods priorities species identification, they often overlook critical factors such as the differentiation of developmental stages and the prediction of physiological metrics such as larval weight. These aspects are essential for optimizing pest control strategies and ensuring more effective and targeted management (Chen et al., Reference Chen, Chen, Guo, Wang and Wang2023; Gao et al., Reference Gao, Xue, Qin, Li, Liu, Zhang and Li2024). Additionally, most models fail to integrate key features like colour, texture, and weight, which are crucial for capturing pest morphology and tracking instar growth.
This study aims to develop an effective model for accurately identifying the instar stages of M. separata larvae. The approach employs a two-step approach: first, predicting larval weight from image-derived features, and then using weight along with other relevant traits as input for instar classification. By integrating high-resolution imaging with diverse data, this approach captures key morphological and physiological traits critical for tracking larval development. To improve model efficiency and interpretability, permutation-based feature importance analysis was employed, identifying the most influential features for accurate instar identification and providing valuable insights into the factors driving this process.
Materials and methods
A flow diagram outlining the key steps of the study methodology was presented in fig. 1.
Flow Diagram of the framework for Mythimna separata larval instar identification.

Insects rearing
The Mythimna separata (Walker) (Lepidoptera: Noctuidae) larvae were collected from the Pest Monitoring Laboratory at Jilin Agricultural University (125.39°E, 43.817°N). A total of 200 larvae were maintained under controlled environmental conditions (temperatures: 20–32°C; relative humidity: 40–70%). The larvae were reared on maize leaves (variety Yudi 871) throughout the experiment, with fresh leaves provided daily to ensure optimal nutrition. Each larva was housed individually in a 40 mL food-grade plastic container (Xinyi Eco-Friendly Catering Supplies, Shandong, China). To prevent escape and ensure isolation, the containers were lined with oviposition paper (Fanqi Flagship Store, Guangdong, China). The containers were equipped with eight ventilation holes (3 mm in diameter) for proper airflow and humidity control, while the oviposition paper was perforated with 30 smaller holes (0.5 mm in diameter) to facilitate controlled air exchange. Molting events were monitored daily at 13:00, with images captured whenever molting occurred. Larvae were weighed using an electronic balance (Model BSA223S; Sartorius, Germany; precision: 0.001 g) to track their growth and development.
Image acquisition system and feature extraction
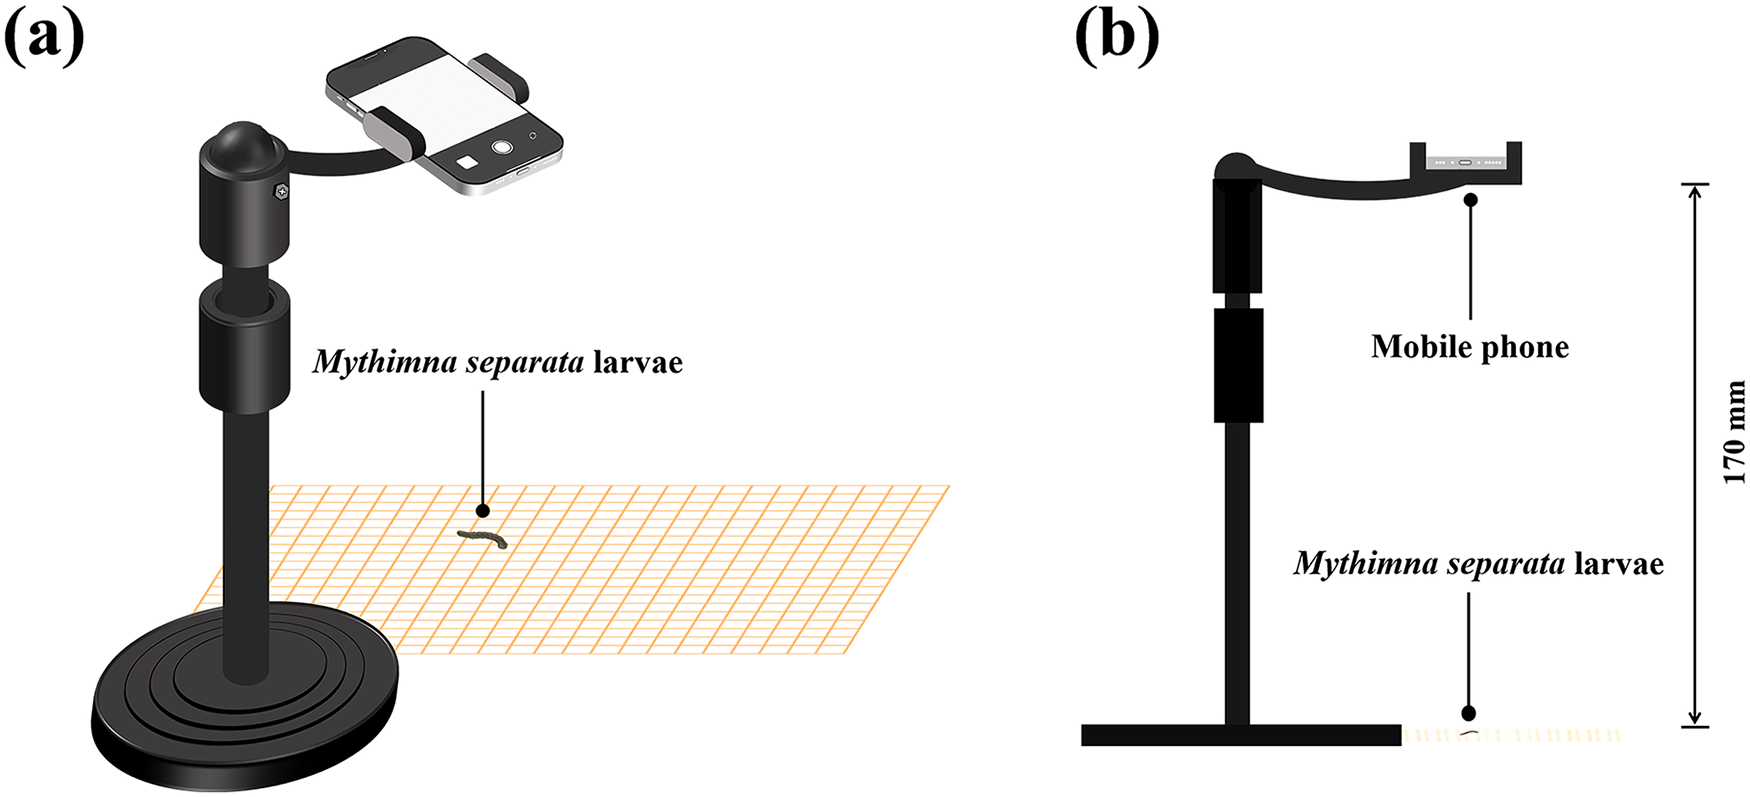
The image acquisition system included an iPhone 12 (Apple Inc., Cupertino, United States) equipped with a dual 12MP camera system. The smartphone was mounted on a stand stable with an adjustable height (base height: 27 cm, Zhilichuanglian Digital Specialty Store, Guangdong, China), fixed at a distance of 170 mm from the larvae. A grid paper (25 × 35 cm, Tuosen Optimal Stationery Store, Guangdong, China) was placed beneath the larvae to serve as a reference (fig. 2). Images were captured under natural light, to ensure consistent illumination, with the camera aligned parallel to the larvae for uniform focus.
Setup for image acquisition of Mythimna separata larvae: (a) overall structural layout, illustrating the components and arrangement of the system; (b) front view highlighting the positioning of the larva and the imaging apparatus.

A total of 1,577 images were collected across five instars: 2nd instar (323 images), 3rd instar (323 images), 4th instar (313 images), 5th instar (307 images), and 6th instar (311 images). Each larval region in the images was manually annotated using Labelme software (version 4.1.5). Twelve primary features were extracted from these annotated regions: (1) geometric features: area, perimeter, length, and width, with the formulas for length and width provided in the Supplementary Material; (2) colour features: mean hue, saturation, and value; and (3) texture features: energy, inertia, homogeneity, correlation, entropy, and inverse difference moment (IDM). Texture features were calculated using the Gray Level Co-occurrence Matrix method, with a pixel distance of 1 and angles of 0°, 45°, 90°, and 135°.
Data pre-processing
First, the dataset underwent preprocessing to ensure consistency and improve model performance. The steps included:
(1) Outlier Removal: Outliers were identified and removed using the 3-sigma rule (Equation 1). Any data point exceeding three standard deviations from the mean was excluded to minimise the influence of extreme values.
 \begin{equation}{{X}_{{outlier}}}{ = }\;\left| {{x - \mu }} \right|{ \gt 3\sigma }\end{equation}
where X denotes the feature value, and μ and σ represent the mean and standard deviation of the training dataset, respectively.
(2) Normalization: After outlier removal, the remaining dataset (1,496 images) underwent z-score normalization (Equation 2) to standardise feature distributions across different scales. This ensured that all features contribute equally to model training and preventing bias towards features with larger numerical ranges.
 \begin{equation}{z = }\;\frac{{{x - \mu }}}{{\sigma }}\end{equation}
where x is the feature value, with μ and σ as the dataset’s mean and standard deviation, respectively.
(3) Transformation: For weight data, a natural logarithmic transformation was applied to reduce skewness and stabilise variance, thereby improving feature scaling and enhancing model fit, particularly for algorithms sensitive to non-normal distributions.
Larval weight prediction model training and evaluation
Given that larval weight is essential for instar identification but cannot be extracted directly from images, we developed a predictive model to estimate larval weight using image-derived features. A total of 13 models, including linear, tree-based, ensemble, and neural network approaches, were constructed and tested. The dataset was randomly split into a training set (80%; 1,196 images) and a testing set (20%; 300 images). Hyperparameter tuning was performed using grid search to identify optimal parameter settings, and the model’s performance was evaluated through 10-fold cross-validation. The performance metrics used were coefficient of determination (R 2), root mean squared error (RMSE), mean absolute error (MAE), and mean absolute percentage error (MAPE) (Equations 3-6).
 \begin{equation}{{R}^{2}}{ = 1 - }\frac{{\sum\limits_{{i = 1}}^{n} {{{\left( {{{y}_{i}}{ - }{{{\hat y}}_{i}}} \right)}^{2}}} }}{{\sum\limits_{{i = 1}}^{n} {{{\left( {{{y}_{i}}{ - }{{{\bar y}}_{i}}} \right)}^{2}}} }}\end{equation}
 \begin{equation}{RMSE = }\sqrt {\frac{{1}}{{n}}\sum\limits_{{i = 1}}^{n} {{{\left( {{{y}_{i}}{ - }{{{\hat y}}_{i}}} \right)}^{2}}} } \end{equation}
 \begin{equation}{MAE = }\frac{{1}}{{n}}\sum\limits_{{i = 1}}^{n} {\left| {{{y}_{i}}{ - }{{{\hat y}}_{i}}} \right|} \end{equation}
 \begin{equation}{MAPE = }\frac{{1}}{{n}}\sum\limits_{i = 1}^n {\left| {\frac{{{{y}_{i}}{ - }{{{\hat y}}_{i}}}}{{{{y}_{i}}}}} \right|} \end{equation}
where n represents the total sample size, yi denotes the observed larval weight, and ŷi represents the predicted larval weight.
Larval instar identification model
After predicting the weight of each larva using the trained weight prediction model (applied to all 1,496 larvae, including the training subset), we incorporated the predicted weight as an additional feature into the feature set for larval instar identification, maintaining strict separation between training and testing data streams. The expanded feature set was then used to train a machine learning model to identify the instar of each larva.
Dataset and feature set
The dataset was divided into training and testing subsets at a ratio of 80:20, consistent with the setup used for the weight prediction model. The impact of the predicted weight on the identification performance was evaluated by comparing three conditions: (1) excluding weight as a feature, (2) using actual weight, and (3) incorporating predicted weight.
Identification models
A total of three models were applied for larval instar identification, including Support Vector Classifier (SVC), RF Classifier, and MLP. SVC is effective for handling high-dimensional feature spaces, RF is known for its robustness and interpretability, and MLP is capable of capturing non-linear relationships. Hyperparameters for each model were optimised using grid search, and 10-fold cross-validation was employed to evaluate generalization performance.
Model evaluation
Identification performance was evaluated using four metrics: accuracy, precision, recall, and F1-score (Equations 7-10).
 \begin{equation}{accuracy = }\frac{{{TP + TN}}}{{{TP + FP + TN + FN}}}\end{equation}
 \begin{equation}{precision = }\frac{{{TP}}}{{{TP + FP}}}\end{equation}
 \begin{equation}{recall = }\frac{{{TP}}}{{{TP + FN}}}\end{equation}
 \begin{equation}{F1 - }{\text{s}}{core = }\frac{{{2} \times {precision} \times {recall}}}{{{precision + recall}}}\end{equation}
where TP (True Positive): The model correctly identified a sample as belonging to the target category (positive) when it actually does belong. TN (True Negative): The model correctly identified a sample as not belonging to the target category (negative) when it actually does not belong. FP (False Positive): The model incorrectly predicts a sample as belonging to the target category (positive) when it actually does not belong. FN (False Negative): The model incorrectly predicts a sample as not belonging to the target category (negative) when it actually does belong.
Feature importance analysis
To evaluate the contribution of each feature in the instar identification model, we employed Permutation Feature Importance (PFI) and SHapley Additive Explanations (SHAP). PFI evaluates feature importance by measuring the performance drop when a feature’s values are randomly shuffled, breaking its relationship with the target variable. This method provides an unbiased evaluation of feature impact on model performance, unlike model-based methods that may favour features with high cardinality. In addition, we incorporated SHAP analysis to further interpret feature contributions at both the global and individual levels. SHAP assigns each feature an importance value based on game-theoretic principles, offering insights into how each feature influences the model’s predictions.
Results
Performance of the models for larval weight prediction
Model accuracy was assessed using four key metrics: R 2, RMSE, MAE, and MAPE (table 1). The BaggingRegressor demonstrated the highest predictive accuracy, with an R 2 of 98.20% and an RMSE value of 0.2313. Other ensemble models, such as the GradientBoostingRegressor (R 2 = 98.15%) and RandomForestRegressor (R 2 = 98.08%), also performed well. Additionally, models including KNeighborsRegressor and DecisionTreeRegressor yielded R 2 values exceeding 97% and RMSE values below 0.30.
Weight regression predict models’ performance of Mythimna separata larval in terms of R 2, RMSE, MAE and MAPE

In contrast, linear models, including BayesianRidge, LinearRegression, and Lasso demonstrated lower performance (R 2: 93.99%, 93.53%, and 93.25%) and higher RMSE values (0.4221, 0.4380, and 0.4473). These results suggested that simpler linear models were less effective at capturing the complexity of features in the dataset compared to ensemble or non-linear models.
To evaluate potential overfitting, we analysed the generalization gap between training and test performance (table 1). For instance, the BaggingRegressor showed a minimal R 2 gap of 0.35% (training: 98.20%; test: 97.85%), indicating good generalization. Similarly, ensemble methods like RandomForestRegressor maintained stable RMSE values across datasets (training: 0.24; test: 0.26).
Impact of predicted weight on larval instar identification
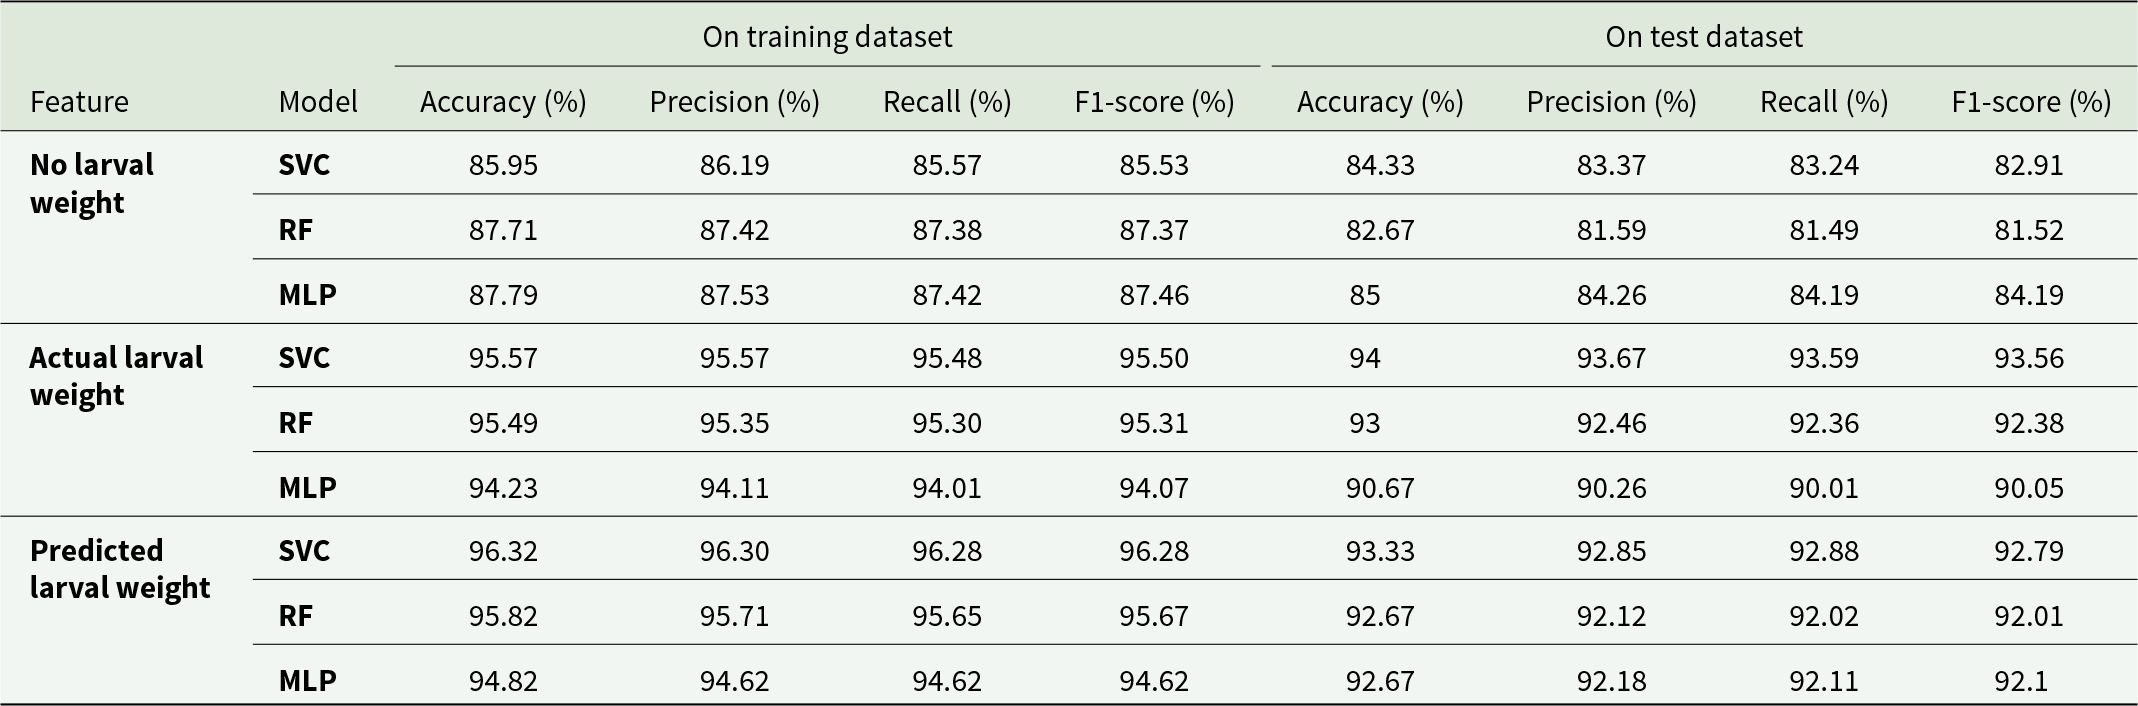
The weight as a feature enhanced identification performance across all models (table 2), and seem to be a significant morphological indicator that correlates well with larval instars. Therefore, the models were better to distinguish subtle variations in instars.
Larval instar identification models’ performance of Mythimna separata across different datasets: (a) accuracy; (b) precision; (c) recall; (d) F1-score

For the SVC, accuracy improved from 84.33% (without larval weight) to 94% (with larval actual weight). With predicted weight, accuracy reached 93.33%, showing a 9% improvement. Similarly, MLP accuracy rose from 85% (without larval weight) to 90.67% (with actual larval weight), and reached 92.67% (with predicted larval weight). Notably, the RF showed the largest gain (10% improvement), with accuracy increasing from 82.67% (without larval weight) to 92.67% (with predicted larval weight) (table 2). Precision followed a similar trend. The SVC’s precision rose from 83.37% (without weight) to 93.67% (with actual weight), and reached 92.85% (with predicted weight). Comparable enhancements were observed for RF and MLP, with the SVC achieving the highest precision of 93.67% (with actual weight). Recall and F1-score mirrored these trends, with the SVC achieving recall and F1-score of 93.59% and 93.56% (with actual weight) (table 2).
To assess potential overfitting, we compared training and test performance across all conditions (table 2). Models without larval weight exhibited training-test accuracy gaps (RF: 5.04%; SVC: 1.62%). Incorporating actual weight sharply reduced gaps (RF: 2.49%, SVC: 1.57%), while predicted weight maintained near-optimal generalization (MLP: 2.15%). Learning curves were also generated.
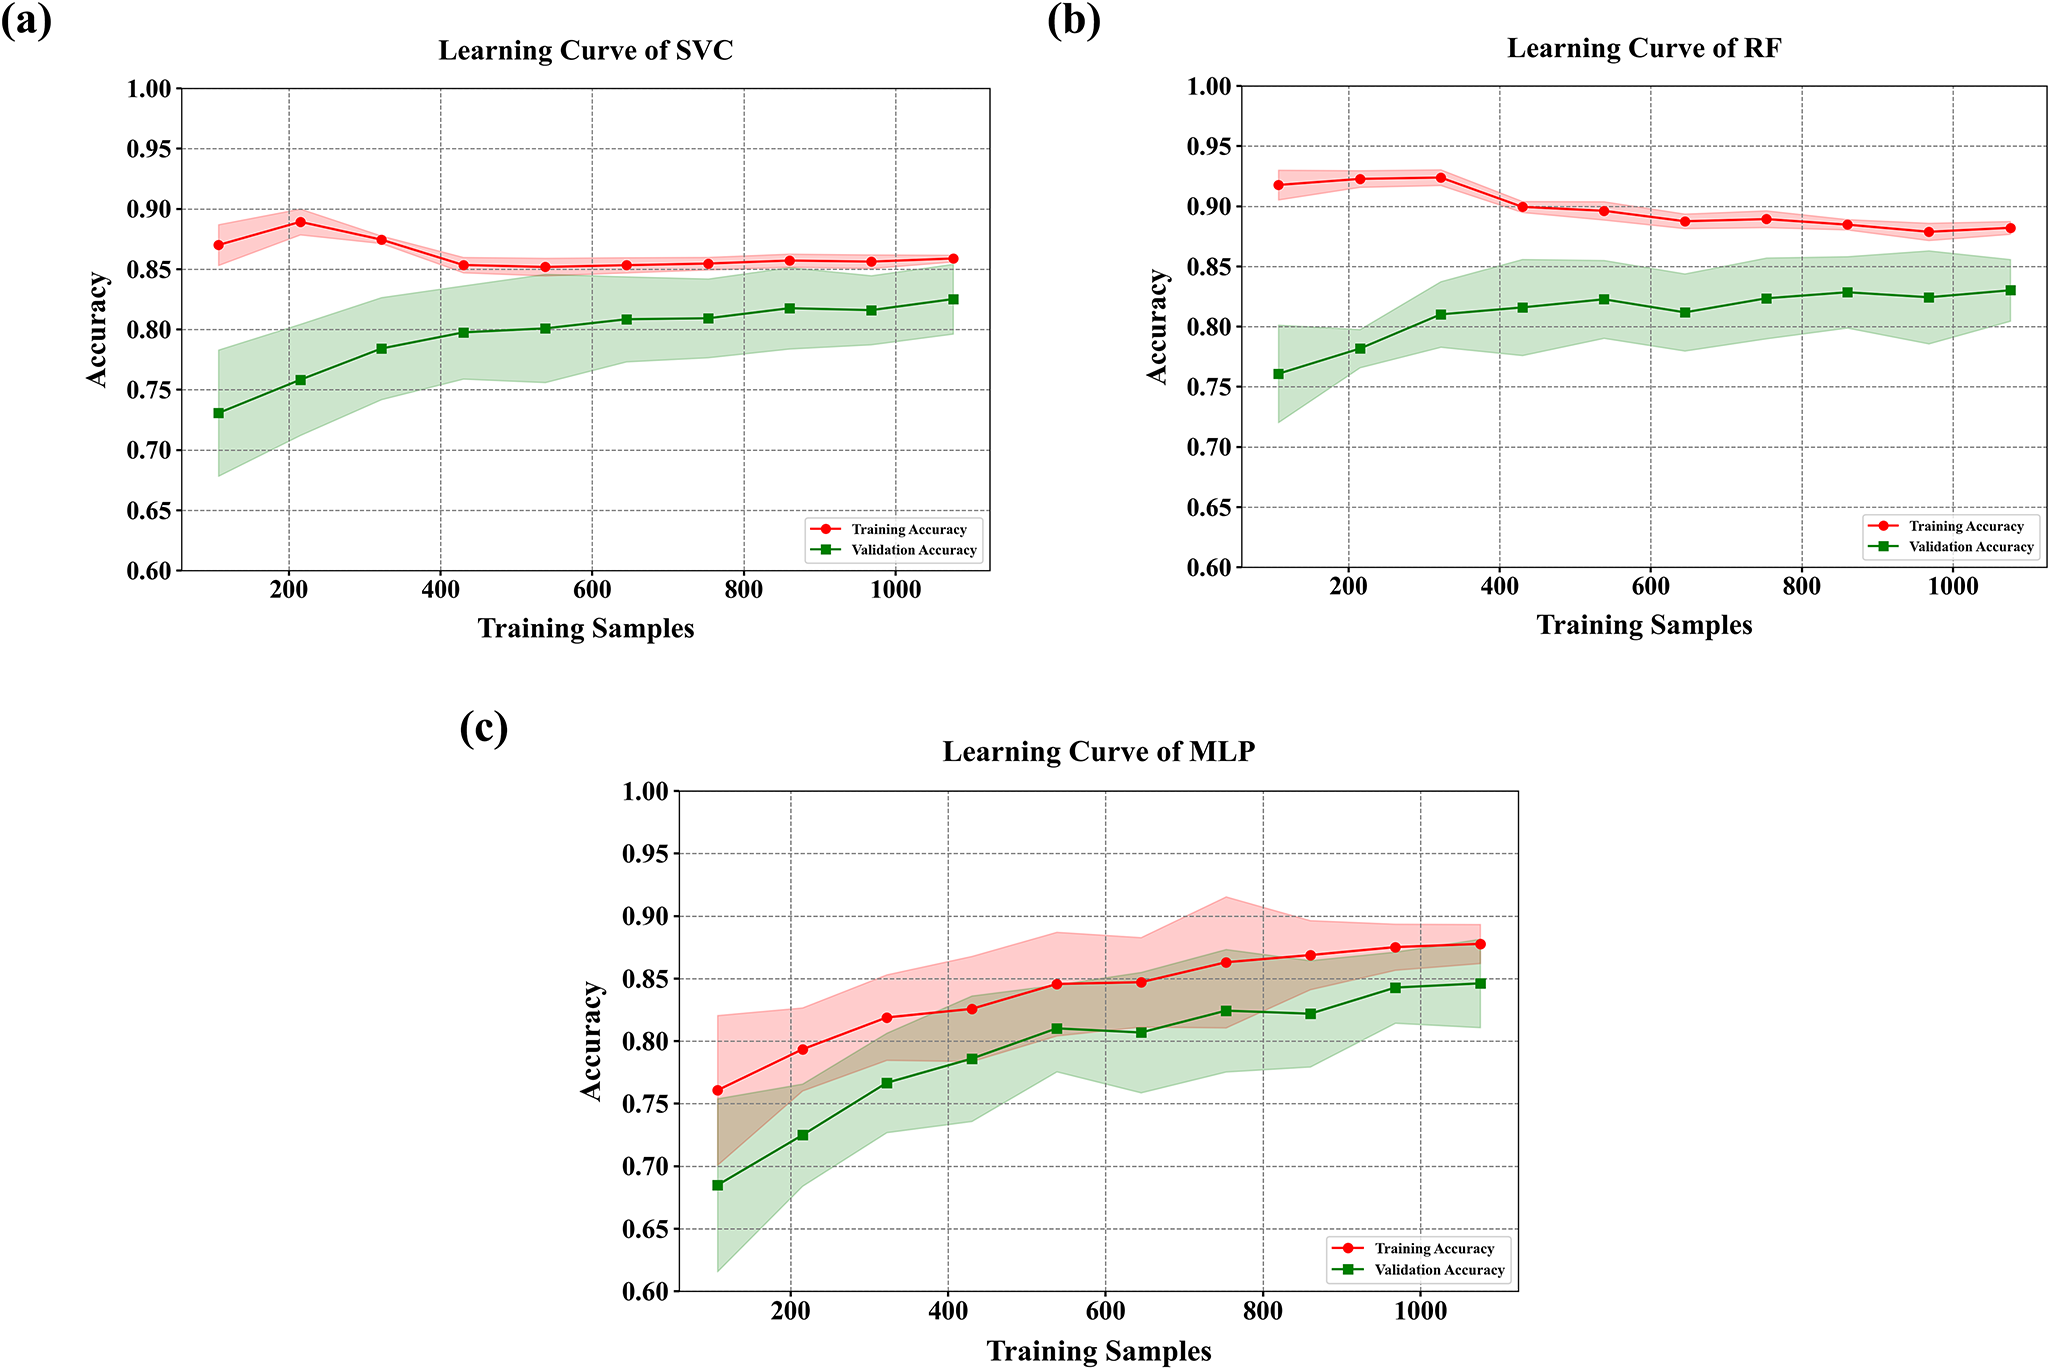
When the models were trained without weight, validation accuracy remained low despite improvements in training accuracy, indicating limited generalization (fig. 3). The incorporation of predicted weight improved model stability, reducing the discrepancy between training and validation accuracies (fig. 4). Incorporating actual weight resulted in the best performance, with training and validation curves closely aligned (fig. 5).
Training and validation learning curves for larval instar identification without larval weight: (a) SVC, (b) RF, (c) MLP.

Training and validation learning curves for larval instar identification incorporating larval actual weight: (a) SVC, (b) RF, (c) MLP.

Training and validation learning curves for larval instar identification incorporating larval predicted weight: (a) SVC, (b) RF, (c) MLP.

Larval instar identification model performance
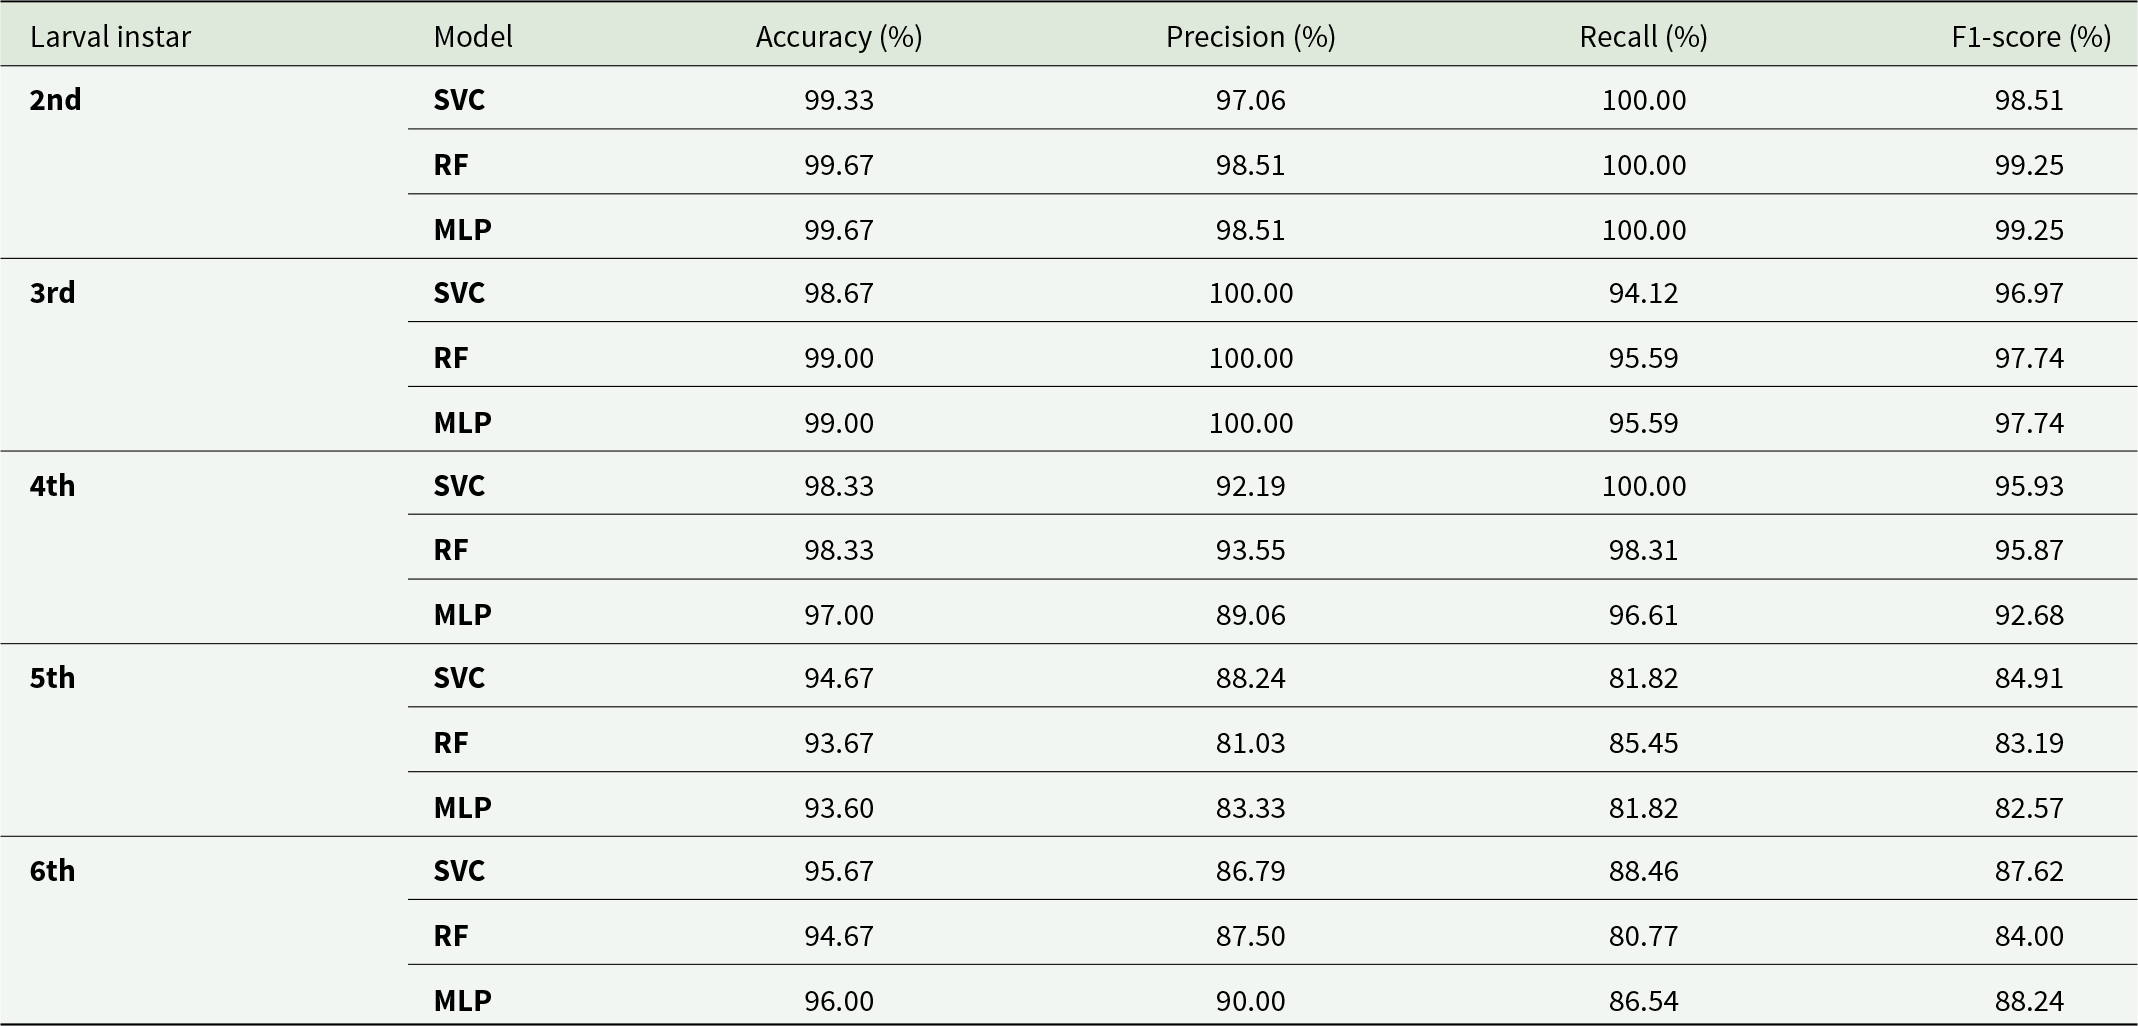
In the 2nd instar, RF achieved 100% recall. However, its accuracy declined with the instar increased (4th: 98.33%; 5th: 93.67%; 6th: 94.67%). Precision in the 5th instar was notably low at 81.03% (table 3). The SVC model showed relatively stable performance across all instars in terms of accuracies (2nd: 99.33%, 3rd: 98.67%) and decreased in the 5th and 6th instars, with recall dropping to 81.82% in the 5th instar and achieving an F1-score of 87.62% in the 6th instar (table 3). The MLP demonstrated consistent performance across all instar, achieving 99.67% accuracy in the 2nd instar and maintaining high accuracy at 96.00% in the 6th instar (table 3).
Comparison of Mythimna separata larval instar identification models’ performance with predicted larval weight as a feature: (a) accuracy; (b) precision; (c) recall; (d) F1-score

Confusion matrix for Mythimna separata larval instar identification models using predicted larval weight as a feature: (a) SVC; (b) RF; (c) MLP.

Feature importance analysis of the SVC model for Mythimna separata larval instar identification (including predicted larval weight): (a) permutation importance; (b) SHAP values.

To evaluate model performance in detail, confusion matrices were generated for each model at different instar (fig. 6). The SVC showed high accuracy for the 2nd to 4th instars with minimal errors. However, for the 5th instar, 7 samples were incorrectly classified as the 6th instar (fig. 6a). The RF performed well in the 2nd and 3rd instars but showed more errors in the later stages. For the 5th instar, 2 samples were misidentified as the 4th instar and 6 as the 6th instar. In the 6th instar, 10 samples were incorrectly identified as the 5th instar (fig. 6b). Similarly, the MLP achieved good accuracy for the 2nd and 3rd instars, but errors increased in the 5th and 6th instars. In the 5th instar, 5 samples were misidentified as the 6th instar, while in the 6th instar, 7 samples were misidentified as the 5th instar (fig. 6c).
Feature importance analysis
Both PFI and SHAP were used to assess the contribution of each feature in predicting larval instar. Consistently, predicted larval weight emerged as the most influential feature in both analyses, with an importance score of 0.5454 in PFI and 0.5798 in SHAP, highlighting its critical role in developmental stage classification (fig. 7).
Among morphological and texture-based features, width (0.157 in PFI, 0.1799 in SHAP), IDM (0.1268 in PFI, 0.1337 in SHAP), and energy (0.1266 in PFI, 0.1332 in SHAP) ranked highly in both methods. Homogeneity (0.0612 in PFI, 0.045 in SHAP) exhibited moderate contributions. Features like average hue and length consistently ranked as the least influential in both methods (fig. 7).
Discussion
An accurate instar-based identification process is likely expected to contribute IPMs, especially, BC programs. Inundative release of BC agents such as parasitoids and entomopathogenic organisms such as those that target specific larval stages at specific target sites via automated systems (AI-based sprayers) could benefit from outcomes of innovative artificial intelligence systems. In order to provide insights into developmental attempts in such system that could be employed in outdoor conditions, we developed a two-step feature construction to address scenarios where direct feature acquisition is limited. First, we predicted weight of M. separata larvae using image-derived features. We then integrated the predicted weight into the feature set for larval instars. This two-step approach significantly enhanced the model’s performance, leading to improved identification accuracy.
For instance, the accuracy of RF model improved from 82.67% (without weight) to 92.67% (with the predicted weight), highlighting the critical role of weight as a developmental indicator. This approach not only reduces the need for direct manual measurements, minimizing potential stress on the larvae, but also enhances the flexibility of data collection and the reproducibility of experiments.
In the process of weight prediction, ensemble models such as the BaggingRegressor and GradientBoostingRegressor performed exceptionally well, achieving high R 2 values (0.9820, 0.9815) and low RMSE values (0.2313, 0.2341). These results demonstrate that ensemble models effectively capture the complex, nonlinear relationships among features by combining multiple weak learners, making them particularly suitable for biological data analysis (Benkwitz-Bedford et al., Reference Benkwitz-Bedford, Palm, Demirtas, Mustonen, Farewell, Warringer, Parts and Moradigaravand2021; Moradigaravand et al., Reference Moradigaravand, Li, Dechesne, Nesme, de la Cruz, Ahmad, Banzhaf, Sørensen, Smets and Kreft2023). In contrast, simpler linear models (LinearRegression and BayesianRidge), exhibited relatively lower performance, indicating their limitations in handling the complex nonlinear patterns in larval weight prediction (Duan et al., Reference Duan, Dai, Shi, Cheng, Ge, Chang, Liu, Wang, Shi and Hu2024; Salimi et al., Reference Salimi, Rostami, Moormann and Delisio2016; Saqib, Reference Saqib2021). Thus, ensemble learning is highly promising as a more appropriate approach for modelling that employ intricate biological characteristics inherent in larval instars.
Our results consistently identified predicted weight as the most influential factor in larval instar classification, underscoring its biological significance as a key indicator of development. Both PFI and SHAP analyses ranked predicted weight highest, reinforcing its essential role, even when indirectly estimated from images. Among morphological traits, width remained the second most important feature, with SHAP assigning it a slightly higher importance score than PFI, indicating its strong contribution to classification. Texture-based features, particularly IDM and energy, also played significant roles, ranking closely in both methods and supporting classification, especially in intermediate instars where size-based features alone may be insufficient. Notably, entropy exhibited a higher importance score in SHAP compared to PFI, suggesting its potential relevance in capturing fine-scale texture variations. In contrast, correlation and average hue were consistently assigned low importance across both methods, indicating their minimal contribution to instar differentiation.
Compared to traditional manual measurement methods, the machine learning-based automated approach in this study demonstrated significant efficiency advantages. Using image-derived features for predicting weight and identifying instar reduced dependency on manual operations, decreased the likelihood of human error, and enhanced data processing efficiency. This approach is particularly suitable for large-scale larval studies and field monitoring, enabling reliable data collection without disturbing the natural state of the larvae (Gomes and Borges, Reference Gomes and Borges2022). With its ability to streamline data collection and analysis, this methodology holds substantial potential for applications in agricultural pest management and ecological research (Li et al., Reference Li, Zheng, Yang, Li, Sun and Yang2021; Ong et al., Reference Ong, Ahmad and Majid2021).
Building on these strengths, this methodology could also be refined for practical use in BC and chemical insecticide programs under field conditions. For example, early instar larvae, which are more susceptible to BC agents such as entomopathogenic nematodes and parasitoids, could be targeted using this approach to determine optimal release timings and locations. By integrating this methodology with BC agent release programs, pest suppression efficiency could be significantly improved, especially when targeting vulnerable larval stages (Patil et al., Reference Patil, Vijayakumar, Linga and Sivakumar2020; Tian et al., Reference Tian, Wang, Liu, Qiao and Li2020). Similarly, for chemical insecticide application, precise instar identification could optimise the timing of interventions. Second and third instar larvae, representing the most effective stages for chemical control in M. separata (Lin, Reference Lin1990), could be targeted to reduce crop damage and improve control efficiency. This approach minimises environmental impact and chemical usage while enhancing cost efficiency.
While the models in this study performed well for weight prediction and instar identification, there remains room for improvement. One limitation is that the weight prediction model relies solely on image-derived features, making it susceptible to variations in lighting conditions and background noise. Future work could focus on optimizing the weight prediction model to reduce errors and improve overall identification performance. Additionally, exploring more advanced feature extraction techniques, such as deep learning to capture intricate, high-dimensional image features and further enhance predictive accuracy (Majewski et al., Reference Majewski, Zapotoczny, Lampa, Burduk and Reiner2022). Incorporating environmental factors, such as temperature and humidity, which influence larval growth and development, could improve the model’s robustness and applicability.
Conclusion
This study provides a novel two-step approach for identifying the instar of M. separata larvae. By incorporating predicted weight as an indirect feature in the identification process, the accuracy of instar classification was significantly improved. This approach enhances identification precision, reduces manual effort, and ensures greater consistency in data collection. The findings demonstrate the potential of this methodology to streamline larval monitoring and offer a reliable, automated solution for pest management studies. Future advancements could involve incorporating real-time data acquisition and more sophisticated machine learning algorithms, paving the way for dynamic and fully automated pest management systems.
Supplementary material
The supplementary material for this article can be found at https://doi.org/10.1017/S000748532500029X.
Acknowledgements
This research was supported by the Jilin Provincial Department of Science and Technology of China (grant number: 20220203198SF) and the Ministry of Science and Technology of China (grant number: 2022YFD1500701).
Competing interest
None.