For close to three decades, political scientists have developed models to forecast election outcomes. Until now, forecasting work has mostly been limited to advanced industrial democracies, and the bulk of existing studies have focused on the United States, the United Kingdom, and France (for a recent review, see Lewis-Beck Reference Lewis-Beck2005). One country that has not received much attention to date is Canada. Currently, only one preliminary effort has been made to forecast Canadian federal election outcomes based on a vote function model, which was developed by Bélanger and Godbout (Reference Bélanger and Godbout2000; Reference Bélanger and Godbout2004; Reference Bélanger and Godbout2006). The primary objective of the following analysis is to flesh out and expand this preliminary model into a workable forecasting tool that could easily be replicated and tested in future federal elections.
In this study, we argue that it is possible to construct a valid vote function model to forecast Canadian elections for two reasons. First, such models have previously been successful in predicting the election outcomes of other Westminster-style parliamentary systems such as that of the United Kingdom (e.g., Mughan Reference Mughan1987; Bélanger, Lewis-Beck, and Nadeau Reference Bélanger, Lewis-Beck and Nadeau2005) and Australia (e.g., Jackman and Marks Reference Jackman and Marks1994; Wolfers and Leigh Reference Wolfers and Leigh2002). Since Canada's political system has important similarities with these countries, we believe that a vote function model can potentially offer forecasts for Canada that are at least as reliable as those of the United Kingdom or Australia.
Second, existing vote function studies have shown a strong link between macroeconomic conditions—mostly unemployment—and aggregate-level federal election outcomes in Canada (e.g., Happy Reference Happy1992; Nadeau and Blais Reference Nadeau and Blais1993; Nadeau and Blais Reference Nadeau and Blais1995; Gélineau and Bélanger Reference Gélineau and Bélanger2005). Because forecasting models usually include an economic variable to predict election results, we can also reasonably expect that the economy will be an important predictor of federal election outcomes in Canada.
In this study, we set out to demonstrate the validity of these claims. The article is divided into three sections. We begin by briefly reviewing the literature on forecasting and Canadian elections. We then present the data and the model used in this analysis, and explore different strategies that we believe could be used to improve our forecasting model. Finally, in the conclusion, we offer a forecast for what would have been the fall 2009 election, had the Liberal opposition been able to overthrow the government with a motion of no-confidence.
THE SCIENTIFIC FORECASTING OF CANADIAN FEDERAL ELECTIONS
Apart from satisfying—if only imperfectly—our natural curiosity about which party is going to win the next election and govern the nation for the next few years, the forecasting of elections is useful from a scientific point of view. Indeed, it offers a stringent test of some of political science's many theories about voting behavior. If political scientists are able to identify variables that explain past election outcomes, then we should expect these same variables to be able to predict future elections with some level of accuracy, as long as the values of these variables are known in advance (Lewis-Beck and Rice Reference Lewis-Beck and Rice1992; Campbell Reference Campbell2008a). Forecasting models also provide “a baseline from which to evaluate the effects of the particular events that occur in every campaign” (Campbell and Garand Reference Campbell and Garand2000, 11). That is, they offer a plausible estimate of an upcoming election's outcome based on patterns observed in past elections. To the extent that the outcome deviates from that historical pattern, this aberration can teach us something about campaign effects or a particular election's unique character. In that sense, election forecasting models do not deny that electoral campaigns matter. They simply assume that the role of campaigns is mainly to inform voters and help them evaluate both the incumbent's performance and the available alternatives. These models also generally assume that the candidates will run comparably good campaigns (see Gelman and King Reference Gelman and King1993; Holbrook Reference Holbrook1996).
As we noted earlier, the majority of forecasting work has been limited to a small number of advanced industrial democracies such as the United States, the United Kingdom, and France. Unfortunately, virtually no scholarly work has been done on forecasting national elections in Canada. In recent years, a number of Canadian bloggers have started offering their votes and seat projections before and during election campaigns.Footnote 1 But most of these forecasts are based on published commercial polls, not on any theoretical assumptions about voting behavior. Furthermore, these pundits generally do not disclose the methodology used to arrive at their projections.Footnote 2 The contrast between the scarcity of theoretically grounded, methodologically transparent forecasting models in Canada and the abundance of such models in other major democracies is striking.
Over the past few years, we have developed a preliminary vote function model to forecast the outcomes of the 2000, 2004, and 2006 federal elections. Our forecasts were published in two Canadian newspapers, the Toronto Star and Le Devoir (see Bélanger and Godbout Reference Bélanger and Godbout2000, Bélanger and Godbout Reference Bélanger and Godbout2004, and Bélanger and Godbout Reference Bélanger and Godbout2006). Our very simple politico-economic model, presented in more detail in the next section, forecasted the percentage of support for the incumbent party well in advance of these three elections. In 2000, our model predicted a Liberal victory, with 45% of the vote and a majority of 175 seats. The Liberals won 172 seats and 41% of the vote. In 2004, the model forecasted a minority government for the Liberals, with 34% of the vote and 106 seats. Although the outcome was indeed a Liberal minority as we predicted, the forecast fell slightly short of the actual result of 135 seats and 37% of the vote. For the 2006 election, our model gave 33% of the vote and 105 seats out of a total of 308 to the incumbent Liberals. While the model does not permit an estimate of the number of seats that will likely be won by each opposition party, the predicted drop in incumbent support made it very likely that the Conservatives would form a minority government, which is exactly what happened: in 2006, the Liberals became the official opposition by winning only 103 seats and 30% of the vote.
As can be seen, these preliminary attempts proved quite successful in terms of predicting both the seat and vote shares going to the incumbent party, within an acceptable margin of error (between three and four percentage points for the vote in the three elections, and less than one percentage point for seats in the 2000 and 2006 elections). Unfortunately, the short writing space available in these newspapers did not allow us to fully disclose the content of the model or thoroughly examine its forecasting capabilities. The next section sets out to accomplish this task by explaining in more detail the theoretical underpinnings of our model and its statistical properties. We also update our analysis to include the latest 2008 federal election.
THE BASELINE MODEL
The vote function model that we use to forecast Canadian federal election results is based on the well-grounded theoretical assumption that election outcomes are a function of both economic and political factors (see Nannestad and Paldam Reference Nannestad and Paldam1994; Lewis-Beck Reference Lewis-Beck2005). In democracies, voters generally hold incumbent candidates or parties partially responsible for the state of the national economy. In addition, incumbents are judged by the public on a number of other political outcomes, such as their performance in handling health care, crime, or international relations. Theoretically, government approval or popularity at election time should reflect overall performance. Another political factor that may matter is the “time for a change” variable, meaning that after several terms under the same administration and rising public dissatisfaction (following, for instance, the disclosure of scandals, corruption, mismanagement, or simply incumbent fatigue), voters may wish to swing the balance of power over to one of the opposition parties. Our baseline forecasting model rests on these three politico-economic variables.
The empirical indicator that we use to measure the state of the economy in Canada is the unemployment rate. As the proportion of people without a job rises (or decreases), we expect that the governing party will lose (or win) votes at the polls; hence, a negative relationship is hypothesized. The choice of unemployment is rather straightforward, since all the most recent aggregate-level studies of economic voting in Canadian federal elections have shown it to be the single most effective economic predictor of the vote in the country, outperforming any other macroeconomic variable (see Nadeau and Blais Reference Nadeau and Blais1993; Gélineau and Bélanger Reference Gélineau and Bélanger2005).Footnote 3 The unemployment measure that we use in this analysis is the average rate for the second quarter preceding the actual election; that is, we use the average of the rates published by Statistics Canada (n.d.) for the fourth, fifth, and sixth months preceding the election.Footnote 4 This approach is used to allow a forecast with a three-month lead time. The limited availability of Canadian unemployment data before the 1950s is the reason why our model cannot forecast elections before 1953.
We include two political variables in our baseline model. The first variable is an indicator of overall satisfaction with the incumbent administration. A direct measure such as government approval would be ideal, but for Canada, such an indicator is available for only five federal elections (1958, 1963, 1974, 1997, and 2000). We decided not to use this variable because it would drastically reduce the number of cases on which our forecast model could rest, as well as the number of degrees of freedom available for the statistical estimation of the model. Thus, we were left with the alternative of using an indirect measure of approval—the declared vote intentions in favor of the incumbent party—with a three-month lag, as measured in published national polls. The source for the measure is Gallup Canada for the period of 1953 to 2004. Because Gallup stopped publishing vote intention polls after 2004 in Canada, we had to rely on other polling sources for the two most recent elections included in our model (2006 and 2008). Since the number of published pre-campaign polls has exploded in Canada in recent years (see Pickup and Johnston Reference Pickup and Johnston2007), we decided to use the average of all available national vote intention polls for the third month preceding the election.Footnote 5
The second political variable included in the model is a measure of government longevity. The rationale is based on the idea that the longer a party has been in power, the greater the chance that it will lose support and be replaced by an opposition party (i.e., a negative relationship is expected; Paldam Reference Paldam1986). This “time for a change” variable has been commonly used in forecasting models in both the United States (e.g., Abramowitz Reference Abramowitz2008) and the United Kingdom (e.g., Bélanger, Lewis-Beck, and Nadeau Reference Bélanger, Lewis-Beck and Nadeau2005). In our model, we use the natural logarithm of the number of consecutive months the incumbent party has been in office.Footnote 6 The logarithmic transformation of the variable introduces the assumption that the marginal effect of time (i.e., the effect of each new additional month) diminishes as mandates grow longer (see appendix for all data used in this article).
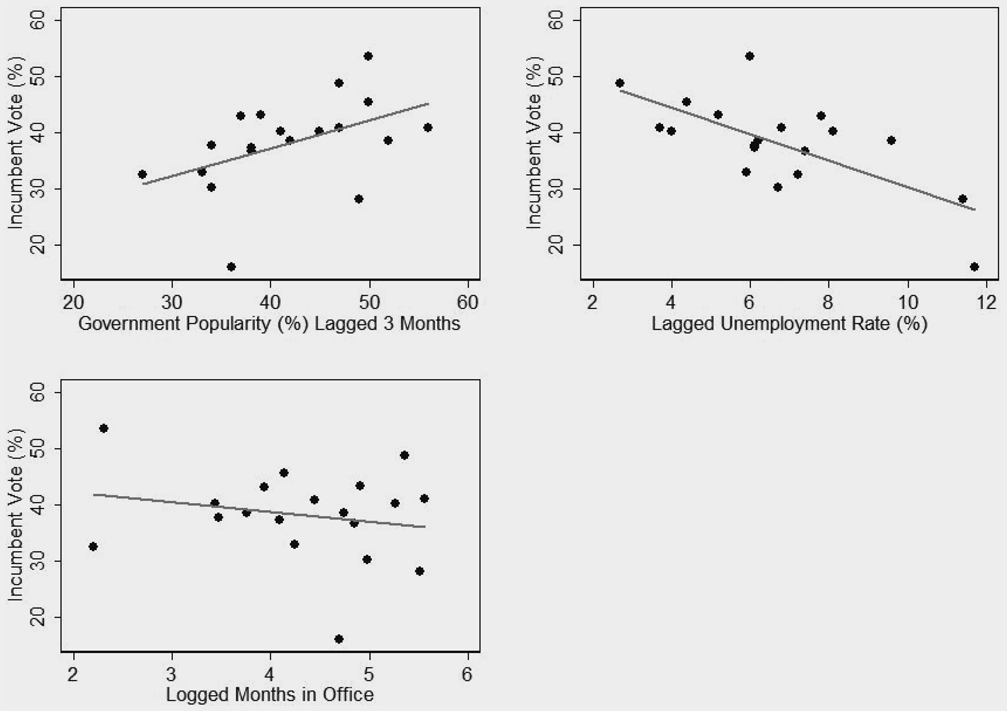
At first glance, it seems that each of these three independent variables is linked to the incumbent party vote share in Canadian federal elections. As figure 1 shows, the lagged popularity measure provides a relatively close fit to the election outcome but is far from being a perfect predictor (the correlation between the two is .47). A good amount of variation in incumbent support still remains to be accounted for by other variables, such as the state of the economy or public fatigue with the current administration. Of particular notice is the strong correlation (−.69) between incumbent vote and the unemployment rate. The relationship between government longevity and support is more modest (correlation of −.21) but in the expected direction (negative). These bivariate results suggest that each of the three independent variables will potentially contribute something different to the forecasting equation.
Incumbent Vote and Its Predictors, 1953–2008

It remains to determine the accuracy of the forecast made by these three politico-economic variables when they are combined in a single model. Equation 1 shows the ordinary least squares (OLS) multiple regression estimates for our baseline model:

where V = vote share (as a percent) of the governing party in the election; U = unemployment rate for the second quarter prior to the election; P = popularity of the governing party (as a percent) three months before the election; and M = natural log of the number of months the governing party has been in office. The figures in the equation are unstandardized OLS regression coefficients, the figures in parentheses are absolute t-ratios, R 2 is the coefficient of multiple determination, adj. R 2 is the coefficient of multiple determination adjusted for degrees of freedom, SEE is the standard error of estimate, DW is the Durbin-Watson statistical test for first-order autocorrelation, and N is the number of observations on federal elections, 1953–2008.
Two of the three variables are significant predictors of the vote at p < .01 (two-tailed test). The logged-months variable, on the other hand, reaches the conventional minimum level of significance (p < .10, two-tailed test). With an adjusted coefficient of multiple determination of .64 and a standard error of estimate of 4.89, the model offers a very good fit to the data, although not as good as some of the better forecasting models found in the United States or the United Kingdom. For example, the models by Abramowitz (Reference Abramowitz2008) and Nadeau, Lewis-Beck, and Bélanger (Reference Nadeau, Lewis-Beck and Bélanger2009) have R 2 values that hover around .90. Still, this baseline model's results appear robust, with the model succeeding at a number of diagnostic tests. The Durbin-Watson statistic indicates an absence of first-order autocorrelation. Furthermore, the residuals from the regression show no problematic time trend, and the error terms appear to be normally distributed. Finally, the estimated effects do not seem to have been influenced by the presence of outliers. Cook's D values all fall below a cutoff point of 1, the highest value being .43 for the watershed election of 1993, in which the incumbent Progressive Conservatives were left with only 16% of the vote (and two seats out of a total of 295 in the House of Commons). Only two studentized residuals exceed the absolute value of 2, the largest being 2.09 (again, for the 1993 election). Hence, there is no reason to doubt the robustness of the model, despite the special case of 1993 and an R 2 value that is a bit lower than is usually found in other election forecasting models around the world.Footnote 7
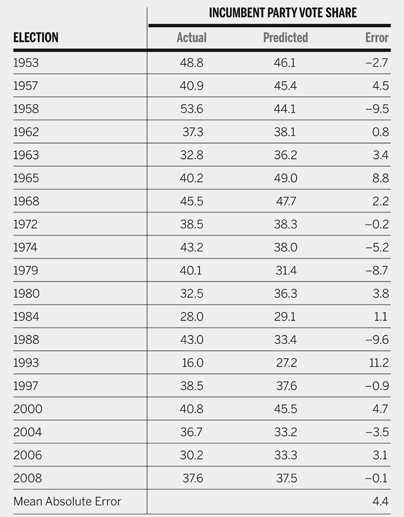
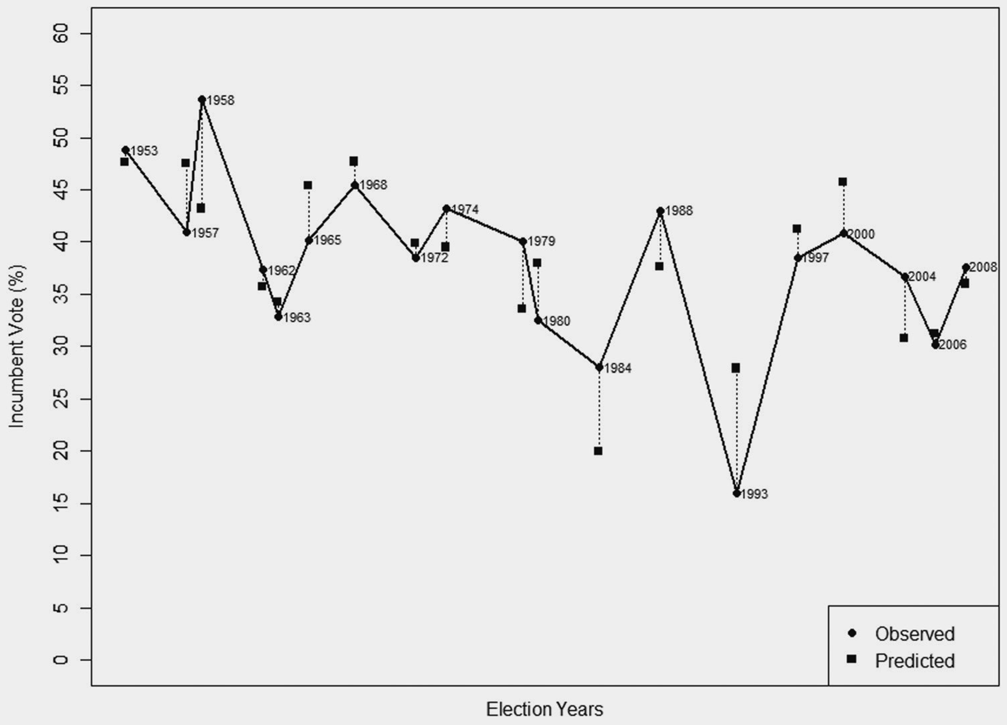
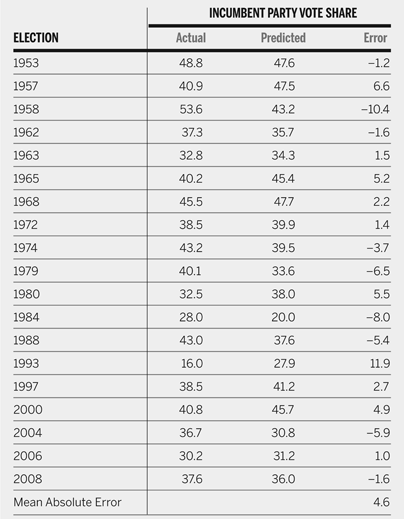
The model's real tests, however, are the out-of-sample forecasts that it can generate. These forecasts are provided in table 1 and summarized graphically in figure 2. The model's mean absolute error is 4.4 percentage points in incumbent support. In close to half of the cases (n = 7), the difference between the predicted and the actual incumbent vote share is less than three points—the typical margin of error attributed to commercial polls. The outcome of the most recent federal election (2008) received the best prediction, with the model missing the mark by only 0.1 point.
Baseline Model Out-of-Sample Forecasts, 1953–2008

Predicted and Observed Values

The model's average error of 4.4 points reflects certain years when the general pattern appears to have been skewed by campaign performance. For instance, for the 1993 election, the model overestimates by more than 11 points the vote share actually received by the Progressive Conservatives. As well, support for that same party is greatly underestimated by nearly 10 points in the 1988 election. These examples advise caution in interpreting any electoral forecast. There are always exceptional cases in which campaign issues and performance play a role (see Campbell and Garand Reference Campbell and Garand2000). The power of the free trade issue in 1988 and the disappointing performance of the Kim Campbell team in 1993 account for the less precise forecast for those two elections. The model's crucial feature is that the political and economic variables are all measured three months prior to the actual election. Consequently, our analysis does not take into account the potential effects that political campaigns themselves may have on voting behavior. Three other election outcomes are predicted with an error of over eight percentage points. Two of these (1958 and 1965) were campaigns in which a new, relatively short-lived minority government was seeking reelection. In the next section, we will examine whether our baseline model can be improved by taking minority governments into account.
Because Canada uses a single-member plurality (SMP) electoral system, the party that wins the most seats in an election generally forms the next government. A forecast of the vote share, as shown in equation 1, can give us a clear indication of the incumbent party's chances of reelection. However, ideally, we would also know how this level of support would translate into parliamentary seats. To do so, we rely on a vote-seat “swing ratio” modelFootnote 8:

where S = seat share (as a percent) of the winning party in the election, V = vote share (as a percent) of the same party (as in equation 1), and the figures and statistics are defined as in equation 1.
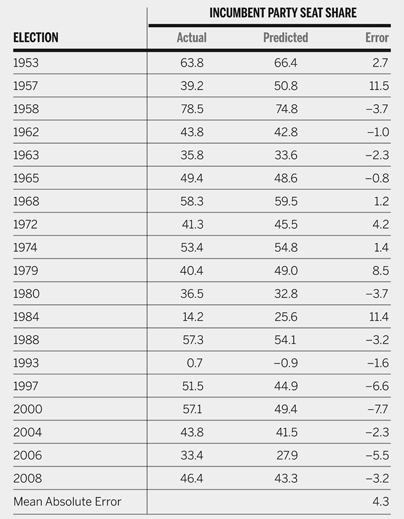
In equation 2, the percentage of seats taken by the incumbent party is predicted from the actual (not predicted) percentage of votes obtained by that same party. Under the SMP system, the relationship between votes and seats is not perfect, but it is very tight, with a one-point increase in vote share leading to a two-point increase in seat share. Table 2 presents the out-of-sample forecasts derived from that swing ratio. The mean absolute error is 4.3 percentage points. The main reason why we include this vote-seat swing ratio is to present an estimation of the proportion of seats that the incumbent party is likely to get based on the incumbent vote share predicted by equation 1. The primary disadvantage of this approach, of course, is that the seat forecast cumulates two errors: the error from the vote prediction and the error associated with the seat prediction itself. Another caveat is that in Canada, parties have frequently been able to form governments without holding a majority of seats (this occurred nine times during the period covered here). Consequently, knowledge of the number of seats won by the incumbent party does not necessarily reveal whether it will form the next government with any certainty. Despite these limitations, a vote-seat swing ratio model has still proven quite useful in forecasting other parliamentary elections (see, e.g., Bélanger, Lewis-Beck, and Nadeau Reference Bélanger, Lewis-Beck and Nadeau2005; Whiteley Reference Whiteley2005).
Out-of-Sample Seat Share Forecasts from Incumbent Vote

CAN THE MODEL BE IMPROVED?
Based on the results obtained with the baseline model presented previously, two immediate possibilities for improvement arise. The first relates to the 1993 federal election, which appears to be an outlier not only in the model, but also in Canadian political history. Our analysis explored two ways of dealing with the 1993 case. In both cases, our attempts to improve the model proved unsuccessful. The first way of taking the 1993 election into account was to add a dummy variable to the forecasting equation to control for this outlier case. Although the inclusion of this dummy does improve the model's fit to the data (adjusted R 2 = .71), its average forecasting error actually increases to 4.8. We also re-estimated the model while excluding 1993 from the universe of cases. Contrary to what one might expect, the model's performance worsens when 1993 is left out, with the adjusted R 2 dropping to .51. In short, it does not appear that the model can be significantly improved by treating the 1993 election as a special case. It seems that the values of our three independent variables for 1993 (the highest unemployment rate observed for our 19 cases, the party's 110 consecutive months in power, and the government's low popularity) partially account for the very low level of support received by the incumbent Progressive Conservatives in this election.
Treating minority governments as outliers does not help improve the model either. In their Canadian vote function work, Nadeau and Blais (Reference Nadeau and Blais1993) argue that new minority governments lasting less than a year—like those of 1958 and 1980—need to be excluded from estimations, because we cannot expect voters to form a clear-cut assessment of the economic performance of the administration over such a short period of time. Although this argument is sound, we do not find an improvement in model fit once these two governments are excluded from our forecasting equation. The model's adjusted R 2 drops to .59, and the mean forecasting error remains at 4.4. The error even increases to 5.5 if we exclude all eight instances of incumbent minority governments (regardless of their duration) from the estimation.Footnote 9
Another important independent variable that may be absent from our forecasting model is related to leader popularity. More precisely, Nadeau and Blais (Reference Nadeau and Blais1993) have also argued for the inclusion in Canadian vote functions of a variable that takes into account the provincial origin of party leaders. They observe that federal party leaders originating from Quebec usually give a substantial electoral advantage to their party in that province; the authors also find that this boost is generally amplified by a bandwagon effect in the rest of the country. Nadeau and Blais find that a major party with a leader from Quebec receives a five- to six-point boost in its share of the national vote. This effect may indeed explain why Canada has been governed by a prime minister from Quebec for 46 of the 65 years since the end of the Second World War.
We hypothesized that taking this phenomenon into account might improve the performance of our forecasting model, and we thus incorporated such a variable into our baseline model. The variable is coded as in Nadeau and Blais (Reference Nadeau and Blais1993) and takes the value of 1 when the incumbent party leader is from Quebec and no other leader is from that province; 0 if no leader is from Quebec; and −1 if the incumbent party leader is not from Quebec, but the leader of the opposition is from that province. As in Nadeau and Blais, the variable also takes into account minor party leaders from Quebec, such as the leaders of the Ralliement des Créditistes party (1962 through 1980) and the Bloc Québécois (1993 to the present). In those instances, the value of 1 is replaced with 0.5, and the values of 0 and −1 are replaced with −0.5 (see the appendix). This coding adjustment is based on the assumption that the presence of a leader from Quebec has a greater impact on the vote when that leader heads a major party without any other Quebec leaders on the ballot. This time, our model appears somewhat improved:

where V, U, P, and M are defined as in equation 1; L is the leader variable coded as −1, −0.5, 0, 0.5, or 1; and the figures and statistics are defined as in equation 1.
The new leader variable does have a statistically significant effect on the incumbent vote share (at p < .05, two-tailed test). This effect is roughly of the same magnitude as the one found by Nadeau and Blais (a boost of nearly five points). Moreover, it does not diminish the influence of the other variables in the model, which all remain significant (at p < .05 or better, two-tailed test). The model fit also slightly improves; however, its forecasting performance does not seem to be much better than with our previous specification (see table 3). Equation 3 generates a mean forecasting error of 4.6, which is slightly higher than the baseline model's error. This increase appears to be partially related to the fact that the Quebec leader's effect is somewhat overestimated in a number of elections. For instance, note that the forecast errors for the 1984, 1997, and 2008 elections are greater in table 3 than in table 1 (i.e., the forecasts from the baseline model). The Mulroney effect in 1984 seems greatly overestimated, as does the Chrétien effect in 1997 and the Dion effect in 2008. The latter example illustrates the fact that the presence of a leader from Quebec is not sufficient to boost support for a party: Stéphane Dion, the leader of the Liberal opposition in 2008, faced an incumbent leader from outside Quebec, but he remained highly unpopular even in his home province of Quebec. Dion actually led the Liberal party to one of its worst electoral defeats in history (26% of the national vote). This example suggests that a more direct measure of leader popularity would be preferable, although, like government approval, no single measure seems to be available for all the elections covered in this study (on this point, see Nadeau and Blais Reference Nadeau and Blais1995). At the very least, it is not clear that a model that includes a leader variable (equation 3) is a better forecasting tool than our baseline model introduced earlier in this study.Footnote 10
Leader Model Out-of-Sample Vote Share Forecasts, 1953–2008

SUMMARY AND CONCLUSION
In this study, we develop a classic politico-economic model to forecast the level of electoral support for the incumbent party in Canadian federal elections. We show that it is possible to predict election outcomes in Canada with an acceptable level of accuracy and a relatively small sample size (N = 19), just as electoral forecasters have recently done for other major democracies. The model is based on three independent variables: the unemployment rate, the popularity of the incumbent, and the longevity of the government. The first two variables are measured with a lag of three months to allow a forecast well in advance of Election Day. Furthermore, these three politico-economic variables are well grounded in the literature on the behavior of voters in Canada and other advanced democracies. The model provides a vote share prediction, which in itself offers a good indication of the incumbent's chances of reelection. This prediction can also be used to estimate the proportion of seats that will be taken by the incumbent party in the Canadian House of Commons via a vote-seat swing equation.
Our vote function model appears robust on a number of accounts and generates out-of-sample forecasts with an average error of a little over four percentage points. While somewhat impressive, the model's statistical properties and forecasting capabilities are not nearly as excellent as those found in other existing democracies. Nonetheless, we believe that as it currently stands, our model cannot be much improved. Several possibilities were explored without success. One interesting variable that might be added to our vote function is a measure that takes into account the provincial origin of party leaders. But even then, we find that although the inclusion of this leader variable does slightly improve the model's fit, it actually increases its average out-of-sample prediction error. Hence, it is not clear that this revised model is a better alternative to our original specification. We do believe, however, that it is important for the next generation of Canadian election forecasting models to include a prediction not just for the incumbent party vote share, but also for the principal opposition party (for an example in the U.K. context, see Nadeau, Lewis-Beck, and Bélanger Reference Nadeau, Lewis-Beck and Bélanger2009).
Future Canadian election contests will be able to offer an even better assessment of the model's forecasting power. Because of the uncertainty associated with the survival of minority governments, it is difficult to predict when the next federal election will occur in the Canadian context. The Liberal opposition did try to overthrow the Conservative government in October 2009 by introducing a motion of no-confidence, which failed to be supported by a majority of the House. Many on Parliamentary Hill believed that Liberal leader Michael Ignatieff 's strategy was unwise, the equivalent of a “political suicide” (Persichilli Reference Persichilli2009).
Yet, our model demonstrates that the timing of a fall election did not represent such a bad strategy for the opposition. Assuming that this motion had passed, the values of our three independent variables would have been 8.5 for the unemployment rate (average of May, June, and July 2009), 33 for the incumbent party's popularity (average of eight published polls during the months of July and August), and 45 months for the longevity measure (logged value = 3.807). Hence, the baseline model's forecast gives 31.1% of the vote (equation 1) and 93 seats out of 308 (equation 2) to the Conservative party. Our model thus predicts that a new Liberal government would have been elected in November 2009.Footnote 11
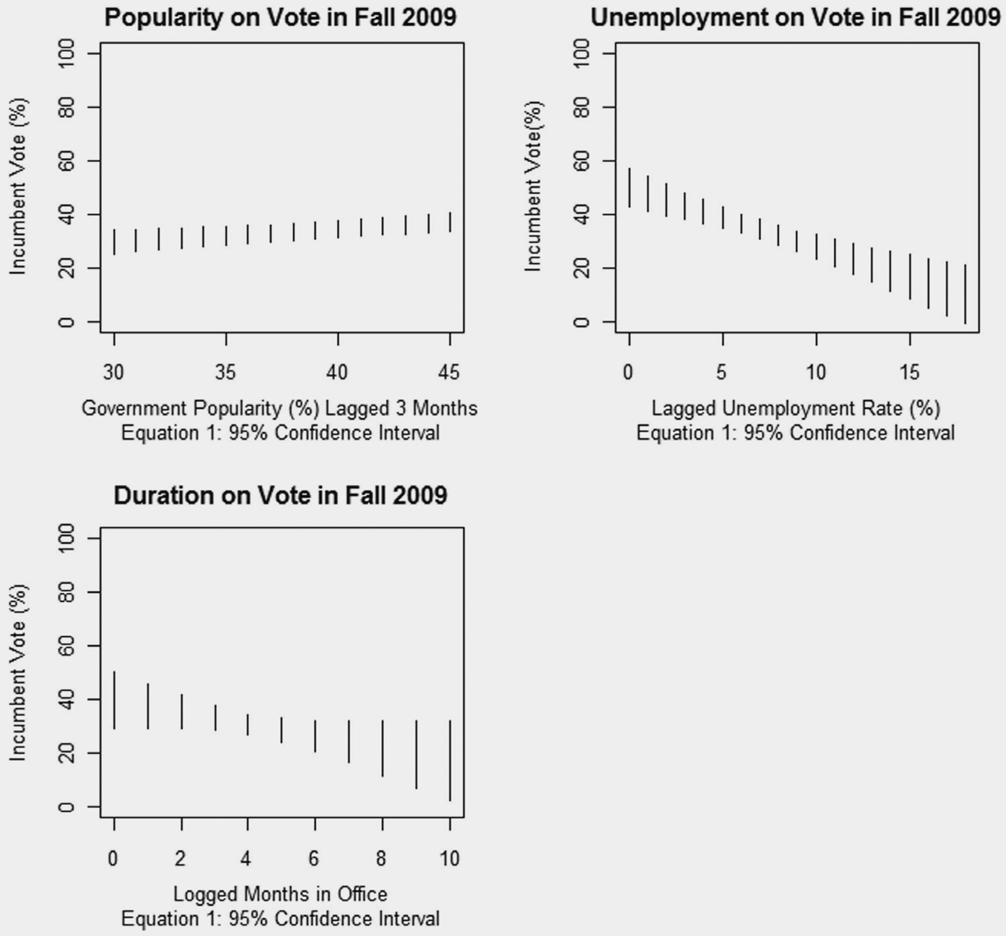
To further investigate this forecast, figure 3 reports the effects of a hypothetical increase (or decrease) in the unemployment rate and government popularity in the second quarter of 2009 on the Conservative vote share. The figure also demonstrates how the incumbent government would have performed in a November 2009 election had it been in power for a longer (or shorter) period of time. All the plots in figure 3 display the simulated influence of an independent variable (unemployment, popularity, logged months) on the estimated model output, with a 95% confidence interval (all three plots also control for the effects of the other variables in the model set at their value for a November 2009 election).Footnote 12 The most important variable of our model is undoubtedly the unemployment rate. As we can see, a hypothetical increase in the level of unemployment from 8.5% to 10% generates a significant reduction in the level of support for the Conservative party (more than 3.3 percentage points), everything else being equal.
Influence of Government Popularity, Unemployment Rate, and Logged Months in Office on Percentage of Incumbent Vote

We shall see over the coming months if an election will actually be called, and whether the political and economic situation will evolve in a direction that is more favorable to the Liberal opposition. Given that the Organization for Economic Co-operation and Development (2009) has recently predicted that Canada's unemployment rate, which reached 8.7% in August 2009, could rise to 9.8% by late 2010, keeping the Conservatives in power until then might prove to be in the opposition parties' best interest. However, our model strongly suggests that a relatively quick economic recovery and/or renewed incumbent popularity over the coming months could ensure the electoral survival of the current Conservative government. Indeed, the unexpected recent reduction in the Canadian level of unemployment seems to be playing right into Prime Minister Stephen Harper's hands.Footnote 13
APPENDIX
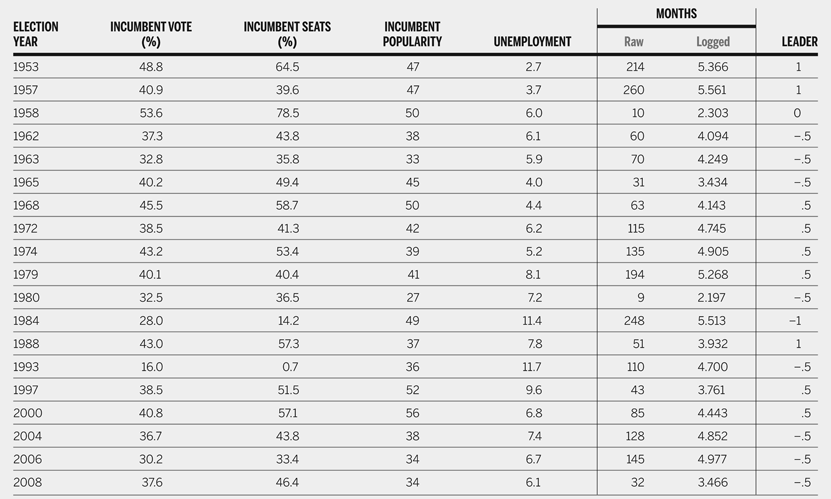
Canadian Politico-Economic Data Used in the Forecast Model

Note: See text for the explanation of the coding values for the Leader variable.