In the late nineteenth century, voluntary associations blossomed as the nation recovered from the Civil War and settlers pushed westward to fulfill Manifest Destiny. An industrial and economic boom connected the continent, making it easier for like-minded people to meet and communicate over long distances, enabling the creation of large, national interest groups. This historical account is common among public choice scholars and other researchers, who contend that modernization was the essential explanatory variable in the creation of the late-1800s interest group state. Other scholars, however, focus on the aftereffects of the Civil War. For example, Crowley and Skocpol (Reference Crowley and Skocpol2001) argue that Union mobilization and the presence of pensioners after the war influenced the creation of voluntary membership associations more than advances in technology and transportation.
This scholarly debate has stimulated an important discussion about the development of the interest group state in the postbellum era, a critical juncture in American political history. However, analyses focusing on group formation tell us little about organizations’ abilities to attract members, set policy agendas, and potentially affect government. Thus, in this article, we extend the debate over the influence of modernization in the late nineteenth century to focus specifically on interest group strength. In particular, we consider the development of four voluntary associations with clear political agendas: the Woman's Christian Temperance Union (WCTU), the Patrons of Husbandry (the Grange), the Grand Army of the Republic (GAR), and the National American Woman Suffrage Association (NAWSA) from the period just before the end of Reconstruction, in 1875, up to the dawn of the twentieth century, in 1900. We evaluate organizational strength at the state level, measured by the dues paid to national organizations, and examine its relationship to modernization, measured as a combination of factors related to industrialization, education, wealth, and rapid advancements in transportation, communication, and electrical power.Footnote 1
The results indicate that modernization mattered, to some degree, for all four groups, despite their appeals to different types of members and for a variety of policies. State-level organizations were typically stronger in states that were modernizing, especially in terms of communication and transportation technologies. Civil War mobilization, however, was not a consistent indicator of the relative strength of state-level groups during this period, except for the GAR. Overall, these results provide quantitative support for earlier arguments about the role of technological advancement in the development of politically oriented, voluntary associations. They also underscore the role of modernization in maintaining durable state-level groups.
We begin in the next section by laying out the different theoretical approaches that motivate the study. Then, in the “Data” section, we explain why we focus on these four organizations, and describe the choices and measurements of dependent variables, our measures of modernization (which are the key predictors), and control variables. Under the “Results” heading, we focus on preliminary, correlational findings between our modernization measures and group strength, followed by the presentation of two types of empirical models (one with unweighted, raw measurements and the other with per capita measurements of the variables). We then evaluate the results in the “Discussion and Conclusion” section, describing what these findings mean for the literature on modernization and war in the development of voluntary associations while offering insights into future research directions that would build on the results presented here.
Modernization and Group Development in the Late Nineteenth Century
Many interest group scholars take for granted modernization's role in group formation. As McFarland (Reference McFarland1991) wrote, “[S]cholars early adapted the idea of Durkheimian evolution of complexity to observe that the number and types of interest groups proliferated with modernization and economic development” (257). David Truman's (Reference Truman1981) disturbance theory, which argues that interest groups form in response to shake-ups in the social and political systems, also embraces this idea. This scholarship is particularly important because of the influence it has had on the development of the modern interest groups’ literature.
Public choice scholars have also noted modernization's effect on the development of interest groups and voluntary associations. In Mancur Olson's classic text The Rise and Decline of Nations (Reference Olson1982), he posits that government stability is a significant predictor of both the number and size of interest groups. Less developed, and hence less stable, societies, Olson argues, “usually do not have anything like a complete modern system of transportation and communication, at least in the rural areas” (168). As a result, power is concentrated in small cadres of elites in capital cities and major urban centers. Only when technological innovation takes root, allowing for the expansion of democratic networks and ideals, can power decentralize, and, thus, interest groups begin to form.
This logic is carried forward by Mueller (Reference Mueller1984) and Mueller and Murrell (Reference Mueller and Murrell1986). In both studies, the authors note that nations that have been modernizing (or are modernized) for longer periods tend to have more interest groups. Additionally, Congleton's (Reference Congleton2004) study of industrialization and suffrage found that “industrialization can be a catalyst for political reform because changes in technology and wealth associated with industrialization may energize political and economic interest groups” (285). This occurs because industrialization lowers the costs inherent in group formation, while increasing the demand for organized representation in government (283).
The collective implication of these studies is clear. Modernization, such as rapid expansion of railroads, increased industrialization, and technological advancement alters citizen participation in politics. Perhaps at no time in American history was this clearer than during the last quarter of the nineteenth century. The United States moved from a largely agrarian, rural society, with distinct regional and even subregional cultures, to a truly urbanized, interconnected country with national priorities.Footnote 2 Thus, scholars would be wise to also expect that the modernization of the United States during this era created a transformative environment conducive to group formation.
The most prominent political scientists studying this era, however, have taken a different approach. In particular, Crowley and Skocpol (Reference Crowley and Skocpol2001) use data on group formation for 21 different membership federations with state organizations founded between 1860 and 1920 to “present strong evidence that institutional and electoral processes, plus Union mobilization and victory in the Civil War, were in fact prime influences on U.S. association-building at its apex in the late nineteenth and early twentieth centuries” (824).Footnote 3 Specifically, they contend that Union pensioners and a state's contribution to the war effort, coupled with groups forming in neighboring states and electoral competition, spurred group formation. Later work that refines Crowley and Skocpol's analytical approach finds even greater evidence for the Civil War as a driving factor (Carter and Signorino Reference Carter and Signorino2010).
Similarly, Gamm and Putnam (Reference Gamm and Putnam1999) find that more associations formed and developed between 1840 and 1940 in small cities and large towns that were not undergoing significant changes in population and technology. But, it was not just group formation that was unrelated to modernization. Gamm and Putnam contend that “associational activity was consistently weakest in large, rapidly growing cities” (514), which were often the cities undergoing the greatest levels of industrialization and technological change. Modernization, in their view, was not a boon for group formation or group strength.
Thus, scholarship on the development of the interest group state can then be roughly divided into two schools of thought. One school argues that modernization spawns the formation of interest groups, while another contends war and postwar mobilization are the keys to motivating the nation's latent civic potential.Footnote 4 While not necessarily antagonistic schools of thought, the connections between them are often unclear.
Here, we argue that these theories deserve further empirical exploration in tandem, but we depart from the typical focus on the creation of organizations and instead focus on the strength of these organizations. Granted, in the one case in which group strength is discussed, it is in opposition to the modernization argument (see ibid.: 545–48). But, no study has looked at state-level indicators of organizational strength, across various groups, during this era. This we deem vital to the study of these organizations, and we provide three reasons for this change in analytical focus from formation to strength.
First, citizens and politicians are generally more amenable to listening to larger, richer organizations than small, resource-poor ones. Though there are exceptions, most groups are motivated to increase their membership and their budgets. Therefore, organized interests invest effort in providing selective incentives to draw in dues-paying (and donation-giving) members, who thereby justify their participation based on the incentives they receive (Salisbury Reference Salisbury1969).
Second, state-level organizations within a national federated organization do not remain equal in membership and resources. If citizens, for example, established three new state-level branches of an organization at the beginning of 1883, and each survived into the next year, it is unlikely that they would remain equal in size and influence. One group could quickly outpace the other two, or perhaps two groups could grow quite rapidly while the third struggled to find a following. Mere group formation, then, tells us little about group strength, and it is strength that results in agenda-setting power and policy change.
Third, and critically, the causal mechanisms that lead to the creation of state-level associations need not be the same ones that affect organizational strength. While modernization may not be related to group formation, the changes that occur in a society as it modernizes may certainly help a group gain members, increase resources, and build social and political presence. Even Crowley and Skocpol (Reference Crowley and Skocpol2001) concede that their conclusions do not eliminate the possibility that modernization could affect group strength. They write, “The Civil War might have launched many civic ships, but perhaps they were propelled thereafter by the ocean swells of modernization” (815). It is, therefore, imperative to place scholarly attention on this question to advance the study of interest groups in the late nineteenth century.
Data
Group Selection
Four groups, each formed during the postbellum era and included in Crowley and Skocpol (Reference Crowley and Skocpol2001), are analyzed in this article. Here, we present each organization, along with a brief overview and an indication of the group's activities and the selective incentives (Salisbury Reference Salisbury1969) members received from joining with, and participating in, the organizations.
First, the WCTU was founded in 1874 and focused primarily on spreading the gospel of the dangers of alcohol while advocating for prohibitory legislation. The WCTU was also interested in a host of issues related to protecting women and families, such as age of consent laws, early childhood education, and social hygiene (see Tyler Reference Tyler1949).Footnote 5 It had great appeal to many women, and grew rapidly across the period. It offered a host of solidary benefits, in terms of meetings and activities at the state and local levels, but certainly the purposive benefits of temperance and its related policy issues attracted members. Selective, material benefits likely kept women in the group as well. The famed “white ribbon” of WCTU members, though only a small marker of activism, is akin to modern-day equivalents such as T-shirts and bumper stickers.
Second, the Grange was founded in 1867 and lobbied governments concerning agricultural issues; its membership saw a dramatic increase in the early 1870s, only to decline sharply during the latter part of the decade. Several factors caused this drop in membership (see Nordin Reference Nordin1974), but leaders remained committed to the group's core message to serve as a social and advocacy group for farmers. This sustained messaging paid off, as the organization survived its initial growing pains, strengthening its political influence from 1880 until 1900 (ibid.). Throughout, its secretive, fraternal elements provided a solidary incentive that united farmers across social classes. Furthermore, providing material benefits to farmers, whether through cooperative farming initiatives, in setting up libraries at Grange halls, or by creating extension courses of college study for members, led families to join the order. Finally, there were purposive reasons, in the generalized sense of promoting a farming lifestyle, but the organization took on too many political issues and policy positions differed regionally throughout the organization (ibid.). So, while it combined all three, its solidary and material benefits attracted farm families, as they were the only people allowed to join.
Third, the GAR was formed in 1866 as a Union veterans’ organization. Though it suffered from organizational maintenance concerns until renewed efforts by leadership in 1877 led to rapid growth, it has been described by scholars as a powerful pressure group, lobbying on several issues—most prominently pensions—and participating in electoral politics (Dearing Reference Dearing1952; McConnell Reference McConnell1992). In this way, it attracted members for purposive reasons. Yet, it offered veterans a solidary benefit, creating a military-style hierarchy in a federated organizational structure. Selective incentives were fewer, in part because its biggest success in lobbying for more pensions was not restricted to group members. Nevertheless, as the pool of potential members could only decrease as time went on and as veterans died off, the organization unified veterans for purposive and solidary reasons.
Fourth, the NAWSA was founded by the merger of two other woman suffrage groups (the National and the American, respectively) in 1890; it lobbied for woman's voting rights. Ultimately successful, it transformed itself at its last convention in 1920 into the League of Women Voters (see Harper Reference Harper1922: 595), which still exists. Like the GAR, it appears that solidary and purposive incentives were the core reasons for joining the group. Women's suffrage was the end goal, and there was not necessarily a specific social orientation to the group (as with the Grange). Certainly, solidary benefits could come from mingling with like-minded people, and joining the organization might bring some material benefits, but the goal was national women's suffrage.
Of the other groups founded between 1865 and 1900 in the Crowley and Skocpol (Reference Crowley and Skocpol2001) study,Footnote 6 several were social and/or religious orders without, for the most part, extensive and consistent political agendas (e.g., Order of the Eastern Star, Knights of Columbus, Modern Woodmen of America, Woman's Missionary Union, Woodmen of the World, the Fraternal Order of Eagles). One organization of political interest, the National Congress of Parents and Teachers, did not establish a national organization until 1897, thus providing too few time points for a thorough, comparative analysis.
This leaves four other groups that could have been included in our study: the Ancient Order of United Workmen, the General Federation of Women's Clubs (GFWC), the Farmers’ Alliance, and the American Federation of Labor (AFL). The first group, despite its name, was a fraternal group focused primarily on providing insurance. The GFWC involved itself in some political issues, but was first and foremost a social organization. Thus, we exclude these groups based on their mission. We also exclude the Farmers’ Alliance and the AFL, which had clear political goals, because we cannot reliably assess their strength quantitatively. The former never truly established a working national order and the latter did not include state-level dues data in its proceedings.
Putting aside the groups not chosen, the four groups selected for study are quite diverse in terms of their major policy goals, making this combination a strong test of our theoretical expectations concerning the role of modernization on group strength. Women's voting rights, pensions for veterans, promoting and improving the livelihood of farmers, and working for prohibition conceivably involve different means of recruiting members and varying methods to try and influence the course of government policy. Likewise, the groups were not equally successful in reaching their goals. For example, the GAR helped place veteran's affairs on the national government agenda (McConnell Reference McConnell1992) while the Grange was often limited in its policy impact at the national level because it could not focus on a few major policy goals (Nordin Reference Nordin1974). Yet, despite these groups originating in different policy areas, we expect that these differences were all likely affected, to some degree, by the trends in modernization, which would aid groups across issue areas in developing stronger organizations.
Dependent Variables
To gauge state-level group strength across multiple organizations over time, we use state dues paid to a national organization. This choice was made for several reasons. First, it is the only indicator consistently provided for each of the groups in this study; total numbers of local organizations within a state, for example, are not always provided on a year-to-year basis. Second, the money given for dues is, in itself, a measure of the total membership at the state level. Finally, these dues were critical to the operations of the national organization and its activities.
The dues data for the WCTU, Grange, GAR, and NAWSA were recorded in the organizations’ annual proceedings (Minutes of the National Woman's Christian Temperance Union 1875–94; Report of the National Woman's Christian Temperance Union 1895–1900; Proceedings of the National Grange of the Patrons of Husbandry 1875–1900; Proceedings of the Annual Meeting of National Encampment, Grand Army of the Republic 1875–1880; Journal of the Annual Session of the National Encampment, Grand Army of the Republic 1882–1900; Proceedings of the Annual Convention of the National-American Woman Suffrage Association 1893–1900).Footnote 7 In all cases, the dues paid to the national organizations came from state affiliates, which controlled the collection of dues. Thus, state-level payments to national organizations represent organizational strength.
Not surprisingly, this is because dues were tied to membership. For the WCTU, the national organization charged state bodies a set amount (either .05 or .10 during this period) for each member in the state organization, and this rate was established in the national organization's constitution. A similar pattern can be found in the Grange. It required state treasurers to pay state auxiliary dues directly to the national body, in quarterly installments, with the set amount originally at .10 per member, but decreased to .05 per member in the mid-1870s. For the GAR, it levied a per capita tax, on each state organization, set early in the 1870s at .02 per member; by the 1884 rulebook, and into the twentieth century, the tax could not exceed .25 cents per member annually (paid in quarterly installments). For NAWSA during the era studied, it was set at .10 cents per member for the state organization and all local-level organizations in a state.
We use this data to create two separate but related dependent variables. The first dependent variable is an untransformed, raw measurement of dues per state. We also calculate a measure of per capita dues, with population calculated as the average across the decade in question (e.g., the 1880s per capita dues measure was based on the average of a state's population in 1880 and 1890).
Both types of variables are useful for understanding the relationship between modernization and group strength because they measure different constructs. The raw measures capture the absolute strength of a group's state-level organizations while the per capita measures provide a comparison of state chapters’ relative strength. For example, New York was by far the most populous (and wealthy) state at the time, so the absolute contribution of its state chapters to the national organization, all else equal, is expected to be greater than a lower population state such as Vermont. However, using a per capita measure, a state chapter in Vermont could potentially make a greater relative contribution than one in New York. This distinction might be critical to politicians, citizens, and the groups.
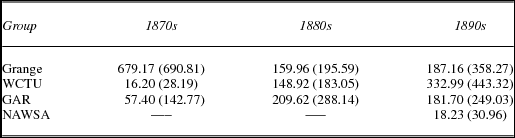
While three of the groups simply reported the dues given for maintaining an association with the national affiliate for the year, the GAR switched reporting times throughout the period analyzed here (sometimes the second quarter of a year to the first quarter of the next year, at other times, the second half of one year and the first half of the next year).Footnote 8 Thankfully, this does not create any difficulties in our analysis because we organize the data by decade, creating average dues for each state for the latter half of the 1870s, 1880s, and 1890s (see appendix table A for average dues by group and by decade). There are several reasons for this approach. First, it creates three models for each group, one per decade, and for each dependent variable, of which there are two (six total models for each group). This is more parsimonious, and hence more interpretable, than 26 separate regression models, one for each year, for two dependent variables (52 total models for each group).Footnote 9 Second, averaging the dues by state provides a better estimate of overall group strength. It does not penalize a state that has a one-year decrease in dues, nor benefit a state with a single year where dues increased markedly before dropping again. Third, and perhaps most critically, it is consistent with our modernization measure, described in the following text.
Key Predictor: Measuring Modernization
The key predictor in our models is a measure of modernization. To create this indicator, we used factor analysis. Included in our analysis were measures of wealth in 1900 (calculated based on total value measures in the Department of Commerce and Labor Special Reports of the Census Office: Wealth, Debt, and Taxation 1907: 16 [table 3]), the number of manufacturing establishments (1900 Census), railroad miles in 1900 (Statistics of Railways, Statistician to the Commission 1901: 12–13), education expenditures (The Problems of Mathematics in Secondary Education, Department of the Interior 1920: 152 [table 59]), and the number of phone exchanges, street and electric railway companies, power stations, and arc lamps in 1902 (from the census documents compiled by Steuart Reference Steuart1905a, on central electric light and power stations: 108–9 [table 66]; Steuart Reference Steuart1905b, on street and electric railways: 17 [table 10]; Special Reports: Telephones and Telegraph, 1902, Department of Commerce and Labor 1906: 45 [table 40]).Footnote 10
In using these variables to find an underlying modernization factor(s), the goal is to create a measure that captures the changing American landscape from 1875 to 1900. Expanding railroad and streetcar networks made travel easier, within cities and across the country; the burgeoning electrification of the nation, coupled with the development and use of the telephone, began to create an infrastructure that shaped the twentieth century; and the increase in wealth, driven in large part by industrialization, and an increased focus on education would form the basis of a more interconnected, civically minded populace with ample political capital. The confluence of these factors would create a more politically oriented, active population that could create large-scale, federated national organizations and more easily overcome the barriers of time, space, interest, and wealth that limited national political participation in the past.
More specifically, we included wealth because modernized societies tend to be richer than those that are less modernized. Railroad and streetcar measures were included because the revolution in transportation was critical to societies advancing into the twentieth century, improving infrastructure and interconnectedness within and across states.Footnote 11 We included education expenditures because modernization has been linked, at times, to “human capital development and the communication of ideas” (Crowley and Skocpol Reference Crowley and Skocpol2001: 818). And, finally, we measured telephones, electric power, and lighting because the absence or presence of these advancements gauges the level of rapid technological changes that dramatically altered lifestyles from the start of the period studied, when they were essentially nonexistent or just coming into being, to 1900, when they had become widespread. We create both statewide and per capita measures; in the latter, all variables were weighted by state population in 1900 (except for railroad miles, which was weighted by the land area of the state).
Importantly, we use modernization in 1900 as the baseline for evaluating group strength. This timing allows us to test whether groups were stronger in modernized states prior to the rapid expansion of modernizing forces in the 1880s and 1890s. For example, if group strength in the 1870s is highly correlated with modernization in 1900, and modernization in 1900 is equally as correlated with group strength in the 1890s, it suggests that factors beyond simply modernization explain group strength. If, however, the relationship is weaker in the early years and generally becomes stronger in the 1880s and 1890s, then there is evidence that group strength is strongly connected to the modernization of the era. In either case, finding that modernization in 1900 affects group strength suggests that large-scale, federated organizations and modernization were relatively parallel, and not disconnected, phenomena.
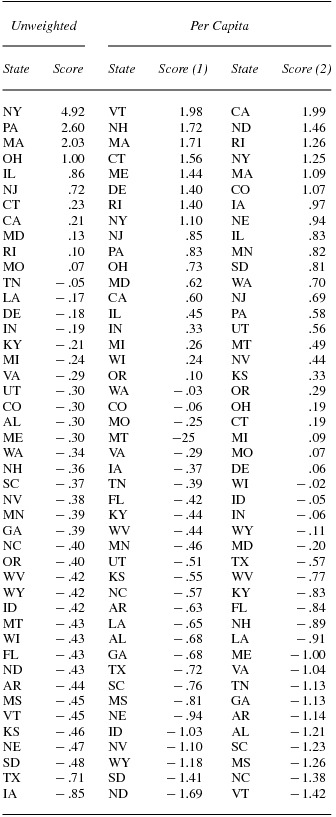
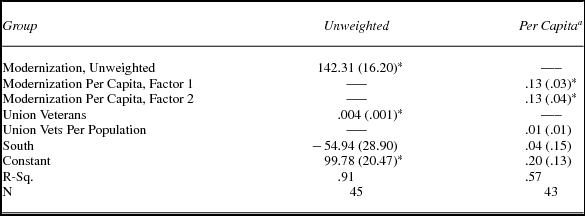
With unweighted data, one clear factor emerges from the principal-components factor analysis with varimax rotation (eigenvalue 6.86; proportion .91), so the other three factors are not considered (the highest eigenvalue was .68, much below the traditional cutoff of 1 for retaining a factor). With the per capita measures, two factors emerged as statistically significant (eigenvalues of 3.71 and 1.71, respectively; proportion .65 and .30, respectively). The first factor, which largely captures infrastructure development, is most strongly related to manufacturing establishments per capita, street railway companies per capita, arc lamps per capita, and railroad miles per square mile, with rotated factor loadings all greater than .6. The second factor is most strongly related to wealth and educational expenditures per capita, with rotated factor loadings of .83 and .80, respectively. All of these factors are displayed in table 1, organized by factor and from highest to lowest scores by state.
Modernization factors

These factors indicate that, for the raw, unweighted data, there is a strong underlying connection between these variables; we can speak of a modernization factor for this period. For the per capita measures, the two distinct factors, one focused on infrastructure and the other related to wealth and education, indicate that different considerations might arise when viewing group strength on a population-weighted basis. Modernization need not be equal, and in the same ways, across states. Some might develop infrastructure quite rapidly but lag in wealth and education; others might have wealth and education but lack a modern communication network. Table 1 suggests this on a per capita basis. This lends further support for our argument that the two modernization measures likely examine different perspectives of group strength, yet it also provides an opportunity to discern what cannot be separated easily in the raw data models: whether it is mainly wealth, or the modernizing infrastructure, that matters most.
Control Variables
With the modernization measures established, the next step is to control for the factors Crowley and Skocpol (Reference Crowley and Skocpol2001) argued were most important in predicting group formation: those related to the Union war effort and veterans. Although Crowley and Skocpol use Dyer's (Reference Dyer1908) measure of a state's contribution to the war effort and the number of pension dollars per pensioner, adjusted for inflation, here we use the total number of surviving Union war veterans by state in 1890.Footnote 12 This data is available in the Compendium of the 11th Census: 1890, Part III (Department of Commerce and Labor 1897: 574). Though only available at one point, this census of Union veterans is the most accurate assessment of surviving veterans who fought in the war. If Union veterans were a driving force in group formation and development, then this variable captures where these civically minded Civil War veterans were living.
We also employ a binary variable to control for Southern states (1 = former Confederate state). Olson (Reference Olson1982) views the region as the least stabile, and its unique problems after the Civil War and Reconstruction make it distinct from other parts of the nation during this era. This is also necessary because the South is by far the region with the consistently lowest modernization scores, and it was the region most antagonistic to the Union war effort.
Results
Preliminary Results: Correlations
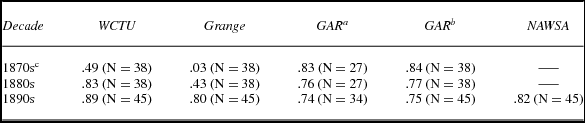
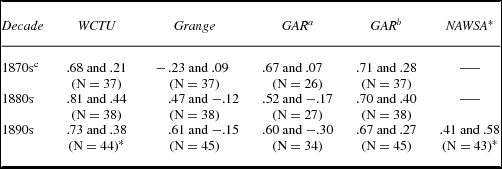
Before presenting regression models, correlations between dues/dues per capita and modernization for the second half of the 1870s, 1880s, and 1890s are presented, with table 2 focused on unweighted dues and table 3 focused on per capita dues. In the former, modernization in 1900 is much less related to group strength in the 1870s than in the 1880s and 1890s for the WCTU and especially for the Grange, where correlations increased from .03 in the 1870s to .79 in the 1890s. The GAR, however, remained steady, starting around .83 in the 1870s before shifting to approximately .75 for both the 1880s and the 1890s. NAWSA dues in the 1890s were correlated with modernization at .82. In the latter, we also find a similar increase in correlations between modernization and dues for the WCTU and the Grange, especially on the first factor, which is connected to manufacturing establishments per capita, street railway companies per capita, arc lamps per capita, and railroad miles per square mile. The first factor was also positive for the GAR across the three periods. The second factor, connected to wealth per capita, is oftentimes negatively signed. For NAWSA, both were positively correlated with state-level strength, at .41 for the first factor and .58 for the second factor.
Correlations between unweighted modernization measure and decade averages

a Non-Southern states only.
b All states.
c From 1875 to 1879.
Correlations between per capita modernization measures and decade averages (first factor on left and second factor on right)

a Non-Southern states only.
b All states.
c From 1875 to 1879.
*Outliers excluded (one for WCTU 1890s, two for NAWSA 1890s).
Both sets of correlations suggest that groups did not always start strongest in states that would become the most modernized in the last quarter of the century. For the WCTU and the Grange, the groups became stronger in states that were modernizing throughout the period.
Regression Models
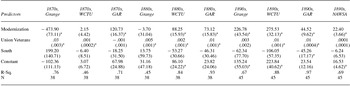
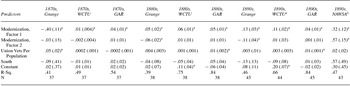
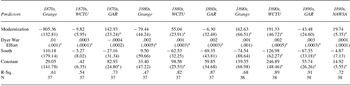
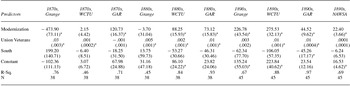
Next, we present ordinary least squares regression models with the unweighted dependent variable, by group and period.Footnote 13 These are shown in table 4. These results parallel the correlations presented in the preceding text. In the 1870s, modernization was statistically significantly and negatively related to the Grange, was statistically significant and positive for the GAR, and was not statistically significant for the WCTU. Union veterans, though, was positive and statistically significant only for the WCTU; it did not affect the strength of state-level GAR organizations.
Predicting state-level dues to national organization, by decade
Note: Ordinary least squares regression models.
*p < .05, two-tailed test.
By the 1880s and 1890s, however, the scenario changed. Other than the 1880s model for the Grange, modernization is a strong, positive, and statistically significant predictor of state-level dues to national organizations for all other groups and years.Footnote 14 The total number of Union veterans, as measured in 1890 by the census, is also statistically significant and positive for all but the NAWSA model and the Grange in the 1890s; its connection with the GAR was, as expected, the strongest of the relationships. Finally, the South dummy variable is only negative and statistically significant for the GAR in the 1890s, which, again, is not surprising given the group in question.
Overall, then, it can be said that states with more people, modernization, and veterans tended to also have stronger presences in national, federated, and politically motivated organizations. Other than the Grange in the 1880s, the r-squared values for the 1880s and 1890s models are all higher than .65, indicating that they are generally good fits for the data. Furthermore, the size of the effects is important, too. For example, a one-unit increase in modernization increases dues to the WCTU by 88.25 and 275.53 in the 1880s and 1890s, when the mean dues given to the national organization, from a state, were 148.92 and 332.99, respectively. Similar results appear for the GAR, with one-unit increases in modernization increasing dues 73.12 and 44.52 in the 1880s and 1890s, from means of 209.62 and 181.70. Modernization makes a difference in state-level dues paid to national organizations.
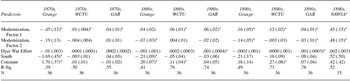
A second set of regression models using per capita, weighted measures is shown in table 5. Before proceeding, though, it should be noted that three outliers appear: two in the NAWSA model (Utah and Nevada) and one in the 1890s WCTU model (North Dakota). There are several reasons for these observations. First, all are low-population, Western states, making the measurement more sensitive to the presence of dues. Second, low population was often coupled with exceptional circumstances. Utah is truly exceptional, as the Mormon Church funded the group as a counterweight to negative publicity over polygamy (see White n.d.); once the state passed women's suffrage, donations dropped to zero. In that case, it was more of a front than an actual, independent organization. For Nevada, the state was admitted to the Union without the requisite population (60,000) in 1864 to help Lincoln's election, and it was still only at 42,335 by 1900 (in fact, dues to NAWSA came in sporadically from the state, but any dues coming in made it an outlier). And third, at other times, the outlier status simply indicated that small states could generate disproportional levels of support. North Dakota had attracted settlers from around the Northern states where the WCTU was prominent. These groups are removed from the models, as analysis of the distributions makes it clear that these cases do not follow trends common to the rest of the states. Nevertheless, they provide some evidence that groups can gain strength in a state, despite small populations and at times facing limited modernization.
Predicting population-weighted, state-level dues to national organization, by decade

Note: Ordinary least squares regression.
a Excluded one outlier (North Dakota).
b Excluded two outliers (Utah and Nevada).
*p < .05, two-tailed test.
Of primary interest in these regression models are the two modernization factors, with the first factor related to infrastructure and the second factor related to wealth and education. Except for the Grange in the 1870s (negative and statistically significant), the first modernization factor is positive and statistically significant in all other models; coefficients for this predictor also become larger in the later years for the Grange and the WCTU. This comports with our expectation that modernization would be more important in the 1880s and 1890s than in the 1870s. And, once more, modernization substantially shifts state-level dues. For examples, a one-unit increase in the first modernization factor (ranging from -1.69 to 1.98) leads to increases in weighted dues, anywhere from .04 (Grange, 1890s) to .32 (NAWSA, 1890s). In these two cases, the mean, population-weighted dues are .10 and 1.25, respectively. Infrastructure modernization, then, is vital to understanding state-level dues paid to national organizations.
The second modernization factor, after considering the other factor and the control variables, is statistically significant and negative in the Grange models and positive and statistically significant only for NAWSA. While wealth and education in the second factor seem related to the push for women's suffrage, it was the infrastructure modernization that fueled the Grange, WCTU, and GAR.
Furthermore, the Union veterans per capita measure is only statistically significant for the GAR in the 1880s and 1890s. It played a key role in predicting the strength of the GAR in these years; the R-squared for the 1870s model was .54, before increasing to .84 in both the 1880s and the 1890s. Combining this with the first modernization factor always being statistically significant, it suggests that the GAR's state-level strength was a confluence of postwar, civic capital merging with the seeds of, and then the rapid expansion of, modernizing forces. Finally, the South dummy is never statistically significant in any model.
These findings for the two per capita modernization factors provide insights into state-level group strength that are subtler than what could be provided by using only one model specification. The per capita models provide a basis for assessing relative group strength within each state. States with more modern infrastructure fostered the growth of the strongest state-level groups; per capita wealth and education were not as influential. Overall, this contrasts sharply with the raw data, where wealth and education expenditures were highly correlated and dominated the modernization factor.
Examining the Grange best reveals the subtleties of these findings. While modernization in the unweighted models mattered for understanding group strength only in the 1890s, the per capita measures reveal that the group became stronger between 1875 and 1900 in states where modern infrastructure was rapidly implemented, even if those states were not as wealthy or educated as some other states. Similarly, in examining the GAR, infrastructure appears to drive the results of the per capita models, even when compared to veterans per capita. Infrastructure is also particularly important in understanding the growth of the WCTU. In sum, then, the strongest state-level organizations for these groups, once we control for differences in population, developed in states with the highest levels of technical modernization from 1875 to 1900, and not necessarily in those with the most wealth and education.Footnote 15
Critically, the role of Union veterans, when considered alongside modernization in the regression models, is mixed. It is consistently a statistically significant predictor of group strength in the unweighted models, but this is not surprising because the population of Union veterans was higher in more populated states. Its role in the per capita models, however, is severely attenuated. Except for the GAR in the 1880s and 1890s, and the Grange in the 1870s, Union veterans per capita is not a statistically significant factor in understanding relative group strength. This is substantively important, as the per capita models provide a better picture of why strong, active state-level organizations developed; smaller population states are not penalized, so to speak, as they are in the raw models, where sheer size dictates the results. Thus, we can conclude that modernization had a more consistent effect across all decade specifications, and that it was more important for understanding relative group strength at the state level than veterans per capita.
Discussion and Conclusion
The findings presented here reveal that, across four national, voluntary, and federated membership associations, modernization is correlated with the strength of state-level affiliates in the late nineteenth century. The strongest (and typically most stable) politically oriented groups during this period were in modernizing states; the legacy of the Civil War mobilization was not nearly as powerful a predictor across groups. To borrow Crowley and Skocpol's (Reference Crowley and Skocpol2001) language, modernization appears to have propelled the civic ships borne from military conflict.
It was modernization, then, that generally led to the creation of stronger state-level voluntary associations. Modernization aiding the creation of stronger organizations is consistent across three of the four groups—the Grange, WCTU, and GAR— that were federated by 1875, even though their histories, goals, and potential pools of members were different; NAWSA, the fourth group, was stronger in modernized states in the 1890s, too. The Grange's ability to survive among farmers in modernizing states, after rapid growth and decline nationwide in the early 1870s, is not the same as the development of the WCTU, which grew consistently during this period despite its humble origins in the early 1870s. This, too, is distinct from the GAR, which faced the inevitable problem that its pool of potential participants, quite large in 1875, was quite literally dying off. Nevertheless, levels of modernization in 1900 were not strongly related to group strength in the 1870s (except for the GAR), but became much more predictive of strength by the 1880s and 1890s. This clearly indicates that modernization mattered to maintaining and/or increasing a group's strength at the state level. Conversely, the lack of modernization in a state served as an impediment to the creation of lasting organized interests.
This consistency is refined in the per capita models, where the results show, across models, that infrastructure modernization mattered more than wealth and education. The rapid technological changes in this era are significantly connected to the development of more robust state-level affiliates of federated, national voluntary associations. The presence of Union veterans, which is one way to measure the human, civic capital generated by the Civil War, still mattered at times. But, it was not as consistent a predictor of group strength, except in the case of state-level GAR affiliates (which was expected). In this case, the aftereffects of war mobilization were quite correlated with states that would, and did, modernize, and in the 1880s and 1890s. Overall, the results reveal that technological modernization during the postbellum period was a boon to the growth of stable, state-level voluntary associations.
These findings suggest opportunities for future research. From an interest group perspective, more work needs to be focused on how national group leaders and delegates to annual meetings shaped organizations’ development. Modern interest group scholars often note how leaders and active members can shape an organization's direction, whether it is the National Rifle Association (Patterson and Singer Reference Patterson, Singer, Cigler and Loomis2007) or environmental rights’ groups (Bosso Reference Bosso2005), and there is no reason to doubt that same is true here. In fact, it is likely that modernization in the late nineteenth century played a major role in sustaining and growing organizations by providing leaders with the communications, transportation, and resources necessary to create clear, unified goals and a national vision.
Relatedly, scholars should focus attention on modernization in earlier (and later) periods to identify what types of modernizing forces seem to correlate with the expansion of membership organizations. For example, the antebellum era did see advances in technology in communication, through the development of roads and canals, the postal service, and cheaper printing. These forms of modernization were not equally distributed across states, so it is probable that some states modernized earlier (and more rapidly) than others, allowing organizations to grow stronger through easier means of communication. Such a study would connect nicely to the work here, providing an overview of how modernizing forces helped to develop the interest group state by the early twentieth century.
Policy and legislative scholars could also examine whether the concentration of group support at the state level translated into positive legislative outcomes in Congress and state legislatures. For instance, did the WCTU's prominence in a particular state help the group influence the course of legislation in that state? Did group strength correlate to state and national representatives raising these groups’ concerns in debates? These questions are critical for connecting historical research on organized interests to actual policy outcomes.
Finally, scholars interested in American political development should think more critically about the connections between war mobilization and modernization when considering the formation and development of interest groups. Though they are distinct concepts, war can be a motivating factor that spurs innovation and modernization; likewise, modernization can lead to competition and create tensions that lead to conflict. It also does not help theoretical clarity when both can be considered “disturbances” that could spawn group formation (Truman Reference Truman1981). Perhaps it is pertinent to reinvigorate interest group research in these different historical eras, (see also Tichenor and Harris Reference Tichenor and Harris2002–3, Reference Tichenor and Harris2005), with the long-term goal of creating a more exacting, temporally long, yet theoretically relevant view of what causes interest groups to grow stronger.
In sum, the findings presented here provide a significant, new extension to the work on the formation of voluntary associations in the late nineteenth century. While more research is needed to refine the study of interest groups in this era, and, in the process, to advance interest group scholarship more broadly, it is clear modernizing forces played a substantial role in the continued existence and growth of interest organizations during the postbellum period.
Appendix
Averages dues, by group and decade, with standard deviation in parentheses

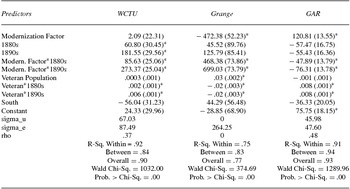
Random effects, panel regression models, with unweighted measures

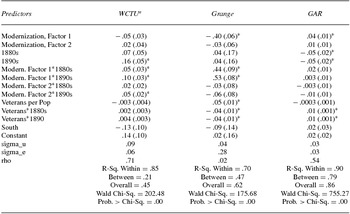
Random effects, panel regression models, with per capita measures

Predicting unweighted state-level dues to national organization, with Dyer measure

Predicting per capita state-level dues to national organization, with Dyer measure

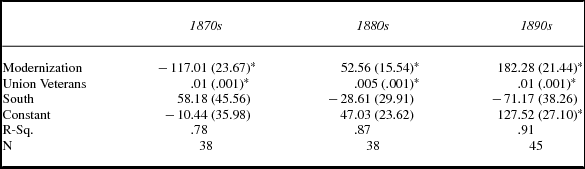
Predicting unweighted state-level dues to the WCTU, the Grange, and the GAR combined, by decade

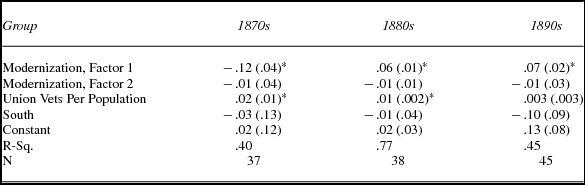
Predicting per capita state-level dues to the WCTU, the Grange, and the GAR combined, by decade

Predicting unweighted and per capita state-level dues to the WCTU, the Grange, and the GAR, including NAWSA, 1890s