Introduction
At present, breeding goals and strategies in pig husbandry shift from the quantitative parameters (percentage of lean meat, average daily gain, feed consumption, backfat thickness, etc.) to traits of meat quality. Fresh pork quality has become important and has received more attention as producers and processors try to meet consumer demand for high-quality pork. Many different traits (colour, pH, intramuscular fat (IMF), water-holding capacity, tenderness, flavour, etc.) have been investigated as indicators of consumer acceptance of fresh pork. Drip loss, tenderness and IMF are regarded the most important parameters to take into account in order to assess the quality of pork (Monin, Reference Monin1998; Eggert et al., Reference Eggert, Depreux, Schinkel, Grant and Gerrard2002; Mörlein et al., Reference Mörlein, Rosner, Brand, Jenderka and Wicke2005).
It is generally accepted that an increased level of IMF has a positive influence on the sensory qualities of pig meat (Fernandez et al., Reference Fernandez, Monin, Talmant, Mourot and Lebret1999). Greater amounts of IMF have been shown to positively impact sensory panel traits such as tenderness, juiciness and flavour, along with mechanical measures of tenderness (Hodgson et al., Reference Hodgson, Davis, Smith, Savell and Cross1991; NPPC, 1995; Huff-Lonergan et al., Reference Huff-Lonergan, Baas, Malek, Dekkers, Prusa and Rothshild2002). Bejerholm and Barton-Gade (Reference Bejerholm and Barton-Gade1986), Meyer (Reference Meyer1991) and Lutjens and Kalm (Reference Lutjens and Kalm1995) consider IMF content of 2% to 3% in longissimus dorsi (LD) muscle as optimal for the taste of pork. Majority of today’s selected breeds exhibit lower values.
Intramuscular fat equally distributed within whole muscle is desirable for technological processing and consumer acceptance as well. However, Wicke et al. (Reference Wicke, Heylen and von Lengerken1996) note that IMF is concentrated in clustered adipose cells and heterogeneously distributed within the muscle.
Heritability estimates for pork quality traits are low, with exception of IMF which has moderate to high values from 0.29 to 0.81 (Barton-Gade, Reference Barton-Gade1990; Cameron, Reference Cameron1990; de Vries et al., Reference de Vries, van der Wal, Long, Eikelenboom and Merks1994; NPPC, 1995; Schwörer et al., Reference Schwörer, Rebsamen and Lorenz1995; Knapp et al., Reference Knapp, William and Sölkner1997; Liu et al., Reference Liu, Berger, Goodwin and Christian1998). Therefore, the effective selection for this trait is possible.
Breeding programmes for improving muscle quality require the collection of measurements on the carcass. Direct selection, therefore, cannot be performed and breeding programmes are based on progeny testing or sib evaluation. The actual techniques to determine the meat-quality parameters are extremely time-consuming, expensive and destructive (van Oeckel et al., Reference van Oeckel, Warnants and Boucque1999; Leroy et al., Reference Leroy, Lambotte, Dotreppe, Lecocq, Istasse and Clinquart2003). An alternative is using the real-time ultrasound method (Newcom et al., Reference Newcom, Baas and Lampe2002; Ragland et al., Reference Ragland, Christian, Baas and Amin2002; Leaflet et al., Reference Leaflet, Schwab and Baas2006). This method has quite low costs, is easy to use and non-invasive.
The aim of this study was to assess the possibility of prediction of IMF in live pigs using ultrasound method, and to compare the accuracy of prediction.
Material and methods
Scanning of animals
Data were collected from 144 hybrid pigs, which were progeny of White Meaty sows mated Hampshire × Pietrain boars. Pigs were weighed and measured 1 to 3 days prior to slaughter by an ultrasound device ALOKA SSD-500 (ALOKA Co., Ltd, Tokyo, Japan) fitted with probe UST-5044-3.5 (3.5 MHz/172 mm). Cross-sectional images of LD muscle and subcutaneous fat overlying the loin muscle at right last rib area were taken. Each pig was scanned at the same ultrasound frequency (3.5 MHz) and at the five different ultrasound intensities: 70%, 75%, 80%, 85% and 90% of total amplifying of sonograph (described as ultrasound IMF – UIMF70, UIMF75, UIMF80, UIMF85 and UIMF90). The ultrasound measurements were performed by an experienced technician. Number of observations differed in dependence on intensity levels (from 133 at intensity level 90% to 144 at intensity levels 75%, 80% and 85%). Differences were due to loss of the images of worse quality (because of moving the animals at measurement, large absorption of ultrasound at a lower intensity level, large scattering effect at a higher intensity level and/or any other inaccuracy of technician). Vegetable oil was used as a conducting material between the probe and skin because of better adhesiveness to pig body than gel. The second reason to measure using vegetable oil was that the place of scanning was unshaved and oil penetrated the skin better. At scanning, the echocoupler connected to the probe was used to better adjusting to rounded contours of pig body and to capture whole muscle eye area. The ultrasonic images were digitized and stored in computer for evaluation.
Processing of images
The video image analysis was used to predict the content of IMF. Software LUCIA (User’s guide, System for Image Processing and Analysis; Laboratory Imaging, 2005) was applied. The method (peaks detection function) is based on enhancing small, light objects. The size of objects selected is determined by the size of the structuring element, which depends both on ‘Matrix Type’ (type of the structuring element with centre in enhanced pixel, used by elementary erosions and dilations) and ‘Number’ (number of algorithm repeats) parameters. This function enables the specific segmentation of the small objects through their exclusion from the larger objects and can also help in the case of non-homogeneous background. The video image analysis was carried out by one person. Estimation of IMF content was calculated as proportion of IMF area to total marked loin muscle area in the ultrasonic picture.
Killing and sample collection
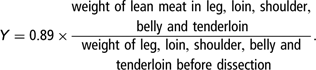
Pigs were slaughtered at 114.0 ± 9.17 kg live weight in experimental slaughterhouse of RIAP (Research Institute for Animal Production) in Nitra. Carcass chilling at air temperature 2°C to 4°C, air velocity 0.5 to 1.0 m/s started approximately 60 min post mortem and continued overnight. The second day after slaughter, the dissection of the right half of the carcass was done. A sample of LD muscle (approximately 100 g) at the last rib (the same place as where the ultrasonic images were made) was taken for laboratory analysis of IMF content (LAIMF) using device INFRATEC 1265 Meat Analyzer (CM Instruments Laboratorgeräte GmbH, Bünde, Germany). Carcass of pigs were dissected according to method of Walstra and Merkus (Reference Walstra and Merkus1996), and the percentage of lean meat was calculated as follows:
Statistical analysis
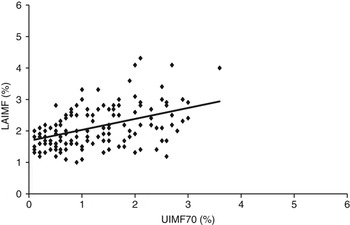
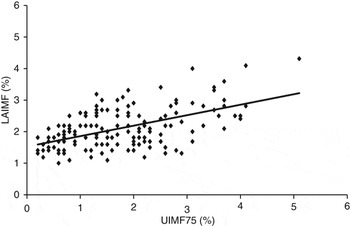
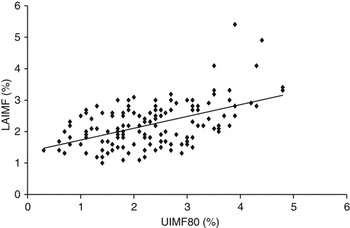
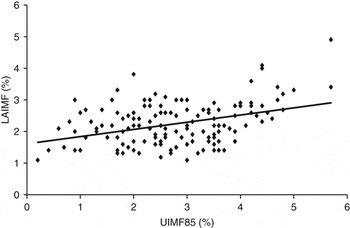
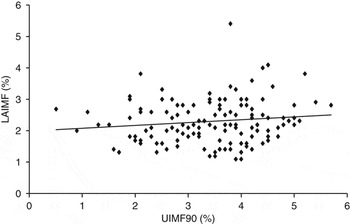
Statistical package SAS/STAT (2002–2003, version 9.1.3) was employed in the analyses. Basic statistics was done using MEANS procedure. To compare individual variability of raw data (Figures 1–5), scatter plots with UIMF at different intensity levels (UIMF70 to UIMF90) on the x-axis and LAIMF on the y-axis were produced. CORR procedure was used to calculate the Pearson’s correlation coefficients between UIMF70 to UIMF90 and LAIMF. The same statistical model (GLM procedure) was used to evaluate prediction ability of UIMF taken at various intensity levels:

where yij is the individual observation of LAIMF (%), μ is the intercept, Si is the fixed effect of sex ( ), Lij is the UIMF (%) taken at single intensity level (70%, 75%, 80%, 85% and 90%), i.e., UIMF70 to UIMF90, b 1 is the linear regression coefficient of dependence of LAIMF on UIMF, Wij is the live weight (kg), b 2 is the linear regression coefficient of dependence of LAIMF on live weight and eij is the random error N(0,σe 2)
To assess goodness-of-fit of the model, root mean square errors (RMSE) and standard errors of individual prediction (SEP) were calculated. The residuals were tested for normality (UNIVARIATE procedure).
Relationship between laboratory analysed (LAIMF) and ultrasound intramuscular fat taken at intensity level 70% (UIMF70).

Relationship between laboratory analysed (LAIMF) and ultrasound intramuscular fat taken at intensity level 75% (UIMF75).

Relationship between laboratory analysed (LAIMF) and ultrasound intramuscular fat taken at intensity level 80% (UIMF80).

Relationship between laboratory analysed (LAIMF) and ultrasound intramuscular fat taken at intensity level 85% (UIMF85).

Relationship between laboratory analysed (LAIMF) and ultrasound intramuscular fat taken at intensity level 90% (UIMF90).

Results
Basic statistics for carcass traits associated with animals in which the pairs of LAIMF and UIMF were available at different intensity levels (70%, 75%, 80%, 85% and 90%) are shown in Table 1. The values and standard deviations were almost the same. Standard deviations represented 7.73% to 8.17% of variability for carcass weight, 18.57% to 19.16% for backfat thickness and 7.69% to 7.87% for lean meat content.
Basic characteristics for carcass traits

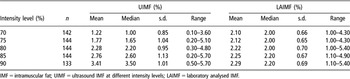
Basic statistics for UIMF taken at various intensity levels (UIMF70 to UIMF90) and LAIMF is shown in Table 2. The average UIMF increased with the intensity level applied and ranged from 1.22% to 3.41%; the average LAIMF showed a stabile pattern with values from 2.10% to 2.29%.
Basic statistics for ultrasound IMF taken at various intensity levels and laboratory analysed IMF (taken into account only measurements for which pairs of ultrasound and laboratory analysed values were available)

IMF = intramuscular fat; UIMF = ultrasound IMF at different intensity levels; LAIMF = laboratory analysed IMF.
Scatter plots (Figures 1–5) with UIMF on the x-axis and LAIMF on the y-axis were used for an empirical comparison of individual variability within and between intensity levels. The added trend lines were of increasing slopes and indicated a positive linear relationship. Nevertheless, the slopes slightly differed with one another. Regardless of intensity level, the scatter above and below the line was of similar stable behaviour. Few points out of constant distance from the respective lines indicated presence of possible outliers, which mainly occurred with the higher intensity levels. According to distribution of measurements, the lower intensity levels (70% and 75%) underestimated IMF content to some extent (more points fell between 0% and 1% UIMF). The higher intensity levels (85% and 90%) overestimated IMF content to some extent (more points were distributed in the region above 4% UIMF). With UIMF80, distribution of UIMF and LAIMF appeared the most balanced. However, it is difficult to conclude whether the intensity level 80% is the optimal with respect to minimum differences between UIMF and LAIMF.
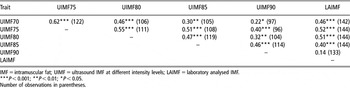
Pearson’s correlation coefficients between LAIMF and UIMF are presented in Table 3. Significant correlations were found between LAIMF and UIMF70 to UIMF85, except for UIMF90. The strongest relations were observed between LAIMF and UIMF75 and/or UIMF80.
Pearson’s correlation coefficients between ultrasound and laboratory analysed IMF

IMF = intramuscular fat; UIMF = ultrasound IMF at different intensity levels; LAIMF = laboratory analysed IMF.
***P < 0.001; **P < 0.01; *P < 0.05.
Number of observations in parentheses.
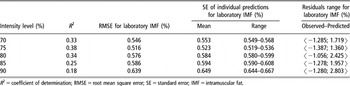
Goodness-of-fit of the model is shown in Table 4. The model explained 17% (UIMF90 covariate) to 34%–38% (UIMF80 or UIMF75 covariate) of total variability of LAIMF. RMSE ranged from 0.516% (UIMF75 covariate) to 0.639% (UIMF90 covariate). SEP ranged from 0.519% to 0.536% (UIMF75 covariate) and from 0.644% to 0.667% (UIMF90 covariate).
Criteria to assess goodness-of-fit of the model

R 2 = coefficient of determination; RMSE = root mean square error; SE = standard error; IMF = intramuscular fat.
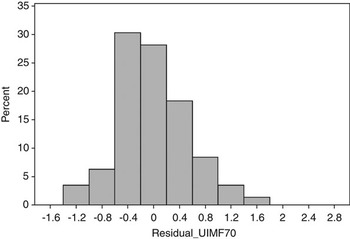
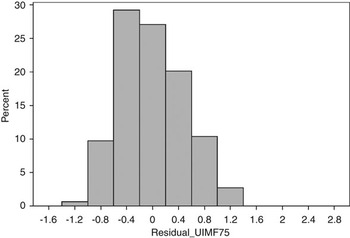
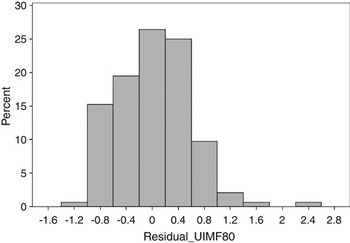
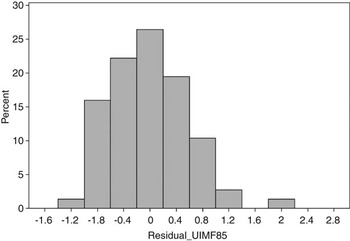
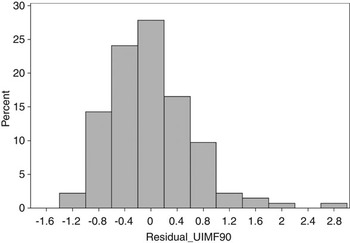
Distributions of residuals are given in Figures 6–10. The highest frequency over the bin with the lowest differences between observed and predicted LAIMF (i.e., residuals from −0.2 to +0.2) was found when UIMF70 or UIMF75 (about 28% or 27%) was involved in the model. With UIMF80 considered as the covariate, frequency of residuals between −0.2 to +0.2 was slightly lower (about 25%). However, the residuals over adjacent bins followed the normal distribution to a greater extent (no skewness over the bin between −0.6 and −0.2 observed) than with UIMF70 and UIMF75, although some outliers were found. These findings contrast to some extent with findings based on comparisons of R 2, RMSE and SEP, which were more appropriate with UIMF75 covariate; on the other hand, they support belief that according to investigations on individual scatter plots, UIMF80 seems to give promising results.
Histogram of residuals (covariate ultrasound measurement taken at intensity level 70%).

Histogram of residuals (covariate ultrasound measurement taken at intensity level 75%).

Histogram of residuals (covariate ultrasound measurement taken at intensity level 80%).

Histogram of residuals (covariate ultrasound measurement taken at intensity level 85%).

Histogram of residuals (covariate ultrasound measurement taken at intensity level 90%).

Discussion
The IMF influences expressively typical properties of pork. Its equal distribution within the muscles is desirable from the point of view of processors and consumers. As stated by Faucitano et al. (Reference Faucitano, Huff, Teuscher, Gariepy and Wegner2005), the IMF is distributed in higher number of finer fat areas. Furthermore, if fat is finely distributed, higher contents of IMF can be reached in the loin without negative attitude of the consumer. Authors have found highly significant correlation (r = 0.57) between total marbling area and LAIMF.
Several studies to evaluate the accuracy of ultrasound in predicting IMF can be found in the literature. Dion et al. (Reference Dion, Pettigrew and Daigle1996) predicted marbling score in pigs with real-time ultrasonic cross-sectional and longitudinal scans. The accuracy of prediction was essentially zero. In our study, correlations between LAIMF and UIMF ranged from 0.14 (P > 0.05) to 0.52 (P < 0.001). Similar correlations (r = 0.46 to 0.60; r = 0.50) between predicted IMF and that from carcass samples were reported by Newcom et al. (Reference Newcom, Baas and Lampe2002 and Reference Newcom, Baas, Stalder and Schwab2005). The higher correlations (r = 0.70; r = 0.52 to 0.71) between analysed and predicted IMF were found by Ragland et al. (Reference Ragland, Brondum, Baas and Christian1997) and Ragland (Reference Ragland1998). Bahelka et al. (Reference Bahelka, Demo, Tomka and Lahučký2006 and Reference Bahelka, Tomka and Hanusová2007) reported correlations between LAIMF and UIMF at three different intensity levels ranging from 0.13 to 0.26 (frequency 5.0 MHz), from 0.13 to 0.31 and from 0.09 to 0.18 (frequency 3.5 and/or 5.0 MHz).
Grouping the data into three classes with ⩽2.0% IMF, 2% to 4% IMF or >4.0% IMF (either LAIMF or UIMF) allows for a comparison with the results from Newcom et al. (Reference Newcom, Baas and Lampe2002) and Ragland et al. (Reference Ragland, Christian, Baas and Amin2002). In our study, the lowest differences in proportion of data (pigs) in each class of IMF were found when LAIMF was investigated against UIMF taken at intensity level 80% (0.424 v. 0.456 with ⩽2.0% IMF, 0.535 v. 0.527 with 2% to 4% IMF, 0.041 v. 0.017 with >4.0% IMF). This supports the findings based on investigations of individual variability plots, which intensity level could be recommended for ultrasound measurements. Slightly higher differences were found with UIMF75 (0.456 v. 0.646 with ⩽2.0% IMF, 0.527 v. 0.333 with 2% to 4% IMF, 0.017 v. 0.021 with >4.0% IMF). Thus, the differences in proportion of our data (with UIMF75 and UIMF80, respectively) were lower than or almost the same as the differences found by the cited authors. Newcom et al. (Reference Newcom, Baas and Lampe2002), who investigated a population of 622 Duroc and Yorkshire barrows and gilts with off-test weight 122.8 ± 9.9 kg, reported the proportion of pigs classified over the above three classes as follows: 0.280, 0.580 and 0.140 for carcass IMF and 0.010, 0.510 and 0.480 for predicted IMF. Ragland et al. (Reference Ragland, Christian, Baas and Amin2002) analysed 350 images, collected as a part of the 1995 National Barrow Show Progeny Test and the 1996 Livestock Producer Assistance Program test, which belonged to animals with off-test weight about 240 lb and of the eight major breeds and crossbreeds (as tested at the Northeast Iowa State Improvement Association Station), and reported the differences between actual and ultrasound IMF about 0.200 with classes ⩽2.0% and 2% to 4% IMF. The difference in proportion of data in class >4.0% IMF was lower, however, no pig was classified in this interval according to UIMF.
Coefficients of determination (R 2) ranged from 0.17 (UIMF90 covariate) to 0.38 (UIMF75 covariate). Except for intensity level 90%, the highest proportion of variability of LAIMF (about 2/3) separated through the model applied was due to differences in UIMF. The remaining proportion of variability was due to sex and live weight. When only UIMF was considered the independent variable, R 2 were lower and ranged from 0.15 to 0.28. The only exception was UIMF90 with R 2 < 0.05. R 2 between 0.33 and 0.38 were in agreement with findings of Ragland et al. (Reference Ragland, Christian, Baas and Amin2002), who reported R 2 = 0.33 to 0.38, of Newcom et al. (Reference Newcom, Baas and Lampe2002), who reported R 2 = 0.32 and of Leaflet et al. (Reference Leaflet, Schwab and Baas2006), who reported R 2 = 0.36. Depending on hybrid combination evaluated and traits involved in the model equation (either linear or quadratic term), Eggert and Schinckel (Reference Eggert and Schinckel1998) reported R 2 ranging from 0.50 to 0.83.
RMSE and SEP ranged from 0.516 to 0.639 and from 0.523 to 0.649 with the lowest values found when UIMF75 was considered as the covariate. Ragland et al. (Reference Ragland, Christian, Baas and Amin2002) found mean square error (MSE) in the range between 1.04 and 1.12, in dependence on prediction equations. The higher MSE (1.31% and 1.02%) were reported by Leaflet et al. (Reference Leaflet, Schwab and Baas2006) and Newcom et al. (Reference Newcom, Baas and Lampe2002). Newcom et al. (Reference Newcom, Baas and Lampe2002) and Ragland et al. (Reference Ragland, Brondum, Baas and Christian1997 and Reference Ragland, Christian, Baas and Amin2002) also reported the higher SEP: 0.80% to 0.93%; 0.83% and 0.96%.
The biggest problem to determine the accuracy of prediction is correct estimation of IMF content in ultrasonic images. In the muscles, blood capillaries are situated that are considered by sonograph devices as excessive marbling of muscle – so called ‘scattering effect’ (very bright spots in the screen). This effect is closely connected with intensity level and frequency of ultrasound. It is demonstrated at the higher frequency and intensity level. Using the lower frequency and intensity, ‘scattering effect’ is suppressed but it results in higher absorption of ultrasound and marbling is fading. This opinion is in agreement with Leaflet et al. (Reference Leaflet, Schwab and Baas2006), who state that ultrasonic images are heavily influenced by system settings, technician experiences and various other conditions such as temperature, animal preparation and electrical interference. Whittaker et al. (Reference Whittaker, Park, Thane, Miller and Sawell1992) also showed the scattering effect and absorption to be the main factors influencing interpretation of sonograms. The greater scattering effect in images of LD muscle is due to high frequency of the probe used and very high ultrasound intensity applied. On the other hand, lower the ultrasound frequency and intensity applied, higher is the absorption.
The classification of pigs according to absolute values of residuals between observed and predicted IMF indicates the accuracy of prediction. In all, 96% of residuals (Int75 and Int80) were ⩽1%. Ragland (Reference Ragland1998) reported predicted IMF within 1% of carcass IMF in 72% to 86% of the observations, depending on the model.
Because of high importance of IMF for eating quality of pork, there was a high interest to introduce this trait into selection programmes: in USA (Leaflet et al., Reference Leaflet, Schwab and Baas2006), in the Netherlands (Bergsma, Reference Bergsma2004) and in Switzerland (von Rohr et al., Reference von Rohr, Hofer and Künzi1999). On the other hand, Rosner et al. (Reference Rosner, von Lengerken and Maak2003) reported that IMF was not integrated into the breeding and selection programmes in Germany as it was not included in the payment system for pork. They assumed that development of methods to measure IMF in live animals (e.g., ultrasound) might contribute to solve this problem. Newcom et al. (Reference Newcom, Baas and Stalder2003) found that after one generation of selection for IMF, the average estimated breeding value (EBV) for selected line was 0.50% greater than for control line. After four generations of selection for IMF, Schwab et al. (Reference Schwab, Baas, Berry, Mote and Stalder2005) found the average EBV for select line 1.03% greater than for control line. Suzuki et al. (Reference Suzuki, Kadowaki, Shibata, Uchida and Nishida2005) reported the average BV 1.20% greater in the seventh generation of Duroc pigs than in the first.
The results presented in this study document the ability to measure IMF in live pigs using ultrasound method. Although they are not quite unequivocal in favour of the one intensity level, it seems that intensity levels 75% and 80% are the most suitable to predict IMF in live pigs. However, further research is needed, mainly to increase the accuracy of collecting, processing and evaluating the sonograms using video image analysis.