1. Introduction
Google announced that the operating system after the Android 7.0 would open an application programming interface (API) for obtaining raw GNSS (Global Navigation Satellite System) observations in ‘I/O of 2016’. This allows researchers to develop the algorithms for accurate position estimation with Android smart devices. Initially, Pesyna et al. demonstrated that it is indeed possible to achieve centimetre-accurate positioning with a smartphone by applying real-time kinematic (RTK) techniques in a static ideal environment (Pesyna et al., Reference Pesyna, Heath and Humphreys2014). For this goal, several studies on positioning algorithms for Android smartphones were conducted, in which observation analysis and positioning algorithms update were the two major parts (Paziewski, Reference Paziewski2020).
The characteristic of raw measurements has become a key subject of positioning research on smartphones, typically including signal intensity and data noise. Previous research conducted by Pesyna et al. indicated that the carrier-to-noise ratio (C/N0) of smartphones is about 10 dB-Hz lower than that of geodetic receivers (Pesyna et al., Reference Pesyna, Heath and Humphreys2014). This means that the signal power of smartphone GNSS antennas is approximately 8% of survey-grade antennas. Furthermore, Zhang et al. confirmed this result by analysing the data from a Nexus tablet (Zhang et al., Reference Zhang, Tao, Zhu, Shi and Wang2018). Generally, signal power could be influenced by multipath, and Humphreys et al. demonstrated that multipath affects the signal strength of smartphones deeply (Humphreys et al., Reference Humphreys, Murrian, van Diggelen, Podshivalov and Pesyna2016). Gogoi et al. placed the phones in a controlled-environment anechoic chamber for experiment and proved this view (Gogoi et al., Reference Gogoi, Minetto, Linty and Dovis2019). Due to the poor quality of the signal strength, the measurement noise of smartphones is larger than that of geodetic receivers. Li et al. applied a third-derivative approach to estimate the noise of measurement from a Nexus 9, Samsung Galaxy S8 and Huawei Honor v8 (Li and Geng, Reference Li and Geng2019). The study reported that the code noise of the phones is about 10 times that of the receiver, and the carrier phase noise is about 3–5 times. Lachapelle et al. reached a similar conclusion from the research on a Huawei P10 (Lachapelle and Gratton, Reference Lachapelle and Gratton2019). Paziewiski et al. proposed a short baseline double-differenced (DD) method to calculate the data noise and found that the measurement noise of the Huawei P20 is obviously greater than that of geodetic receivers (Paziewski et al., Reference Paziewski, Sieradzki and Baryla2019). In summary, the quality of raw GNSS measurement on smartphones is obviously weaker than that on geodetic receivers.
As a response to the data difference between smartphones and geodetic receivers, the positioning algorithms of the smartphone should be studied in depth. Initially, Banville and Diggelen conducted a precision-positioning experiment with a Samsung Galaxy S7 and obtained a decimetre-level positioning result (Banville and Diggelen, Reference Banville and Diggelen2016). Sikirica et al. focus on the single-point positioning (SPP) method (Sikirica et al., Reference Sikirica, Malic, Rumora and Filjar2017). They used this method on a Huawei P10 and demonstrated that the positioning accuracy can reach 10 m. For the precise point-positioning (PPP) model, Wu et al. adopted the mobile dual-frequency PPP model and obtained decimetre-level positioning accuracy (Wu et al., Reference Wu, Sun, Zhou and Zhang2019). In addition, Chen et al. improved the PPP model with dual-clock difference parameters (Realini et al., Reference Realini, Caldera, Pertusini and Sampietro2017; Chen et al., Reference Chen, Gao, Liu and Sun2019). Geng et al. developed a three-threshold and single-difference (TT-SD) Hatch filter method which considers the characteristic of smartphone GNSS measurements. They reported that submetre-level accuracy can be achieved under dynamic or static conditions. Moreover, a large number of studies focus on a differential positioning method on smartphones. The results of different models show that the decimetre-level accuracy positioning result can be reached, at the least (Dabove and Di Pietra, Reference Dabove and Di Pietra2019a, Reference Dabove and Di Pietra2019b; Geng et al., Reference Geng, Jiang, Li, Xin and Wei2019; Liu et al., Reference Liu, Shi, Zhu, Tao and Wang2019a; Zhang et al., Reference Zhang, Jiao, Wang, Li, Li and Zhou2019). Furthermore, Geng et al. proved the possibility of ambiguity fixing under the data pre-processing (Geng and Li, Reference Geng and Li2019), and the centimetre-accuracy result is available after ambiguity resolution (AR).
It has been proved that the Doppler measurement is also practical for GNSS positioning by providing additional information (Zhang et al., Reference Zhang, Jiao, Wang, Li, Li and Zhou2019). However, the current studies on smartphone positioningmainly focus on the characteristic of code and carrier phase measurement, and lack of the quality evaluation of the Doppler from smartphones. In this paper, we aimed to analyse the characteristic of Doppler measurement from smartphones and its position-aiding performance. Firstly, the noise estimation method was introduced, and then we analysed the characteristic of Doppler measurement in four aspects. Thirdly, the performance of the Doppler-aided positioning algorithm in dynamic experiments was validated. Finally, the conclusions of this paper are presented.
2. Methodology
This section provides the approach to data processing used in this study. Firstly, we introduce the noise estimation method and then reviewed the algorithm for velocity estimation. Finally, the Doppler-aid positioning algorithm is introduced.
2.1 Noise estimation
The code, phase and Doppler measurements between the satellite s and the receiver $r$ can be expressed as (Zhou and Li, Reference Zhou and Li2016):

where P, ${\lambda _i}\mathrm{\Phi }$ and ${\lambda _i}D$
 are, respectively, the code, carrier phase and Doppler in metres and in metres/second; $\rho$
 is the distance between the receiver and the satellite; $\dot{\rho }$
 is the change rate of the distance; $dt$
 and $dT$
 represent the receiver and satellite clock offsets; $d\dot{t}$
 and $d\dot{T}$
 are the change rate of clock offsets; $I$
 and $T$
 are the ionospheric delay and tropospheric delay; $\dot{I}$
 and $\dot{T}$
 are the change rate of I; T, ${d_{r,i}}$
 and $d_i^s$
 represent the receiver and satellite code hardware delays; $m_{r,i}^s$
 is code multipath delay; ${\lambda _i}$
 indicates the wavelength for carrier frequency i; $N_{r,i}^s$
 is the integer ambiguity; ${\phi _{r,0,i}}$
 and $\phi _{0,i}^s$
 are the initial phase of the receiver and the satellites, respectively; ${\delta _{r,i}}$
 and $\delta _i^s$
 are hardware delays of phase; $M_{r,i}^s$
 is the carrier multipath delay, and $\dot{M}_{r,i}^s$
 is the change rate of it; $d\mathrm{\Phi }_{r,i}^s$
 is the phase correction term which includes phase centre offsets, earth tides, and relativity correction; and ${\epsilon _{P_{r,i}^s}}$
 , ${\epsilon _{\mathrm{\Phi }_{r,i}^s}}$
 and ${\epsilon _{D_{r,i}^s}}$
 are the noises.
We used the third-derivative approach to estimate the residual of carrier phase measurements for eliminating the ambiguities. The form of the approach is:

where ${\epsilon _L}$ is the residual; $L(k )$
 indicates the code, phase or Doppler measurement; $k$
 is the observed epoch; and $\mathrm{\Delta }t$
 is the sampling interval. $\frac{1}{{\sqrt {20} }}$
 is the normalisation factor calculated by the error propagation law. The third-derivative approach requires data that are continuous and acquired with a high sampling rate. In addition, the approach cannot separate the clock noise (Pirazzi et al., Reference Pirazzi, Mazzoni, Biagi and Crespi2017). Note that cycle slips will lead to an incorrect estimation of carrier noise. In this paper, we detected the cycle slips by combining the carrier and Doppler measurements. The method is based on the single-differenced (SD) carrier and Doppler observations between satellites, and it can be expressed as:

where the m and n are, respectively, the reference satellite and another satellite; and $\xi$ is an empirical constant that is set to 1 m in this paper. A detailed introduction to this method can be found in Geng and Li (Reference Geng and Li2019). In reality, the result of this method could be influenced by a small cycle slip, but we estimate this to be infrequent and tolerable. In addition, it is hard to mark the cycle slip on carrier phase of m or n specially. However, we apply the DD observation for noise estimation, and it will not affect the calculation if we delete the pairs of carrier phase of satellites.
We use the short-baseline DD observation to calculate the data noise in this paper, as the ionospheric and tropospheric delays can be eliminated in this case. The data was collected in an open-sky environment, and multipath can be ignored. Note that the precise position of the phones and reference receiver was known, and we can get the geodetic distance by it. Furthermore, the velocity of smartphones is 0 m/s since they are static, and the satellites’ velocity can be calculated using ultra-rapid precise ephemeris. Therefore, the distance change rate can be estimated and eliminated as well. In summary, the DD observation can be expressed as:

where r and b are the rover and reference receivers; j and k are different satellites; $(\,{\cdot}\, )_{rb,i}^{jk}$ represents the DD observations; $\rho _{rb,0}^{jk}$
 and $\dot{\rho }_{rb,0}^{jk}$
 are the distance and its change rate, which are calculated by the known position and velocity of smartphones and satellites; $B_{rb,i}^{jk}$
 is the DD phase bias in cycle, which includes DD ambiguity and other unknown errors, and mainly manifests as low-frequency changes; $\hat{P}_{rb,i}^{jk}$
 , $\mathrm{\hat{\Phi }}_{rb,i}^{jk}$
 and $\hat{D}_{rb,i}^{jk}$
 are the DD code, DD carrier and DD Doppler observations, respectively, that have deleted the distance or distance rate. According to the existing studies, the accuracy of the receiver observation is much better than that of smartphones. In this paper, the influence of the receiver observation error is ignored. The approach to residual calculation is then:

2.2 Velocity calculation
The Doppler measurement can be used to calculate the velocity of the receiver. For the Doppler measurement in Equation (1), when the sampling rate is high enough, we can ignore the influence of the atmospheric rate delays and multipath rate. Then the Doppler measurement can be transformed into:

The distance rate can be calculated as:

where $e_{r,x}^s$ , $e_{r,y}^s$
 and $e_{r,z}^s$
 are the cosine functions of the satellite s; and ${\boldsymbol{v}^s}$
 and ${\boldsymbol{v}_r}$
 are the velocity of satellites and the smartphone, respectively. When the number of satellites is greater than 4, the velocity can be calculated by the least square method:

where ${\boldsymbol{x}_r}$ is the unknown parameters vector, including velocity and clock rate; ${\boldsymbol{x}_{r,0}}$
 is the initial parameters; $\boldsymbol{B}$
 is the design matrix; $\boldsymbol{P}$
 is the weight matrix for all satellites; and $\boldsymbol{L}$
 is the observation vector. These quantities are defined as:

where $\dot{\rho }_{r,0}^s$ and $cd{\dot{t}_0}$
 are the initial velocity and clock rate of the receiver, respectively; and $\textrm{diag}\left( {\begin{array}{*{20}{c}} {\sigma_1^{ - 2}}& {\sigma_2^{ - 2}}& \cdots & {\sigma_s^{ - 2}} \end{array}} \right)$
 is a diagonal matrix in which components are the inverse of the Dopplers’ variances, which is calculated using the C/N0-based stochastic model that is established in this paper.
2.3 Doppler-aided positioning algorithm
The velocity of the smartphone is quite important in the dynamic situation. There are two common models to describe the movement state. One is the constant velocity (CV) model and the other is the constant acceleration (CA) model (Yang, Reference Yang2017). Because of the high sampling rate of smartphones’ GNSS measurement collection, the CA model is more applicable, and we used it in this paper.
Kalman filter is adopted to estimate the parameters. The state equation and measurement equation of the filter are:

where k is the epoch; $\boldsymbol{X}$ and $\boldsymbol{F}$
 represent the state vector and the transition matrix, respectively; B is the design matrix; L is the measurement vector; and $\boldsymbol{w}$
 and $\boldsymbol{v}$
 represent the system noise vector and the observation noise vector, respectively. Generally, it is assumed that the system noise and observation noise are not correlated with each other and conform to the characteristics of Gaussian white noise. The variance–covariance (VC) matrix of the system is expressed as ${\boldsymbol{Q}_k}$
 , and the VC matrix of the measurement is ${\boldsymbol{R}_k}$
 . Under dynamic conditions, the specific representation of these vectors is:

where r, v and a are, respectively, positions, velocity and acceleration in ECEF frame. Moreover, $\mathrm{\Delta }t$ is the sampling interval; ${\boldsymbol{Q}_r}$
 , ${\boldsymbol{Q}_v}$
 , ${\boldsymbol{Q}_a}$
 and ${\boldsymbol{Q}_N}$
 represent the system noise matrix of position, velocity, acceleration and the carrier phase ambiguities, respectively; $\boldsymbol{I}$
 is an identity matrix for ambiguities transition; and ${\otimes}$
 represents the Kronecker product. Note that we neglected the atmospheric delay, including tropospheric and ionospheric delay, since the reference station is near the smartphones. In addition, clock offsets are eliminated by the DD processing. In this paper, we used the ‘Current’ model to calculate the system noise matrix of the acceleration parameters (Yang, Reference Yang2017). In addition, the observation noise matrix is calculated using the results described in Section 3.3.
When fusing Doppler data for dynamic positioning, the observation value vector and design matrix form are:

where $\hat{\boldsymbol{I}}$ is a matrix which relates to the subvector of carrier phase ambiguities; and P, ${\Phi }$
 and $- \boldsymbol{\lambda D}$
 are the code, carrier phase and Doppler measurements.
3. Characterisations of Doppler measurement on smartphones
In this section, we introduce the characteristics of smartphones’ Doppler measurement. Doppler data availability of different phones was compared first. Then we analysed the code rate and phase rate minus Doppler. According to these results, the limitation in DSC is discussed (Zhou and Li, Reference Zhou and Li2016). Thirdly, the noise of Doppler was calculated. Finally, we analysed the velocity calculation performance.
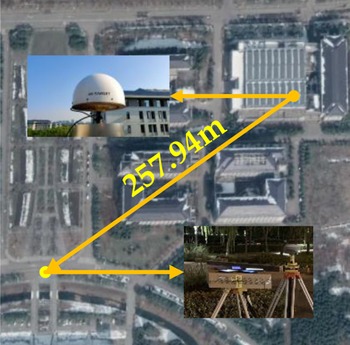
In this part, observation under the static situation was performed to analyse the characteristics of the Doppler measurements from smartphones. We utilised a Xiaomi MI8, a Huawei P30 and a Huawei P40, since all of these smartphones can obtain the raw code, carrier phase and Doppler measurements, which is helpful for the data analysis. Measurements are collected by the GEO++ APP and the sampling rate is 1 Hz, and the cut-off elevation is 10° (Geo++ GmbH., 2018). The observation date is day of year (DOY) 110 of 2021, and the observation time length is 1827 s. The distance between the phones and the reference station is 257 ⋅ 94 m, and the relative position is shown later. The specific information about smartphones is detailed in Figure 1 and Table 1.
Relative position of the smartphones and the reference station

Android smartphones

3.1 Data availability
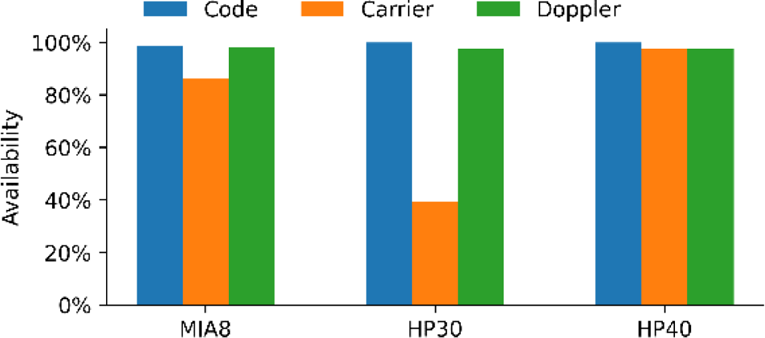
Data availability is an important indicator to assess its suitability for positioning. During the positioning process, we needed to detect the errors and eliminate them, so data availability cannot always reach 100%. In this paper, the geometry-fixed (GFix) model was applied to detect the outliers in code and Doppler measurements (Yuan et al., Reference Yuan, Zhang, He, Li and Wang2022). Specifically, the known position and velocity can be added to the observation to eliminate their influence. In addition, we estimate the ionosphere and troposphere by the Klobuchar model and Saastamoinen model, respectively, and the satellite clock offset was calculated using ephemeris. Overall, only the receiver clock offset should be estimated in an epoch. And we can detect the errors in the estimation. As for the carrier phase, a measurement with cycle slip was treated as an outlier, because that cycle slip repairing for carriers from smartphones is difficult. The method for cycle slip detection was introduced in Section 2.1. The data availability of the three smartphones is detailed in Figure 2 and in Table 2. Note that the numerical result in the figure and the table is aggregated data for the GPS, BDS and Galileo system on all available frequencies.
Data availability of three smartphones

Data availability of three smartphones

It can be seen from Table 2 that the code and Doppler availabilities are greater than 97%, while the phase availability is significantly smaller. Especially for HP30, it is only 39 ⋅ 31%. Further analysis indicates that the reason for the low phase availability is that HP30 suffers from frequent cycle slips. Therefore, the DSC method is more suitable for HP30 compared with the carrier-phase smoothed code (CPSC) method, because we should repair the phase or initial the smoothing window when the cycle slips occur, and numerous cycle slips can degrade smoothing performance.
Detailed information on the data availability of the three smartphones is illustrated in Figure 3, where subfigures (a), (b) and (c) are, respectively, the result of code, Doppler and carrier phase, and the red line in the figures represents the 90% availability. Note that the carrier measurement of the GLONASS constellation is not available on Huawei phones, so the analysis of GLONASS observation from the HP30 and HP40 is not contained in the figure. Figure 3(a) shows the code availability, depicting that the value is higher than 90% for the three smartphones and there is no obvious difference between the three phones. It indicates that the code availability of the smartphone is ideal. In this case, the position could always be provided to users by the single-point positioning (SPP) method. Figure 3(b) depicts the information on Doppler measurement. Similar to the code, the availability of Doppler is higher than 90%, which means that the Doppler observation is indeed relevant for the DSC method in smartphones. However, the availability on E1 of HP30 and HP40 is imperfect compared to the MIA8, which could negatively impact DSC. Figure 3(c) represents the information about the carrier phase. It is obvious that the carrier usability of HP30 is unsatisfactory, and the value is smaller than 50% in most frequencies. This indicates that the CPSC cannot work well in the HP30. In addition, carrier measurement from MIA8 on B1 is imperfect. Overall, the carrier phase from HP40 is the most stable, and it is positive for high-accuracy positioning.
Data availability on different frequencies of the three smartphones

3.2 Bias between data rate and Doppler
Generally, the Doppler can be treated as the code or carrier change rate when the atmospheric delay rate is neglected. In other words, when we use the data rate minus the Doppler, the result should stay around zero. However, this goal cannot always be reached for some types of smartphones because of the difference in clock offsets. In terms of the CPSC and DSC methods, the impact should be taken into consideration. To solve this problem, Liu et al. suggested that the size of the smoothing window of all satellites should be equal (Liu et al., Reference Liu, Gao, Chen and Zhang2019b), and Geng et al. adopted a single-difference between the satellites smoothing method (Geng et al., Reference Geng, Jiang, Li, Xin and Wei2019).
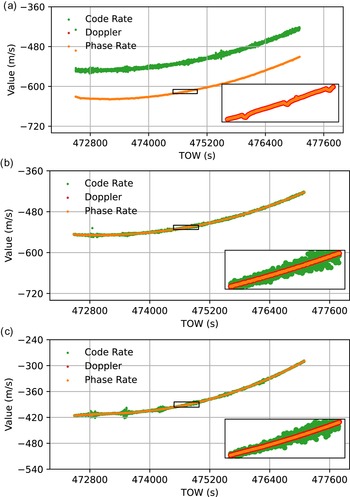
In this section, the bias between the Doppler observation and code or carrier phase rate is calculated by the raw observations. An analysis of this bias is presented, as it is important for applications of CPSC and DSC methods. Note that we named the bias as code IRDB (Inter-Rate-Doppler Bias) and carrier IRDB for convenience. The data change rate and Doppler observations of the three smartphones are shown in Figure 4. We only plot the data on L1 frequency of G10 satellite in these plots, and similar features can be found on the data of other satellites. Green points, red points and orange points in the figure are, respectively, the code rate, Doppler and phase rate. For the HP30 and HP40, it is obvious that the three types of data are overlapping over periods, which means that the data are equivalent. However, the code rate of MIA8 is separated from phase rate and Doppler, which means that code rate is not equal to Doppler observations, and an extra process is necessary in the DSC method on this smartphone.
Date rate and Doppler values of the three smartphones. (a) MIA8. (b) HP30. (c) HP40

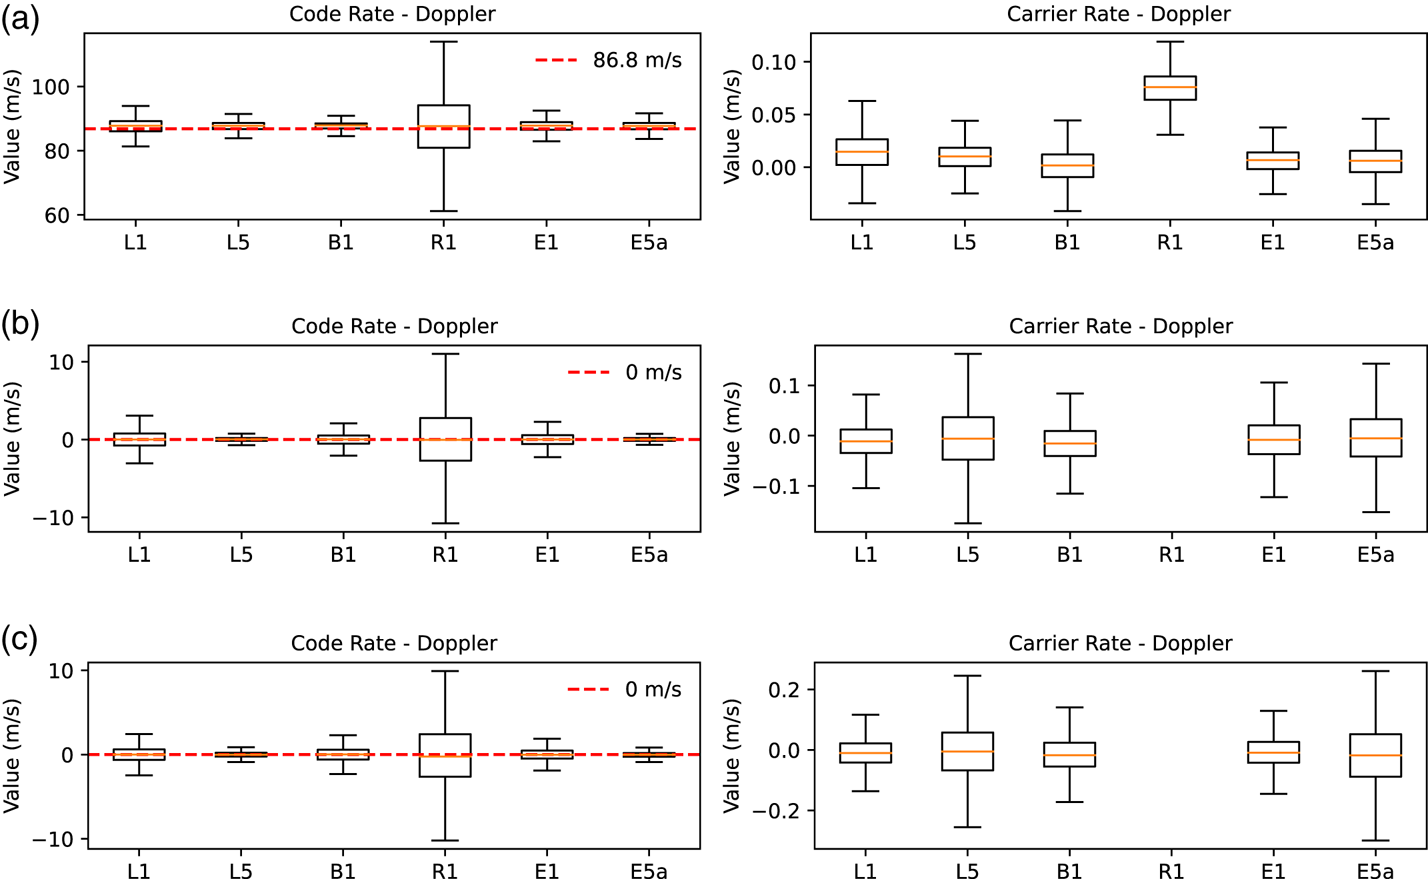
Code IRDBs and carrier IRDBs of all visible satellites are depicted in Figure 5 under the boxplot, in which a box represents statistical values for the different carrier frequencies of the GNSS systems. From the left panel of the figure, it is intuitive that the code IRDB and carrier IRDB of the three smartphones are stable, and the average value for different frequencies stays around a certain value. This means that the DSC method is feasible for the three smartphones. Specifically, we can find that the code IRDB of the HP30 and HP40 is close to 0, which indicates that the influence of the bias can be ignored. However, the code IRDB of the MIA8 is about 86 ⋅ 8 m/s, which means that constrained processing is necessary for the DSC. In addition, the box range on the R1 is absolutely wider than the others, which indicates that the code noise on the R1 is the largest.
Code IRDB and carrier IRDB of three smartphones. (a) MIA8. (b) HP30. (c) HP40

The right panel of the figure depicts the carrier IRDB of the three smartphones. Similar to the code IRDB, the value is stable for all the phones. The difference is mainly in the MIA8, and the carrier is also around the 0, which is different from the code IRDB. In this case, Doppler can also be applied in cycle-slip detection. Nevertheless, there is a bias on the R1 of the MIA8, and this should be taken into consideration when applying the carrier or Doppler on Xiaomi 8 smartphones.
Note that the carrier phase measurement on GLONASS cannot be obtained from Huawei smartphones, which leads to the blanks in Figure 5(b) and 5(c).
3.3 Measurement noise
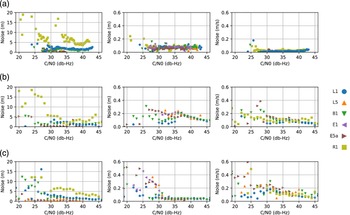
It has been proven by several studies that there is a strong correlation between data noise and C/N0 on smartphones (Sikirica et al., Reference Sikirica, Malic, Rumora and Filjar2017). However, the Doppler noise of smartphones is rarely analysed. This paper calculated the noise of code, carrier phase, and Doppler by Equation (5). After noise estimation, we calculated the statistics for noise as a function of C/N0, and the interval was set as 1 dB-Hz. Note that it is assumed that the data noise in the interval is constant. The results are depicted in Figure 6 with the C/N0 setting as the independent variable. The left panels of the figure show the noise of the code, the middle panels show the noise of the carrier phase, and the right panels show the noise of the Doppler measurements. Note that the results of the three utilised smartphones are shown in the figure. Specifically, (a) is for MIA8, (b) is for HP30 and (c) is for HP40.
Data noise of three smartphones. Left panels: code noise; middle panels: carrier noise; right panels: Doppler noise. (a) MIA8. (b) HP30. (c) HP40

The measurement of noise of different data was calculated separately. Firstly, we checked the figure in the column, and noted that the trend of data noise on the three smartphones is similar. And if we analyse the figure in rows, obviously the range of phase noise and Doppler noise is approximately equal, while code noise is much higher. In addition, data points for different frequencies are quite scattered for code noise, and they overlap in the middle and right figures. It means that the accuracy of code measurements on smartphones is influenced by the GNSS signal used, but the accuracy of carrier phase and Doppler will not be.
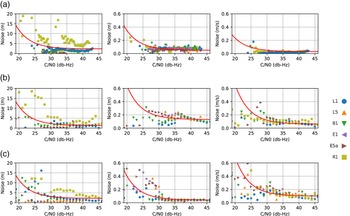
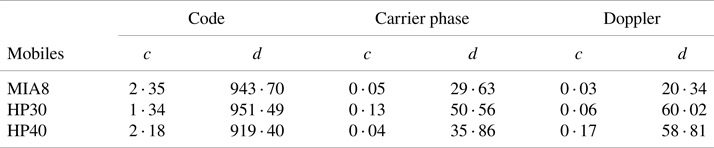
Besides, a significant exponential trend can be seen in the figures. In this paper, we fit it by the SIGMA function, which is given as Equation (13). The curve fitting results are shown in Figure 7, and the parameters are shown in Table 3:

Curve-fitting results of code, phase, and Doppler noise for the three smartphones; the red lines are the curves fitted based on the exponential function. (a) MIA8. (b) HP30. (c) HP40

Fitting parameter of the stochastic model

3.4 Velocity estimation
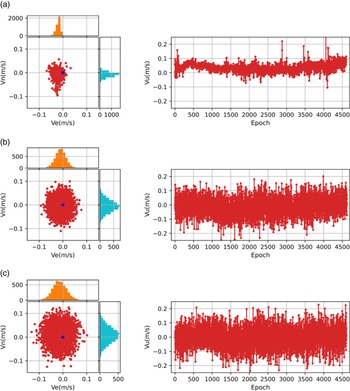
In this section, velocity was estimated by Doppler measurement based on the method introduced in Section 2.2 to evaluate its effectiveness. The result is shown in Figure 8, in which the $Ve$ , $Vn$
 and $Vu$
 represent the velocity in east, north and up components. Pictures (a), (b) and (c) in this figure are the results of MIA8, HP30, and HP40, respectively. The blue stars in the left pictures are the reference velocity which are zero, since smartphone are static in the data collection. In terms of the velocity in horizontal, it can be seen that the results of the MIA8 are more concentrated than the result of HP30 and HP40. Specifically, the results of the MIA8 are mainly concentrated within 0 ⋅ 05 m/s, while the results of the Huawei smartphones are within 0 ⋅ 1 m/s. The analysis in Section 3.3 shows that this is caused by the noise difference between the three smartphones. In the vertical, the results of the MIA8 are still stable. However, as time passes, the noise of the estimation of the MIA8 increases and outliers appear, while the results of the Huawei phones do not suffer from this change. This could be led by the accuracy decrease of the Doppler observations of the MIA8 with a lone working time. Note that all three phones show similar trends in results between 0 and 1000 epochs, which may be due to changes in the satellite/receiver geometry. Nevertheless, compared with the results of HP30 and HP40, a significant bias is contained in the result of MIA8, this could be affected by the unmodeled errors, and it should be taken into consideration in further research.
Velocity results of the three smartphones in static situation. (a) MIA8. (b) HP30. (c) HP40

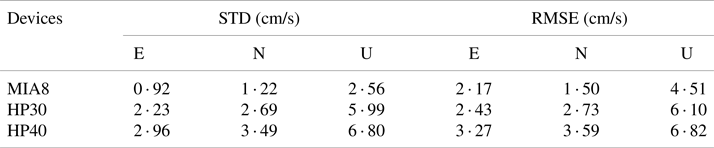
Table 4 illustrates the STD and RMSE of velocity estimation. As can be found in the table, the RMSE of three smartphones is smaller than 5 cm/s in the horizontal, and the vertical RMSE is smaller than 10 cm/s, which proves that velocity at centimetre/second-level can be obtained by the Doppler measurements from Android smartphones. Additional, thanks to the highest accuracy of the Doppler observations, the MIA8 achieves the highest accuracy of velocity results. Take the comparison between the HP30 and HP40, the difference is not significant.
STD and RMSE of velocity result

4. Performance of Doppler-aided positioning
4.1 Data collection
To evaluate the effectiveness of Doppler-aided positioning in various situations, we conducted numerical experiments in car-borne and hand-held scenes. The dataset was collected by smartphones and a geodetic receiver including a Xiaomi 8, a Huawei P30, and a Huawei P40, and a CHCNAV i90. GNSS measurements were collected on the DOY 243 of 2021 for two different experiments.
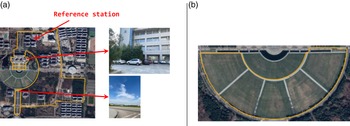
Figure 9 shows the trajectory of two sets of experimental data collection: the left panel of the figure is for car-borne (mostly poor environment), and the right is for hand-held (mostly open-sky environment). The sampling interval of the collection is set to 1 s and the cut-off elevation is 10°. The maximum speed in the collection is about 30 km/h for car-borne and about 4 km/s for hand-held. Note that the reference position of the test smartphones was calculated by the post-processing strategy on the geodetic receivers’ data. Since the centre of the receiver cannot be overlapped with that of smartphones perfectly, there would be a bias of about 5 cm, and this systematic bias would be ignored in the analysis, as it is insignificant. The true velocity was estimated by the combination of carrier and Doppler measurements from the geodetic receiver, which could provide the velocity at cm/s-level accuracy.
Track of dynamic experiment. (a) Trajectory of car-borne test. (b) Trajectory of hand-held test

The real-time kinematic (RTK) positioning method was applied in our experiment, and the reference station is shown in Figure 9. Benefiting from the short distance between the smartphones and the reference station, atmospheric delays, such as ionospheric and tropospheric delays, can be ignored. In addition, we calculate the satellite position and clock offset by the ultra-rapid precise ephemeris, which can be downloaded from ftp:/igs.gnsswhu.cn/pub/gnss/products/mgex/. Since the carrier on GLONASS cannot be obtained on the two Huawei smartphones, we utilised the observations on the GPS/BDS/Galileo systems. Nevertheless, all smartphones provide double-frequency measurement, including the L1/L5 on GPS and E1/E5a on Galileo. We applied an uncombined model to combine the data on different frequencies. Note that ambiguity resolution (AR) is essential to achieve a high-accuracy positioning result. However, the carrier on smartphones suffers from the influence of IPBs (initial-phase biases), and the AR is hard to accomplish in real-time (Gao et al., Reference Gao, Xu, Zhang and Liu2021). In this case, we only analyse the float result under the Doppler-aided method.
4.2 Positioning result
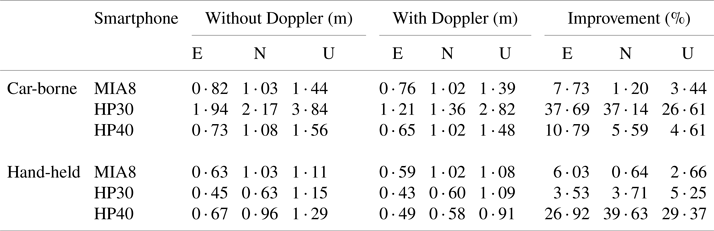
In this section, we evaluated the positioning performance with and without the Doppler-aided algorithm. In addition, data collected in the car-borne and the hand-held scene were utilised. Note that we only plot the result of the HP40 as the example, and the result statistics of other smartphones are shown in the Table 5.
RMSE of the positioning error on different scenes

For the experiment under the car-borne scene, the positioning error on horizontal and vertical are depicted in Figure 10, in which the Figure 10(a) is the scatters of horizontal error, and Figure 10(b) is the cumulative distribution function (CDF) of vertical error. We added the confidence ellipse in the horizontal results for comparing the difference (without Doppler in blue, and with Doppler in orange). Can be found in this figure that a significant improvement can be reached after utilising the Doppler, numerical results are displayed in Table 5. The 95% level of positioning error in the up component is displayed in Figure 10(b), and 95th percentile of the error decreases from 2 ⋅ 60 m to 2 ⋅ 56 m. The reason for this slight improvement is that Doppler is beneficial for positioning indirectly, and the effectiveness in the position part can sometimes be less obvious.
Positioning error of car-borne test. (a) Horizontal errors. (b) Vertical errors

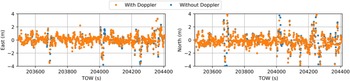
Figure 11 shows the positioning error series with respect to time; since the up-error of the two methods is close, we only plotted the positioning error on the east and north components. In this figure, we can find that the positioning results are close with and without the Doppler-aided algorithm. In other words, the improvement is not significant compared with the left panel of Figure 10. The reason is that the major advantage of using Doppler is avoiding serious positioning errors, especially for the north component. Therefore, the difference is not obvious in the error series but can be performed by the error ellipses.
Car-borne positioning error series on east and north

Compared with the experiment in the car-borne scene, the human body will block the satellite signal to an extent in the hand-held scene. In addition, shaking of the body can also influence the performance of positioning. The influence of the human body should be taken into consideration since it can degrade the positioning performance. Figure 12 displays the horizontal and the vertical positioning error. A similar conclusion can be obtained from the figure that the positioning performance will be enhanced after applying the Doppler measurement. However, a significant improvement can be found in the hand-held case and the error series on east and north components are depicted in Figure 13. It is intuitive that an obvious improvement can be reached by utilising the Doppler, while the positioning without Doppler is unstable. Furthermore, there is a difference from Figure 10 that the 95th percentile of the vertical error can be improved significantly, which decreases from 2 ⋅ 56 m to 1 ⋅ 76 m, with an improvement percentage of 31 ⋅ 25%.
Positioning error of hand-held test. (a) Horizontal errors. (b) Vertical errors

Hand-held positioning error series on east and north

With the reference position of trajectory which was calculated based on the observation from the geodetic receiver, we can calculate the root mean square error (RMSE) of the positioning error. The RMSE of the two methods in the different scenes is detailed in Table 5. It is intuitive that the Doppler-aided algorithm is always better for positioning. However, the improvements in different smartphones are distinct. For the car-borne scene, the improvement of the HP30 is the maximum, while in the hand-held scene it is the HP40. The reason for the obvious improvements is that using the Doppler-aided method enhances the velocity calculation. Then outliers can be detected and excluded indirectly, thus improving the position estimation performance. In this case, the position under the Doppler-aiding can be more stable and reliable. Regardless, the Doppler is helpful, and it is recommended to apply the Doppler measurement in smartphone positioning.
4.3 Velocity estimation
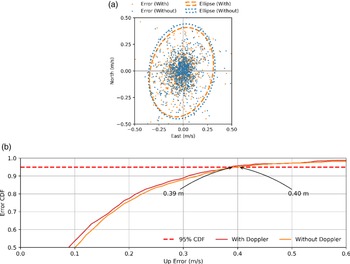
Velocity information is also crucial in some applications, such as intelligent driving or velocity monitoring. In general, velocity can be estimated when applying the motional model which includes the velocity component, such as the CA or CV model. In this case, velocity can also be estimated without the Doppler observation. In this section, we evaluated the effectiveness of the velocity estimation by restricting the implementation of the Doppler measurement on smartphones. Figures 14 and 15 illustrate the velocity estimation with or without the application of the Doppler-aided algorithm on the HP40. Specifically, Figure 14 is the result of the car-borne scene and Figure 14 is the result of the hand-held scene. Figures 14(a) and 15(a) show horizontal error. Note that confidence ellipses are shown in the figures to compare the differences. Figures 14(b) and 15(b) are the CDF of the errors in the up component. In addition, we add a red-dashed line in the CDF figures to depict the value under the 95% level. From Figure 14, it is clear that performance of velocity estimation is facilitated by implementing Doppler, which can be proved by the decrease of the confidence ellipse. Moreover, shown in Figure 14(b), the board value of 95% is 1 ⋅ 02 m/s with Doppler and the value is 1 ⋅ 33 m/s without the Doppler, with an improvement of 23 ⋅ 31%. Similar enhancement can be found in Figure 15, which indicates the result on the hand-held scene. However, the improvement is not significant in this case. For instance, the error in the up component on the 95% level is decreased from 0 ⋅ 40 m/s to 0 ⋅ 39 m/s, with a slight improvement of 2 ⋅ 50%. The reason is that the environment across the hand-held period is ideal, which means that the quality of the carrier measurement is excellent. A satisfactory velocity estimation can also be provided without the Doppler.
Velocity result for the car-borne test. (a) Horizontal errors. (b) Vertical errors

Velocity result for the hand-held test. (a) Horizontal errors. (b) Vertical errors

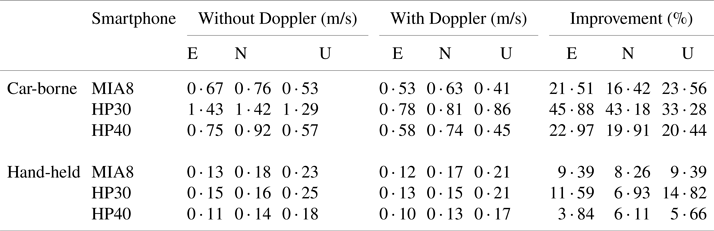
The RMSE of velocity estimation on the three tested smartphones are depicted in Table 6. There is a common trend that the accuracy of the hand-held scene is much higher than that of the car-borne scene. This could be mainly influenced by the different observation environments. In addition, the speed of the smartphones can also be related to estimation performance. It is also illustrated in Table 6 that the improvement of the Doppler-aided algorithm is much more significant in the case of the car-borne experiment than in the hand-held experiment. This means that Doppler is helpful for velocity calculation in a poor environment.
RMSE of velocity estimation on different smartphones

5. Conclusion
This paper comprehensively analyses the characterisation of smartphone Doppler measurement and its position-aiding performance. Based on the static and dynamic experiment on three smartphones, the following conclusions can be obtained:
Firstly, the availability and continuity of Doppler measurement are better than that of carrier phase; on this point, the DSC method is more effective than the CPSC method for the positioning of smartphones. Then we used the data rate minus Doppler which indicates the bias between the Doppler and other types of measurement. The results show that there is a deviation between the code rate and Doppler on the Xiaomi MI8, which means that additional processing should be taken into consideration when applying the DSC algorithm on the Xiaomi MI8. On the contrary, this bias is not significant in the Huawei P30 and the Huawei P40, which means that the DSC algorithm can be utilised directly.
Secondly, we estimated and analysed the noise of the Doppler measurement and then evaluated the performance of velocity estimation in a static situation. For the noise of Doppler, it can be modelled by an exponential function with regard to C/N0, and the parameters of the function were then fitted. The experiment about the velocity estimation indicates that centimetre/second-level accuracy on velocity results can be provided by the Doppler from smartphones.
Thirdly, the positioning performance by the Doppler-aided algorithm was evaluated with the measurement collected in the car-borne scene and the hand-held scene by the three smartphones. The results show that a consistent improvement can be reached after applying the Doppler on smartphones. For the experiment in the car-borne scene, the percentage of improvement in positioning is up to 37 ⋅ 69%, 37 ⋅ 14% and 26 ⋅ 61% in the east, north and up components, respectively. About the velocity estimation, the percentage of improvement is up to 45 ⋅ 88%, 43 ⋅ 18% and 33 ⋅ 28% in the three directional components, respectively, for the Huawei P30. For the experiment in the hand-held scene, the effectiveness of the algorithm is not as significant compared to the car-borne scene case with a maximum improvement percentage of 29 ⋅ 62%/39 ⋅ 63%/29 ⋅ 37% for positioning and 11 ⋅ 59%/6 ⋅ 93%/14 ⋅ 82% for velocity estimation. It should be noted that, based on the analysis, when the environment of observation is poor, the application of Doppler has a more significant impact on positioning and velocity estimation.
In the future, Doppler from more brands of smartphones should be analysed in depth. In addition, there is a systematic deviation in velocity result of the Xiaomi MI8, and the reason for this problem should be discussed.
Competing interests.
The authors declare no conflict of interest.
Acknowledgments
This research was funded by the Indoor and Outdoor Integrated Fusion Positioning Algorithm Technical Support Service for Smartphone (8521008666) and Postgraduate Research & Practice Innovation Program of Jiangsu Province (KYCX21_0132).