INTRODUCTION
Bambara groundnut (Vigna subterranea) is an underutilized legume that originated in the regions between the Jos Plateau in northern Nigeria and Garu in Cameroon (Pasquet et al., Reference Pasquet, Schwedes and Geptps1999). The crop has been grown widely for many centuries and is successfully grown throughout sub-Saharan Africa as a source of protein by women farmers for the subsistence of their families. The variety subterranea is the cultivated form with wild forms belonging to the variety spontanea (Pasquet et al., Reference Pasquet, Schwedes and Geptps1999). Its nutritional composition (protein content: 16–25%) is very similar or superior to other legumes, providing an important supplement to cereal-based diets (Linnemann and Azam-Ali, Reference Linnemann and Azam-Ali1993). Neither improved varieties nor agronomic recommendation exist, so farmers are still cultivating the local genotypes (Anchirinah et al., Reference Anchirinah, Yiridoe and Bennett-Lartey2001; Ntundu et al., Reference Ntundu, Shillah, Marandu and Christiansen2006).
The agro-ecological niche of bambara groundnut in semi arid Africa indicates more adaptability to severe droughts than other legumes (Linnemann and Azam-Ali, Reference Linnemann and Azam-Ali1993). In spite of the presumed drought-tolerant capabilities, it has been reported that canopy expansion, biomass production and yield are reduced under water-limited conditions indicating drought stress on growth and development (Collinson et al., Reference Collinson, Azam-Ali, Chavula and Hodson1996; Reference Collinson, Clawson, Azam-Ali and Black1997). Extremes of temperatures are a major constraint to crop adaptation and productivity; especially when they are coincide with drought and critical growth stages of plant development (Wheeler et al., Reference Wheeler, Keatinge, Ellis, Summerfield and Craufurd1999). Although limited information is available on temperature stress for bambara groundnut, the wide fluctuations in daily mean temperature in semi-arid Africa necessitate a thorough understanding of the effect of temperature stress on growth and development. The response of high temperature stress has been studied in detail for groundnut (Wheeler et al., Reference Wheeler, Keatinge, Ellis, Summerfield and Craufurd1999), wheat (Ferris et al., Reference Ferris, Ellis, Wheeler and Hadley1998), cowpea (Ismail and Hall, Reference Ismail and Hall1999) and rice (Matsui et al., Reference Matsui, Omasa and Horie2001). Environmental stresses represent limiting factors for growth and yield of bambara groundnut.
Physiologically based mechanistic crop models are frequently employed to estimate crop yields in variable climate studies, as they attempt to represent the major processes of crop environmental response. The PARCH (Predicting Arable Resource Capture in Hostile Environment) model (Bradley and Crout, Reference Bradley and Crout1993) initiated the concepts of modelling bambara groundnut and developed towards the BAMnut (Bannayan, Reference Bannayan2001) and BAMFOOD project models (Cornelissen, Reference Cornelissen2005) which focused only on water-limited situations with very limited model datasets. The clear understanding of strengths and weaknesses in previous bambara groundnut models provided the research background to the present study.
BAMGRO is capable of describing differences between genotypes, and the influence of soil moisture and temperature as major abiotic stress factors using a simplified approach. Depending on the timing, severity, duration and genotype the type of stress varies for different growth and developmental processes. BAMGRO distinguishes three stress effects due to independent and cumulative effects of drought (WSTRESS) and temperature stress (TSTRESS) on leaf production, leaf senescence and dry matter partitioning (Karunaratne et al., Reference Karunaratne, Azam-Ali, Al-Shareef, Sesay, Jørgensen and Crout2010a).
Detailed tests for validating the BAMGRO model, canopy development (Karunaratne et al., Reference Karunaratne, Azam-Ali, Al-Shareef, Sesay, Jørgensen and Crout2010a), soil water module (Karunaratne et al., Reference Karunaratne, Crout and Azam-Ali2010b), and dry matter production and partitioning (under review) are described elsewhere. This paper provides details of the overall performance of BAMGRO including inputs, data flow among sub-modules and significant validation results that facilitates the user to apply within local sites in sub-Saharan Africa under range of abiotic stress
Description of the BAMGRO model
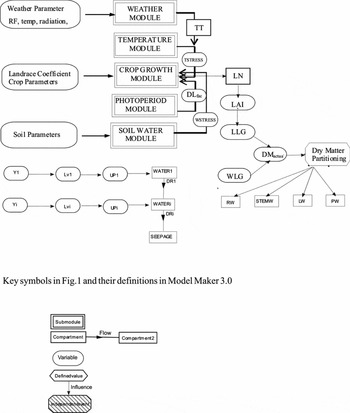
BAMGRO is a process-oriented model that simulates a crop carbon balance and a soil water balance. The main time step in BAMGRO is day 1, but thermal time is calculated hourly and integrates over the time course of the day. BAMGRO consists of different sub-modules that deal specifically with weather, crop growth, soil water, temperature and photoperiod. Figure 1 shows the interactions of the main components within the model.
Schematic overview of data flow through the sub-modules in the BAMGRO model: interactions of sub-modules and input files, and detailed representation of the crop growth and soil water modules.

Input data files
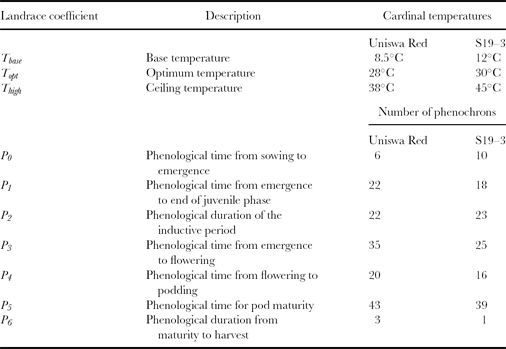
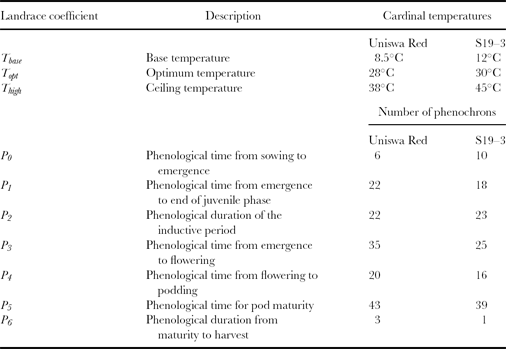
The main input files to the BAMGRO main model are weather parameters, (daily weather data: minimum temperature, maximum temperature, solar radiation, saturation deficit (SD) and rainfall), soil parameters (soil bulk density, soil depth, transpiration equivalent; Karunaratne et al., Reference Karunaratne, Crout and Azam-Ali2010b) and genotype coefficients (Table 1). These files were created from the results of glasshouse experiments at the Tropical Crops Research Unit (TCRU), University of Nottingham, UK and from field experiments in Africa (see below).
Landrace specific cardinal temperatures used for the calculation of phenochrons and predetermined number of phenochrons for each phenological stage for two landraces: Uniswa Red and S19–3 (TCRU glasshouse experiment, 2002 and 2006).
Weather module
The main role of the weather module is to read daily weather data (maximum and minimum air temperature, solar radiation, SD, rainfall in field sites and irrigation under controlled environmental experiments) from input files that were created during experimental periods. The weather module initiates data flow through the model by calculating thermal time accumulation. This is calculated hourly and integrated over the day (24 h) as in Eq. 1 (Karunaratne et al., Reference Karunaratne, Azam-Ali, Al-Shareef, Sesay, Jørgensen and Crout2010a). According to Purcell (Reference Purcell2003), a warm season crop like bambara groundnut shows wider discrepancy between daily and hourly calculation of thermal units under extreme temperatures. Since BAMGRO focuses on temperature stress as two extremes beyond lower and upper threshold levels, hourly calculation of thermal units reduces the gap between simulated and observed values. Similar work on thermal unit calculations has indicated that the use of hourly temperature data is important because, diurnal temperature curves are not symmetrical (Cesaraccio et al., Reference Cesaraccio, Spano and Snyder2001).

where, Tmean is daily mean temperature (°C); Tmin, daily minimum temperature (°C); Tmax, daily maximum temperature (°C); Tbase, base temperature (°C); Td(i), hourly temperature in hour i (°C).
Crop growth module
The crop growth module operates two interconnected processes: crop phenology (development) and growth (biomass accumulation) (Figure 1).
Crop phenology. The development of bambara groundnut can be explained in terms of vegetative (germination, emergence, growth) and reproductive (flowering and pod formation) phases. Unlike cereals, the two phases overlap, as leaf production continues after flowering and podding. There is a phenological switch, which is operated between the vegetative and reproductive phases.
The progression through phenological phases signals changes in the growth and partitioning of biomass to leaves, stems, roots and pods depending on the stage of development. Phenology is simulated from sowing through five stages: (1) emergence, from sowing until first full leaf above the ground, (2) vegetative phase, from emergence to maturity, (3) flowering, from 50% of the crop in flowering until maturity, (4) pod filling, from first pod until maturity and (5) maturity, end of vegetative phase. Germination is set to occur on the day after sowing in all genotypes.
Each of the phases in the phenology of the crop is assumed to require a specific number of phenochrons that is calculated using the accumulated thermal units (input from weather module) and then enters the next phase. A phenochron is defined as the advancement in the phenological age of the crop over growing period when temperature and photoperiod are at their optimum values (Matthews and Stephens, Reference Matthews and Stephens1998). Thus the advancement of phenological age (Ad, phenochrons) of the crop on day n (days since sowing) is given by Eq. 2.
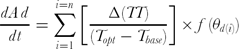
where, Ad, = phenochrons; n = number of days experienced by the crop since sowing and f(θd(i)) = function relating to photoperiod (Matthews and Stephens, Reference Matthews and Stephens1998).
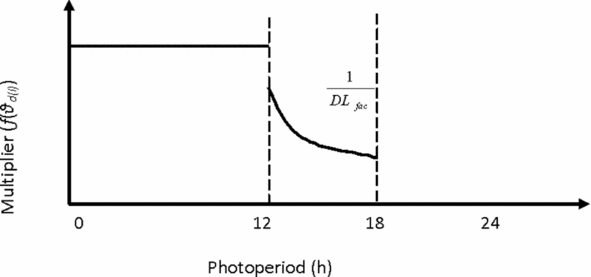
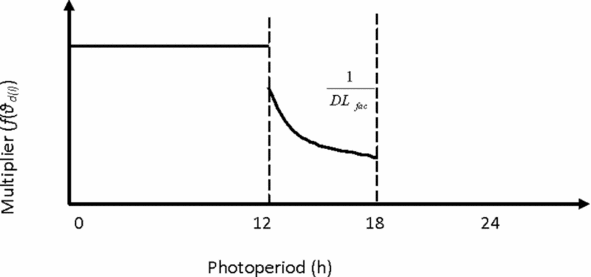
The function related to photoperiod f(θd(i)), is considered as 1 when daylength is below 12 h indicating a neutral response to photoperiod and a linear reduction is calculated between 12 h and 18 h (Cornelissen, Reference Cornelissen2005). The effect of photoperiod on phenology through f(θd(i)) directly responds to the delay in pod filling when the crop is grown above 12 h daylength (Figure 2). DLfac (Karunaratne et al., Reference Karunaratne, Azam-Ali, Al-Shareef, Sesay, Jørgensen and Crout2010a), which explains the effect of photoperiod with a positive linear relationship on rate of new leaf production, is used to estimate the multiplier (Figure 2). According to experimental observations, the inversely proportionate relationship between leaf number and pod number describes the delay in pod formation during the photoperiod above 12 h (Karunaratne, Reference Karunaratne2009). Therefore BAMGRO simply assumes, f(θd(i)) (Eq. 3) is inversely proportional to DLfac.

Function relating daily photoperiod to a multiplier.
Crop growth. Crop growth is achieved by means of canopy development, dry matter production and partitioning among different parts of the plant. The accumulated thermal units produce the first leaf for the first instance and thereafter that rate of new leaf production is dependent on daily accumulation of thermal time until maturity. Leaf area is produced as a function of leaf number (Karunaratne et al., Reference Karunaratne, Azam-Ali, Al-Shareef, Sesay, Jørgensen and Crout2010a). The carbon balance includes daily inputs from photosynthesis and conversion of carbon into crop tissues and losses due to abscised parts. Therefore the daily plant growth is computed by converting daily intercepted photosynthetically active radiation (PAR) into plant dry matter using a crop-specific radiation use efficiency parameter. The daily growth through light interception is computed as a function of leaf area index (LAI), radiation use efficiency (εs) and light extinction coefficient (k). The actual daily increase in dry matter (DMactual, Eq. 4) is calculated from the minimum of two potential growth rates, one determined by intercepted radiation (light limited growth-LLG, Eq. 5) and the other by soil water supply (water limited growth-WLG, Eq. 8).


where, DMactua l = actual growth; LLG = light limited growth (g m−2 d−1); Si = short wave solar radiation (MJ m−2 d−1; direct solarimeter measurements, calculated from sunshine hours); εs = efficiency of conversion of this solar radiation (g MJ−1); LAI = leaf area index and PARfrac = fraction of PAR (50% of Si) (Karunaratne, Reference Karunaratne2009).
Dry matter partitioning is divided into three main phases: (1) germination to emergence when assimilates stored in seeds are mobilized and relocated from the seed for the initial growth of roots in young seedlings; (2) emergence to flowering, when priority is given to above ground parts (leaves and stems) having root: shoot ratio of 0.073 ± 0.0048 with a linear reduction towards the crop maturity; (3) flowering to maturity, when flowers and pods demand the major part of the dry matter with a linear increase in pod fraction and a reciprocally linear reduction in allocation to leaves and roots having root: shoot ratio of 0.047 ± 0.006. The partitioning fractions during the vegetative phase consist of leaf, stem and roots with the pod fraction added in the reproductive phase. The linear increase and decrease of leaf fraction are calculated based on thermal time accumulations and water stress index.
Pod formation and pod filling are considered as two independent processes during the reproductive phase. BAMGRO regulates the daily increase in pod number (PN) as an inverse relationship with rate of leaf production (TCRU 2006 experimental data; Karunaratne, Reference Karunaratne2009) up to the maximum value of each genotype. Based on experimental observations (Cornelissen, Reference Cornelissen2005), maximum pod number is restricted to 56 ± 15 and 62 ± 25 per plant for Uniswa Red and S19–3 respectively under non-limiting moisture and optimum temperatures. The model controls the unlimited pod filling by assigning a maximum pod-filling rate, and setting the maximum size of an individual pod as 0.35 g (Cornelissen, Reference Cornelissen2005). If the rate of pod filling exceeds the maximum pod-filling rate which is assigned to the model it automatically lowers the rate to maintain the maximum size of individual pods. Individual pod weight is calculated according to Eq. 6, thereby the yield is computed per unit land area.
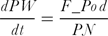
where, PW = the weight of individual pod g d−1; F_Pod = fractional partitioning to pods and PN = number of pods per plant.
Soil water module
The BAMGRO-soil water module uses daily time-steps to simulate root growth, root distribution, root water uptake and soil water balance from sowing until maturity for different bambara groundnut genotypes. The parameters and relationships needed to build the functions in the model were derived from the glasshouse experiments of summer 2003 (Mwale, Reference Mwale2005), Nottingham, UK and published information (King et al., Reference King, Gray, Bradely, Binham, Foulks, Gregory and Robinson2003). The model was primarily validated against soil moisture content of Botswana field sites.
The soil is represented as a one-dimensional profile; it is homogeneous horizontally and consists of a number of soil layers. The total root zone is assumed to be 1.5 m, divided into 15 soil layers each of 10 cm depth. This model computes the daily changes to root length and balance of soil moisture content for each soil layer due to rainfall and irrigation, vertical drainage, soil surface evaporation and root water uptake processes (Figure 1). The root water capture coefficient (kw) is related to the resource uptake physiology especially the molecular mechanism of water and nutrient transport across membranes and soil water transport mechanisms (King et al., Reference King, Gray, Bradely, Binham, Foulks, Gregory and Robinson2003). Following King et al., Reference King, Gray, Bradely, Binham, Foulks, Gregory and Robinson2003, a modified version of the generic function (King's model is only for the anthesis period) is used to predict water uptake as a fraction of total available water which is potentially available for uptake over the day. Thereby the potential water uptake for each 10 cm soil layer is estimated by Eq. 7 based on the maximum available water in each layer on a daily basis.

where, kw = is ‘root water capture coefficient’ (cm2); Lv = root length density of the soil layer (cm cm−3); E = water capture parameter; θ = fraction of available water in soil layer and Upot(i) = change in potential water uptake in layer i (cm d−1).
Water limited growth is often calculated as the product of potential water uptake by roots (Usoil) and a crop specific (constant) transpiration equivalent, TE (g kPa kg−1) with normalizing factor for temperature SD according to Azam-Ali et al. (Reference Azam-Ali, Crout and Bradley1994):
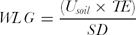
Water stress index
For the purpose of the model it is assumed that growth of the unstressed crop is limited solely by the solar radiation available for photosynthesis and its photosynthetic capacity. If the crop is exposed to a restriction of water supply and the water uptake by roots is insufficient to replenish transpiration at potential growth rates the plant is exposed to moisture stress. Water stress index (WSTRESS) ranges from 0 to 1, representing maximum stress and no stress respectively, and is given by.

Temperature module
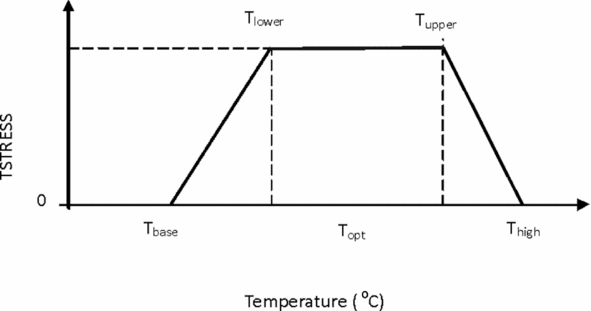
The temperature sub module considers the output from the weather module as input to calculate temperature stress index according to Eqs. 10 and 11 depending on the mean temperature. When the crop is exposed to a range of temperatures within the boundary line of base (Tbase) and ceiling (Thigh) temperatures, it results in temperature stress effects on growth and development. However temperature stress can be further divided into heat and cold stress based on the mean temperature and agro-ecological adaptation of the genotype. Similar to WSTRESS the value of temperature stress index (TSTRESS) ranges between 0 (maximum stress) and 1 (no stress) (Figure 3):


where, Thigh = ceiling temperature (°C); Tlower = lower threshold level of temperature (°C); Tupper = upper threshold level of temperature (°C).
Diagrammatic representation of variation in temperature stress index (TSTRESS).
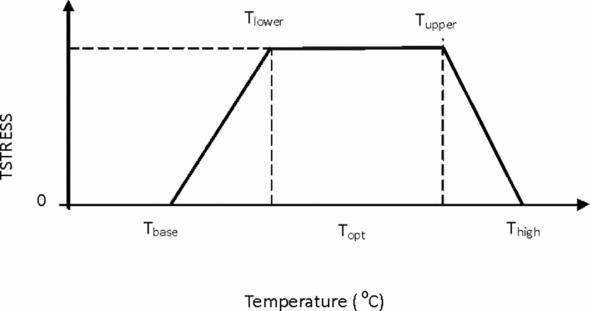
BAMGRO calculates temperature stress considering two threshold levels that are set as lower (Tlower) and upper (Tupper) for each genotype as a novel approach in the present study. When Tmean is lower than the Tlower the crop experiences a cold stress while temperatures above Tupper cause a heat stress (Figure 3). Based on the experimental evidence from glasshouse experiment (TCRU 2006) the lower and upper threshold levels for Swaziland genotype, Uniswa Red are set at 17°C and 35°C respectively. However, the Namibian genotype, S19–3 showed a cold stress with low temperature, LT (23 ± 5°C) while no significant heat stress with high temperature, HT (33 ± 5°C) and therefore, BAMGRO uses 24°C and 38°C for lower and upper threshold levels (Karunaratne, Reference Karunaratne2009).
Photoperiod module
Bambara groundnut is a short-day crop and pod formation is regulated by photoperiod (Brink, Reference Brink1997; Linnemann and Craufurd, Reference Linnemann and Craufurd1994). Further, the experimental evidence from growth room experiments at the University of Copenhagen, Denmark, showed that photoperiod is positively correlated with rate of leaf production. Therefore BAMGRO calculates the daylength factor (DLfac)to modify the daily rate of change in new leaf production when the crop is grown above 12 h daylength (Karunaratne et al., Reference Karunaratne, Azam-Ali, Al-Shareef, Sesay, Jørgensen and Crout2010a) and thereby to calculate the phenochrones (Ad; Eq. 2).
MODEL DATA SETS
Data for model calibration were derived from the glasshouse experiments at the University of Nottingham, in 2002 (Mwale, Reference Mwale2005) and 2006, and growth room experiments at the University of Copenhagen, Denmark. The model was validated using data from six experiments comprising two years of glasshouse experiments (Nottingham 2007, Nottingham 2008) and two fields in Botswana (two sowing dates; 18 January and 1 February) and two sites in Swaziland (Malkerns and Luve).
The experimental design, glasshouse structures, control mechanisms of temperature and SD, plant sampling procedure, treatments and measurements of weather data, leaf number and LAI were as reported in Karunaratne et al. (Reference Karunaratne, Azam-Ali, Al-Shareef, Sesay, Jørgensen and Crout2010a). The model calibration and validation data on canopy development, dry matter production, pod yield and soil moisture content described in this paper were derived from the same set of growth chamber (Copenhagen, Denmark), glasshouse (Nottingham, UK) and field (Botswana and Swaziland) experiments as in Karunaratne et al. (Reference Karunaratne, Azam-Ali, Al-Shareef, Sesay, Jørgensen and Crout2010a). The relevant treatments and measurements are outlined below.
The calibration data for DLfac were derived from controlled environment (C-E) experiments for five day lengths (10, 11, 12, 13 and 14 h) and temperatures of 26°C (night) and 30°C (day) at the University of Copenhagen, Denmark.
The three main experiments during the summer months of 2006, 2007 and 2008 were conducted in the five glasshouses of the TCRU at the University of Nottingham, School of Biosciences, Sutton Bonington Campus, UK (52°50′N, 1°15′W; 45m asl). Two temperatures 23 ± 5°C (LT) and 33 ± 5°C (HT) were imposed in the five glasshouses. Soil moisture in each glasshouse was non-limiting in 2006 (total irrigation 381 mm for LT and 437 for HT) which is the main calibration experiment, and irrigation was stopped at 77 days after sowing (DAS) (total irrigation 260 mm for LT and 305 for HT) and 33 DAS (total irrigation 107 mm for LT and 160 mm for HT) in 2007 and 2008, respectively. The average solar radiation varies from 9 to 12 MJ day−1 within the glasshouses.
The experimental farm, Notwane (Botswana College of Agriculture; 24°33′S, 25°54′E, 994 m asl and 400–600 mm average rainfall) carried out field experiments for a set of genotypes sown on three dates: 21 December, 18 January and 1 February in the 2006/2007 growing season where a range of environmental conditions were considered including photoperiodic effect. The average solar radiation in the experimental site varies between 22 and 26 MJ day−1 while the day length ranges from 10 to 13 h during January to April.
As described by Cornelissen (Reference Cornelissen2005), from December 2002 to May 2003 a set of Swaziland and Botswana genotypes were grown in field sites in Swaziland (Malkerns; 26°30′S, 31°13′E, 700 m asl and 850–1000 mm average rainfall and Luve; 26°20′S, 31°14′E, 580 m asl and 700–850 mm average rain fall). On average the experimental sites reported a day length variation from 10 to 13 h.
In the Nottingham glasshouse experiments, sequential growth analysis recorded the total leaf area of individual plants using leaf area meter-model LI- 3100 (LI-COR, Inc. Lincoln, Nebraska, USA), dry weights and soil moisture at 10, 20, 30, 40, 60 and 100 cm (PR2 probe). In the Botswana and Swaziland field sites, leaf area (length and width method, Cornelissen et al., Reference Cornelissen, Deaswarte and Azam-Ali2002) and dry weights were recorded twice a week on 10 pre-selected plants, which were tagged after emergence. Soil moisture content in the profile (up to 100 cm depth) was measured only for the Botswana field experiments (2007–2008) using a neutron probe. In Copenhagen, the leaf area was estimated every 20 days from sowing until 120 DAS using non-destructive measurements as described by Cornelissen et al. (Reference Cornelissen, Deaswarte and Azam-Ali2002).
EFFICIENCY CRITERIA USED IN BAMGRO
To assess model performances and provide an objective evaluation of the ‘closeness’ of simulated (S) v. measured (M) values, a number of indicators are used. This involves an analysis of the simulated (Si) and measured (Mi) values.

A simple t-test is performed to check the significant deviations of slope of the regression line (a) and the intercept (b) from the ideal line of identity (1:1) in which the slope is 1 and intercept is 0.
The Nash and Sutcliffe model efficiency measure
The model efficiency measure of Nash and Sutcliffe (Reference Nash and Sutcliffe1970) (N-S) was used for model evaluation. N-S is calculated by Eq. 13:
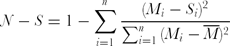
N-S is a measure of the mean square error to the observed variance (Karunaratne et al., Reference Karunaratne, Azam-Ali, Al-Shareef, Sesay, Jørgensen and Crout2010a). Both N-S and mean absolute error (MAE) that explains the absolute deviation between the simulated (Si) and measured (Mi) values are used to evaluate the model efficiency.
MODEL VALIDATION RESULTS
Canopy development
Leaf area index varied with temperature, soil moisture and sowing dates (photoperiod), which the model successfully described (Karunaratne et al., Reference Karunaratne, Azam-Ali, Al-Shareef, Sesay, Jørgensen and Crout2010a). As reported in Karunaratne et al., (Reference Karunaratne, Azam-Ali, Al-Shareef, Sesay, Jørgensen and Crout2010a), both genotypes showed an increase in LAI with increasing temperature (HT) exhibiting heat stress on canopy growth especially during pod initiation stage resulting in lower dry matter for pods. Also the drought reduced the LAI over the growing period in both genotypes (Nottingham 2007 and 2008, Swaziland Luve). The model validation results correlated well with observed values for LAI (glasshouse and field experiments in Swaziland) indicating successful model performance under temperature and drought stress (Karunaratne et al., Reference Karunaratne, Azam-Ali, Al-Shareef, Sesay, Jørgensen and Crout2010a).
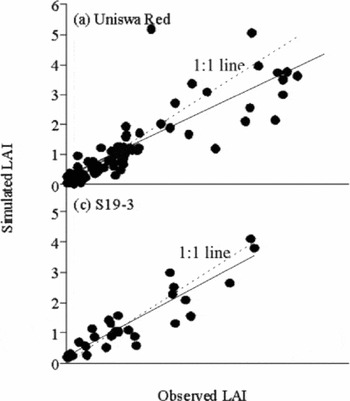
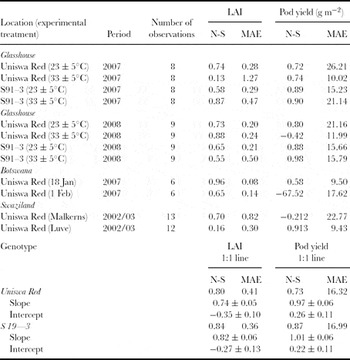
BAMGRO is intended to predict the performance of different genotypes under various abiotic stress factors. Therefore the individual model comparison for LAI from glasshouse experiments in Nottingham, field trials in Botswana (Notwane) and Swaziland (Malkerns and Luve) were pooled for each genotype (Figure 4). Overall, simulated LAI correlated well with measured values for the two tested genotypes, S19–3 (N-S, 0.84) and Uniswa Red (N-S, 0.80), with maximum MAE less than ± 0.50. The intercept (Uniswa Red, −0.35 ± 0.10; S19–3, −0.27 ± 0.13) of the regression line was not significantly (p > 0.001) different to the intercept (0) of the 1:1 line and the simulations starts through the origin. However, the slope (Uniswa Red, 0.74 ± 0.05; S19–3, 0.82 ± 0.06) of the regression line was significantly lower (p < 0.001) than the slope (1) of the 1:1 line explaining the observed underestimation (Table 2).
Comparison between measured and simulated leaf area index (LAI) for tested genotypes in glasshouse experiments, Nottingham, UK and field sites in Botswana and Swaziland (a) Uniswa Red (b) S19–3; 1:1 line (⋅⋅⋅⋅⋅⋅) and regression line (—).

Statistical comparison of leaf area index (LAI) and pod yield simulations with measured data from glasshouse (Nottingham, UK) and field experiments in Botswana and Swaziland for two genotypes (S19–3, Uniswa Red) grown under various temperature and moisture stress conditions.

Pod yield
Simulated pod yield reported higher correlation with glasshouse measurements for S19–3 than Uniswa Red (N-S, 0.88 to 0.98; MAE, ±16 to 21 g m−2). Similar comparison of pod yield simulations was observed in Uniswa Red (N-S, 0.72 to 0.80) but the HT treatment in the 2008 season reported an overestimation especially towards the end of the season so that the N-S was poorly explained in this case (Table 2). Pod yield varied with sowing dates and the model simulated the effect of variable climatic conditions in Botswana on yield formation.
BAMGRO was finally tested for two field trials in Swaziland (Malkerns and Luve). Yield showed a strong correlation with limited soil moisture condition which the model simulates successfully. The yield simulation for the drought affected Uniswa Red in the Luve experiment was well correlated with measured values having N-S = 0.91 and lower MAE ± 9.4 g m−2. However, it was underestimated at Malkerns where the crop experienced a non-limiting moisture environment.
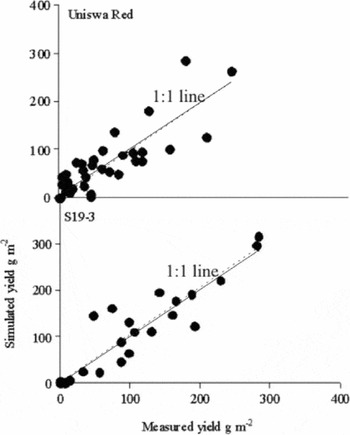
The model comparison for pooled data on yield from two glasshouse experiments (Nottingham 2007, 2008) and experiments in Botswana (January 18, February 1) and Swaziland (Malkerns, Luve) over the season for each genotype correlated well with measured value. The statistical comparison of the model for the two tested genotypes (Uniswa Red, S19–3), is well correlated with the line of identity (1:1 line) indicating acceptable correlation coefficient (N-S) for Uniswa Red (0.73) and S19–3 (0.87). The slope of the regression line in Uniswa Red (0.979 ± 0.066) and S19–3 (1.012 ± 0.061) and the intercept are not significantly different from the slope (1) and intercept (0) of the 1:1 line (Figure 5).
Comparison between measured and simulated pod yield for tested genotypes in glasshouse experiments, Nottingham, UK and field sites in Botswana and Swaziland (a) Uniswa Red (b) S19–3; 1:1 line (⋅⋅⋅⋅⋅⋅) and regression line (—).

Soil moisture
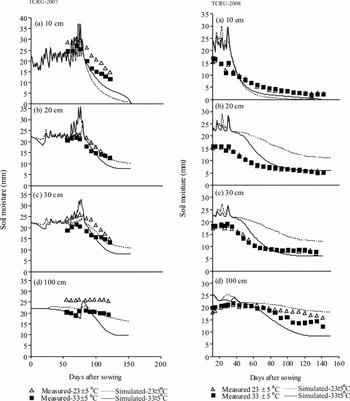
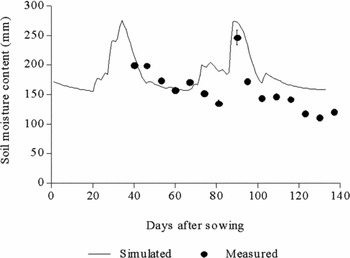
Mainly the model was compared with experimental soil moisture data sets from glasshouse experiments in 2007 and 2008 and the Botswana 2007/2008 season. Comparison between simulated and observed soil moisture content (mm) for 10 soil layers (10 cm each) in glasshouse experiments was able to simulate the reduction in soil moisture content (mm) correctly due to the drought in 2007 and 2008 (Figure 6). However, the model generally overestimated the soil moisture content in the 2008 glasshouse experiment in which the drought was imposed at 33 DAS. The BAMGRO-soil water module simulates the soil moisture variation in the profile for the field sites in Notwane, Botswana, with less deviation from measured values (MAE = ±22.8 mm) (Figure 7).
Soil moisture variation with days after sowing at top 10 cm (a), 20 cm (b), 3°Cm (c) and 100 cm (d) layers for Uniswa Red grown under 23 ± 5°C and 33 ± 5°C in glasshouse experiments during 2007 and 2008.

Soil moisture variation of Uniswa Red with days after sowing through the soil profile in Botswana field site during the growing season 2007/2008. The soil moisture was measured using a neutron probe.

DISCUSSION
The comprehensive modelling approach explained in the present study is intended to account for major abiotic stress and presents a more mechanistic platform than previous bambara groundnut models, i.e. BamNut (Bannayan, Reference Bannayan2001) and BAMFOOD project (Cornelissen, Reference Cornelissen2005). The latter were unable to simulate canopy development accurately under water-limited conditions due to the lack of regulation of rate of leaf production under drought stress. Cornelissen (Reference Cornelissen2005) clearly demonstrated the lack of slowing of the rate of leaf production under drought stress especially at the early stages of the growth cycle. The model developed in the present study (BAMGRO) successfully addressed this issue especially during early growth. Further, BAMGRO captures the temperature stress and photoperiod that was not considered in previous models of canopy development, growth and yield using a novel approach. There is limited published information on the role of temperature in the rate of leaf appearance (Massawe et al., Reference Massawe, Azam-Ali and Roberts2003) and role of photoperiod on canopy development (Brink, Reference Brink1997) of bambara groundnut genotypes. Bambara groundnut is a short-day species. Flowering is set by thermal time whilst the onset of ‘podding’ (pod growth) is affected by photoperiod in both controlled environment studies (Linnemann, Reference Linnemann1991a; Reference Linnemannb) and in the field (Harris and Azam-Ali, Reference Harris and Azam-Ali1993). Some bambara groundnut genotypes are photoperiod-sensitive with regard to the time to flowering, and most are sensitive in relation to the onset of pod-filling (Linnemann and Craufurd, Reference Linnemann and Craufurd1994). When day lengths are longer than the optimum (12 h), the crop will take longer to reach pod filling, delaying maturity. However, the exact mechanism by which day length imposes control over pod development in this species is unknown.
The variation in canopy expansion under a range of soil moisture, temperature and photoperiods are successfully explained with new functions and specific relations (Karunaratne et al., Reference Karunaratne, Azam-Ali, Al-Shareef, Sesay, Jørgensen and Crout2010a). BAMGRO uses a simple approach to simulate biomass production considering limitation of light (LLG) and soil water supply (WLG). The use of a water productivity function to calculate the dry matter production based on the potential water uptake by the root system when the crop is exposed to drought stress (0 ≤ WSTRESS ≤ 1) is an improvement from previous modelling of bambara groundnut. Therefore BAMGRO provides opportunities to account of the differences in potential water uptake by the root system that is primarily dependent upon root growth, distribution and kw (‘resource capture coefficient’) of the considered genotype. Dry matter partitioning functions developed by means of changes over the vegetative and reproductive phases are successful in capturing the major abiotic stress factors.
Various crop models for major crops have used similar approaches to BAMGRO to simulate the actual daily biomass considering the minimum of two potential growth rates as LLG and WLG. Robertson et al. (Reference Robertson, Carberry, Chauhan, Ranganathan and O'Leary2001) reported a crop simulation model for pigeonpea (Cajanus cajan), and the transpiration demand was modelled as a function of the current day's crop growth rate, divided by the transpiration use efficiency. A crop simulation model for common beans calculates the dry matter production under soil water limited conditions by a water stress factor that was derived from the total water potential (combination of matric and osmotic potentials) (Adiku et al., Reference Adiku, Renger, Wessolek, Facklam and Hecht-Bucholtz2001).
Overall simulation of LAI and pod weight over the growing season is well correlated with measured values under glasshouse conditions and in field conditions in Swaziland in which the effect of abiotic stress factors is encountered. The possible reason for consistently poor simulation of pod weight for Botswana can be explained as intra-genotype variability. The crop sown on two dates, 18 January and 1 February in Botswana showed a statistically acceptable model validation result for Uniswa Red (N-S, 0.86 to 0.88) under poor rainfall.
The soil water module uses the relationship of root length density (Lv) and water uptake as explained in Karunaratne et al. (Reference Karunaratne, Crout and Azam-Ali2010b). However the variation of Lv under drought, heat and cold stress for bambara groundnut is unknown. Husain et al. (Reference Husain, Reid, Othman and Gallagher1990) reported that both Lv and rooting depth of faba bean (Vicia faba) grown under drought stress were significantly higher than regularly irrigated crops. A study focused on investigation of Lv and water uptake revealed that some cereal species consistently had five to ten times the total root length of grain legumes and a higher correlation with maximum rooting depth than the root length density (Hamblin, Reference Hamblin and Tennant1987). In addition, several soil physical factors that influence root growth and distribution are not considered in BAMGRO, e.g. hydraulic conductivity, soil porosity.
Overall, deviation of model predictions from the observed values can be explained considering differences in the climatic conditions in calibration experiments in the UK summer and in Africa. BAMGRO was mainly calibrated by glasshouse data (Nottingham, UK), which made it possible to conduct most of the physiological measurements under various abiotic stresses. The use of controlled environment glasshouses made it possible to evaluate the response to one or two abiotic stress factors at a time, while keeping others constant. Although air temperature, saturation deficit and soil moisture are controlled within the TCRU glasshouses, the experiments were conducted under natural light during summer in the UK. The intensity of solar radiation during the summer months in Nottingham is spread over 16 h of daylength providing approximately 50% less intensity compared to the original environment of the two genotypes (Uniswa Red and S19–3) in sub-Saharan Africa. Therefore, the growth and yield performances of tested genotypes may not have reached their potential in the glasshouse environments in Nottingham resulting in inadequately estimated parameters.
The deviation of model predictions from measured values can be further explained by the genotype variability (BAMLINK, Sean Mayes, personal communication). Bambara groundnut genotypes are expected to exist as a series of inbred lines, with the variability between lines dependent upon the genetic width of the parent materials. For most of the genotypes, adaptive traits (number of days to flowering, number of days to maturity) are likely to be reasonably constant, due to the adaptation of the genotype to their original environment in which it is regularly grown and selecting by farmers. However, there is a possibility that genes for agronomic traits may be highly variable between different inbred lines of a genotype. Having an estimate of ‘genetic width’ of a genotype allows the intra-genotype variability to be considered within the selected genotypes for the present study. Initial analysis of five individual plants from two genotypes (Uniswa Red and S19–3) with 14 microsatellites identified 3 microsatellites that showed allelic variation in Uniswa Red (10 alleles) and none in S19–3, suggesting that ‘genetic width’ of S19–3 is narrower than Uniswa Red (Basu et al., Reference Basu, Mayes, Davey, Roberts, Azam-Ali, Mithren and Pasquet2007). Also larger-scale investigations are underway, with the long-term aim to develop a multiplexed SSR-based estimate of genetic diversity within a genotype (Sean Mayes, personal communications).
CONCLUSIONS
A crop simulation model (BAMGRO) for an underutilized crop bambara groundnut was developed, calibrated and validated against glasshouse (Nottingham, UK) and field sites in Botswana and Swaziland during the present study. The novel approach in simulating canopy development under abiotic stress and in varying photoperiodic levels is explained in BAMGRO. The daily rate of dry matter production considers the most limiting factor on growth as radiation and soil moisture by means of light-limited growth and water-limited growth. The dry matter produced is partitioned among various parts within the plant considering the phenological stage and the drought stress. BAMGRO-soil water balance follows the feature of a wheat model with very simple functions.
Model validation results for canopy development and yield formation for two tested genotypes are in good agreement with measured values in glasshouse conditions in Nottingham, UK, and field sites in Swaziland and Botswana. The evaluation of BAMGRO-soil water module by means of available soil water as the only source of data revealed that it was overestimated for glasshouse soil while a better correlation was reported for Botswana soil.
Acknowledgements
The authors express their gratitude to Dr S. Mwale, Dr R. Cornelissen and I. Al-Shareef for providing data from their PhD research to calibrate and validate the BAMGRO model. The experiments and analysis described in the paper were part of the EU BAMLINK (INCO-CT-2005–015459) project funded through the EU Framework 6 program. The support for this and other EU funded activities on bambara groundnut is warmly acknowledged.