1. Introduction
The January 2010 earthquake in Haiti generated unprecedented promises of international aid from private charities, non-governmental organizations (NGOs), governments and multilateral organizations. These aid pledges and the promise of a new Port-au-Prince were widely seen as an opportunity for Haiti to ‘turn a corner’, ‘build back better’ and improve its development path in spite of the horrific destruction and tremendous loss of life. At the end of 2012, according to the UN Special Envoy to Haiti office, only 62 per cent of the funding promised by official (bilateral and multilateral) sources in the NY donor conference held in March 2010 has been disbursed. A significant number of people in Port-au-Prince still reside in temporary tent-like structures in camps for the displaced, some of the rubble has not yet been cleared, the cholera epidemic that was introduced into Haiti by UN forces has wreaked havoc on the health and lives of many, and the outlook for the reconstruction of Haiti's capital city is not as rosy as the initial descriptions seemed to predict.
Here, we raise several general questions regarding the inflows of post-disaster aid and their impacts. We want, primarily, to describe post-disaster aid flows in some detail, and within the context of total foreign aid flows. We quantify post-disaster aid, identify its nature and dynamics and examine its importance to the receiving countries as part of their overall reception of foreign assistance. We view this description as a first step in examining the efficacy of post-disaster foreign aid.
As far as we could find, no one has ever looked at these issues systematically, in spite of their obvious importance. Even a tabulation of the extent of post-disaster aid that is typically forthcoming after catastrophic disasters is difficult given the possibilities that aid pledges are distinct from the amounts actually disbursed, and much of what is disbursed is relabeled aid. Becerra et al. (Reference Becerra, Cavallo and Noy2014) examine the importance of post-disaster aid surges in relation to the amount of incurred damages. Here, we examine large catastrophic events, and describe the ways in which these events affect total aid flows, and their components. We try to avoid some of the difficulties in identification by exploiting the detailed bilateral data available through the Development Assistance Committee (DAC), the OECD body responsible for tracking aid flows. We describe, separately for each of the largest donors, their disbursements of post-disaster aid, and in particular the extent of cross-sector and cross-country reallocation that is occurring in the aftermath of large disasters.
Our evidence suggests that the expectation of large surges in post-disaster aid flows is not warranted given the current configuration of global foreign aid. We do not find evidence that in the aftermath of catastrophic natural disasters, donors reallocate aid between recipient countries (cross-recipient reallocation). In terms of the humanitarian response to natural disasters, we find some evidence that donor countries provide humanitarian assistance by reallocating aid that was previously provided to other sectors (cross-sector reallocation). This last observation leads us to conclude that research that relies only on data for humanitarian assistance is exaggerating the amount that countries receive in the aftermath of disasters.
First, we review the related literature in order to place our contribution in context. Next, in section 3, we discuss the data in some detail, and introduce some stylized facts on post-disaster aid flows by donor. In section 4, we provide panel VAR estimates of the magnitudes in question. Finally, we conclude with caveats, a policy discussion and topics for further research.
2. The previous literature
The academic literature examining foreign aid is very large, and hardly presents a unified consensus on anything. An extensive recent survey of this literature, Temple (Reference Temple2010), outlines many of the current debates regarding recent trends in aid flows: debt relief as aid, the theory on aid's impact on economic growth, the efficacy of aid, Dutch Disease, crowding-out of investment, governance failures (a variant of the resource curse), volatility and unpredictability of aid flows, principal-agent problems, and conditionality. Remarkably, Temple's (Reference Temple2010) very extensive survey is silent about post-disaster aid, even though the visibility of post-disaster aid in public discussion is quite high, and much of the fundraising of NGOs providing foreign aid is tied to funding requests in the aftermath of well-publicized catastrophes.
Much of the most recent development research involves the analysis of specific aid projects and the implementation of randomized control trials (RCT). Again, much of this recent research does not involve the specific context of disaster relief and reconstruction aid. More RCT projects whose aim is to assess the effectiveness of aid in post-disaster rehabilitation and recovery environments could provide useful insights (e.g., De Mel et al., Reference De Mel, McKenzie and Woodruff2012).
Few papers examine post-natural-disasters aid flows. Yang (Reference Yang2008) uses hurricane intensity data and concludes that official foreign aid increases significantly after disasters; for the developing countries in his sample, 73 per cent of disaster damages are ultimately covered by aid inflows. David (Reference David2011), in contrast, examines a similar question but with a different empirical approach. He finds that aid does not seem to increase after climatic disasters, and its increase following geological ones is delayed and very small. Becerra et al. (Reference Becerra, Cavallo and Noy2014) also attempt to quantify the magnitude of the post-disaster aid surges using a broader sample and data from different sources, and conclude that these are typically much smaller than the estimated magnitude of the destruction.
Most of the papers that examine the determinants of aid flows focus on the supply side, and in particular on the hypothesis that foreign aid is affected by geo-strategic interests (e.g., Drury et al., Reference Drury, Olson and Belle2005; Fleck and Kilby, Reference Fleck and Kilby2010; Fink and Redaelli, Reference Fink and Redaelli2011; Becerra et al., Reference Becerra, Cavallo and Noy2014). In addition to the external geo-strategic considerations, Eisensee and Strömberg (Reference Eisensee and Stromberg2007) find that the amount of aid given after a disaster is influenced by domestic news coverage of the disaster in the donor country, while Raschky and Schwindt (Reference Raschky and Schwindt2012) examine the ways in which the aid is provided.
Beyond these supply factors guiding aid allocations, Olsen et al. (Reference Olsen, Carstensen and Hoyen2003) note that demand factors (i.e., the receiving country's characteristics), and in particular its readiness to absorb new flows through NGOs, are important in determining aid inflows in general. On the other hand, they find little evidence that documented policy effectiveness by the receiving government and the presence of efficient institutional capacity to implement aid projects matter for the magnitude of aid received (although this may vary by the nature of the donating source; see Easterly and Pfutze, Reference Easterly and Pfutze2008).
This literature hypothesizes that there is significant cross-country reallocation (as total aid budgets are politically more difficult to increase than to change the identity of recipients), and that there is cross-sectoral reallocation (as post-disaster humanitarian aid is frequently relabeled aid that was already previously promised in other guises), but does not examine these conjectures. Here, we would like to examine these possibilities using the most comprehensive and detailed available data on bilateral aid flows.
3. Data
3.1. CRS aid data
Detailed data on aid flows are available from the Credit Report System (CRS) of the DAC and from the United Nations' Financial Tracking Service (FTS). The CRS data on Official Development Assistance (ODA) cover annual bilateral aid extended from 27 donor countries to a large number of recipient countries. The FTS database does not aggregate aid flows annually but rather presents information for each international humanitarian aid appeal issued by the UN. Many of these appeals involve natural disasters.
The FTS data have two advantages: first, they provide information for each appeal separately, hence allowing direct one-to-one correspondence between aid flows and individual disasters. Secondly, while the CRS focuses only on OECD donor governments and multilateral organizations, the FTS also tracks aid flows from several large private/NGO donors. However, FTS data are based on donors' voluntary reporting and evidence suggests it misestimates the volume of actual new aid given (see Becerra et al., Reference Becerra, Cavallo and Noy2014). We use the CRS data set because of its more comprehensive nature and because it is based on actual disbursements rather than pledges or commitments. Only the CRS data allow us to answer the questions we pose here on the nature of realized post-disaster aid flows.
The CRS data set includes the aid originating from the 25 members of the DAC, 29 multilateral institutions and two non-DAC countries (Kuwait and the United Arab Emirates) since 1973. CRS records comprehensive information about bilateral and multilateral donors' ODA, including donor and recipient identification data, basic description of the amount, channel of delivery, purpose of the aid activity and some supplementary data. The basic unit of observation in the CRS data set is the aid activity, which according to the OECD definition includes ‘projects and programs, cash transfers, deliveries of goods, training courses, research projects, debt relief operations and contributions to non-governmental organizations’. To be classified as an aid activity, an activity must meet the OECD definition for ODA – that the activity has as its aim ‘the promotion of the economic development and welfare of developing countries, and which are concessional in character with a grant element of at least 25 per cent’.Footnote 1 Each aid activity is reported by the donor agency, and includes detailed information about the amount committed and disbursed, characteristics and purposes.
One central issue in the analysis of the CRS data is their comprehensiveness. In the past, some aid activities were not reported in the CRS, and so the conclusions based on the CRS data may not be accurate in describing the trends in the overall aid activity of DAC countries. It is therefore necessary to assess to what extent we can use the data recorded in the CRS. We measure the completeness of CRS data by the coverage ratio, which we compute by adding the appropriate flows recorded in the CRS data set and comparing them to their aggregate counterparts recorded in the aggregate statistics' DAC data set, which has the official figures of total aid activities by donor and recipient.
We compute the coverage ratio for the total commitments and disbursements of grants and loans, and humanitarian aid disbursements. Commitment information is highly comprehensive (i.e., it covers more than 90 per cent of the whole commitment information) from 2000 onwards, whereas disbursements and humanitarian aid information reached a high coverage after 2002. In what follows, we therefore focus on aid from DAC countries to developing countries between 2002 and 2011 (the high coverage period).
The basic CRS data contain information about the recipient country, the aid flows' channel of delivery and information about the purpose of the project, such as the description and purpose of the aid activity. Between 2002 and 2011, CRS identifies 160 developing countries as recipients of ODA aid activities. The main recipients are countries located in Sub-Saharan Africa, South and Central Asia, East Asia and the Middle East, with an average share of 31.1, 16.3, 10.2 and 9.1 per cent of the total commitments between 2002 and 2011, respectively. When comparing commitments classified as humanitarian aid, the largest share of aid is focused on countries located in Sub-Saharan Africa, with 39.6 per cent of the total, followed by South and Central Asian countries (18.5 per cent) and the Middle East (12.7 per cent). One important feature of this disaggregation is the high share of the unspecified bilateral aid category: 14.7 per cent of the total commitments are classified in this category (12.7 per cent for humanitarian aid).
At the country level, aid commitments are concentrated in a few countries: between 2002 and 2011, one-third of the total aid is concentrated on 10 countries, and almost 50 per cent of the humanitarian aid was directed to 10 countries. The description of the purpose and sector of the aid activities is one of the most important fields for our purposes. The OECD asks donors to classify their aid activities according to the purpose that donors specify, using a broad sector classification and a particular subclass. The major part of the commitments is dedicated to social infrastructure and services (38.4 per cent of the total between 2002 and 2011), followed by economic infrastructure and services (15.4 per cent) and action relating to debt (9.7 per cent).
For humanitarian aid, there are three main subsectors that in turn have their own purpose. Between 2002 and 2011, the average number of activities is 8,521 per year. Out of the total of humanitarian aid, emergency response is the sector that represents the most common activity, with around 83 per cent of total commitments. Inside the emergency response sector, the main purpose is emergency relief, which accounts for 56 per cent of the total humanitarian aid between 2002 and 2011, followed by emergency food aid (25 per cent).Footnote 2
The CRS data set also includes information about the type of financing, with two main categories: grants and loans. Grants represent around 77 per cent of the total commitments, whereas the remaining 23 per cent is for loans. Not surprisingly, grants represent around 97 per cent of the total humanitarian aid. The United States, Japan, Germany, France, the United Kingdom and the Netherlands are the most important donors, and together represent 75 per cent of the total commitments among the DAC countries. For humanitarian aid, the United States, United Kingdom, Japan, the Netherlands and Canada are the biggest donors.Footnote 3
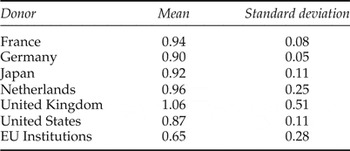
Finally, although commitments and disbursements are closely tied, actual disbursements tend to be lower than the original ODA commitments. Table 1 presents the average and standard deviation of the disbursement to commitment ratio for the largest six donor countries (France, Germany, Japan, the Netherlands, United Kingdom and United States) and the largest multilateral donor (EU Institutions) between 2002 and 2011. For each country, disbursements represented about 90 per cent of the total commitments with a standard deviation of 20 percentage points. The main differences between the disbursement and commitment data occurred in the United Kingdom and EU Institutions, mainly caused by large deviations in particular years.
ODA disbursements to commitment ratio for large donors, 2002–2011

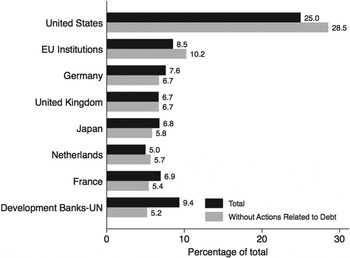
In light of the significant discrepancies between aid commitment and disbursement data, we focus on the latter. The CRS database, covering the period 2002–2011, includes information on 1,746,431 aid activities.Footnote 4 ,Footnote 5 Preliminary analysis suggested that different donors react differently to the need for disaster-related emergency aid, and we therefore focus on the largest donors and examine them separately. We kept the data for the largest six donors from the DAC countries (France, Germany, Japan, the Netherlands, United Kingdom and United States) and two multilateral donor groups (EU Institutions, and Development Banks and UN Institutions). Overall, these six countries and two groups account for about 75 per cent of the total ODA disbursement activity. Details about the breakdown of these disbursements by the eight donors (six countries and two multilateral groupings) are provided in figure 1.
Share of disbursements in total by donor (average 2002–2011)

The next step was to collapse the events by donor-recipient-year-sector category.Footnote 6 The collapsed data set has 40,735 observations, with information about 144 recipient countries.Footnote 7 The number of recipient countries varies by donor: Japan is the donor with the most recipients (it is linked to 133 countries), whereas the United Kingdom is the one with the lowest number (47 recipient countries).
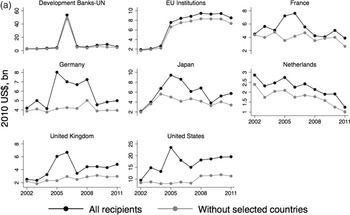
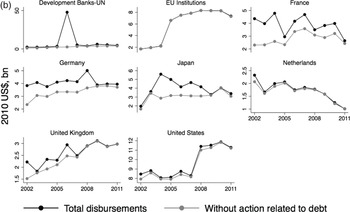
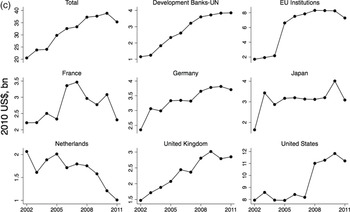
We dropped eight countries that are of strategic interest for some of the large donors and show very different patterns in aid trends. These are: Afghanistan, Iraq, Nigeria, Pakistan, Republic of Congo, Democratic Republic of Congo, Ethiopia and the ex-Yugoslavian states.Footnote 8 As figure 2a shows, most of the upward trend observed in the largest donors is explained by the activities of donors in those countries.Footnote 9 We also dropped the Action Relating to Debt (600), since in 2006 the heavily indebted poor countries (HIPC) initiative represents an abnormal jump in the aid flows from the multilateral organizations (see figure 2b). Figure 2c shows the resulting trends for total disbursements by donor.Footnote 10
Total disbursements by donor, with/out selected countries

Total disbursements by donor, with/out debt relief

Total disbursements by donor, 2002–2011

3.2. Disaster data
Almost all the empirical work on natural disasters relies on the publicly available Emergency Events Database (EM-DAT) maintained at the Catholic University of Louvain, Belgium (see http://www.emdat.be/). EM-DAT defines a disaster as a natural situation or event that overwhelms local capacity and/or necessitates a request for external assistance. Disasters can be: hydro-meteorological, including floods, wave surges, storms, droughts, landslides and avalanches; geophysical, including earthquakes, tsunamis and volcanic eruptions; and biological, covering epidemics and insect infestations (the latter are very infrequent).
The disaster impact data reported in the EM-DAT database consist of direct damages (e.g., value of damage to infrastructure, crops and housing in current dollars), the number of people killed and the number of people affected. As Cavallo and Noy (Reference Cavallo and Noy2011) observe, many of the events reported in this database are quite small and are unlikely to have any significant impact on aid disbursements. We limit our investigation only to very large disasters and identify the largest using the algorithm described below.
We started with events occurring between 2002 and 2011, including only hydro-meteorological and geophysical events (sudden-onset natural hazards). Using the information on damages and mortality, we only kept events with more than 10 people killed and damages greater than 2011 US$10 million: 1,485 events. Next, we created a list of catastrophic events, defined as the events for which the number of either total killed or killed to population ratio was greater than the respective sample average (611 killed and 24.14 killed per million inhabitants). This list of large catastrophic disasters has 72 events. For this list of large events, we created a new variable measuring media coverage, based on the AP archive website.
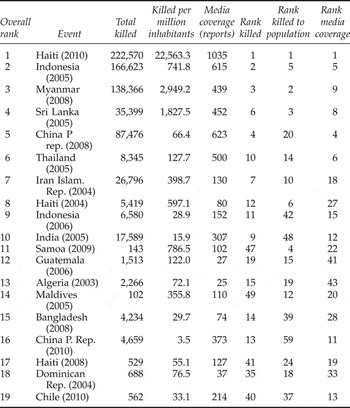
We next collapsed the data set from an event level to a country-year level,Footnote 11 and aggregated the intensity variables over all the events occurring in the same country during the same year. The collapsed data set had 66 year-country observations. Finally, from the 66 country-year disaster observations, we chose the final list of large catastrophic events. First, we generated a ranking for each intensity variable: number of killed, killed to population ratio and media coverage. Secondly, we generated an aggregate score that is the sum of the three mentioned rankings. Thirdly, we defined a large catastrophic event as the top 25 events based on the composite score. After we merged this list with the available aid data, the list of usable large events includes 19 large disasters (see table 2).Footnote 12
Catastrophic natural disasters

4. Empirical results
4.1. Aid after catastrophic disasters: some possibilities
Many research projects have examined aid data from the donors' perspective. Here, however, we are more interested in the recipients, their experience with obtaining aid after catastrophic events, and what these patterns imply for their incentives. For several of the disaster events in our sample (Bangladesh, Indonesia, Myanmar and Sri Lanka), there are remarkable surges related to the catastrophic events we identified, and in some cases (e.g., Haiti) those increases are large enough to suggest that there may be cross-country reallocation in donor accounts (see the online appendix, available at http://journals.cambridge.org/EDE). On the other hand, there are some catastrophic events that did not record an aid surge and that in general received little aid that can be directly associated with the catastrophic event. Examples include the flood in the Dominican Republic in 2004, cyclone Sidr in Bangladesh in 2007 and the China earthquake in 2010.
The 2004 tsunami demanded the attention of all donors. In particular, there are two effects that are remarkable with the events related to the 2004 Indian Ocean tsunami: first, most of the donors reported increases in humanitarian aid to the most affected countries –Indonesia and Sri Lanka. Secondly, the duration of the associated aid surges for these countries is longer than the typical post-disaster aid surge; a review of the narrative description of aid projects reveals that there are additional aid-funded activities up to 2009, especially reconstruction expenditures.
Because of the richness of information of CRS and EM-DAT data sets, there are different ways to analyze the effect of a catastrophic event on bilateral aid. First, we note how different effects should look, and in the next section, look for those patterns in the data. The response of bilateral aid after a catastrophic event depends on the interaction of two different effects: (1) complementarities between donors; donors coordinate the necessary actions to meet the aid requirements of a particular recipient country; (2) reallocation between recipients and sectors. Becerra et al. (Reference Becerra, Cavallo and Noy2014) conclude that the overall aid inflows in the aftermath of a disaster event are fairly limited (relative to disaster magnitude), so the evidence of the complementarity effect is fairly limited. We therefore focus on the second type of dynamics.
Let us assume that a catastrophic event occurred in the r* country at period t*, and assume further that donor d decides to increase the bilateral aid to r*. Then, at the recipient country level, the response of total aid from donor d must be one of the following three cases. (1) The aggregate ODA from that donor does not increase because of cross-recipient reallocation; after the catastrophic event, the donor reallocates the current ODA resources from other recipients to r*. (2) Aggregate ODA increases in the same amount as the increase in ODA for recipient r*, i.e., no cross-recipient reallocation. And (3) neither aggregate ODA nor ODA for the recipient country increases; we call this possibility cross-sector reallocation. The donor country does not reallocate resources across recipients, but instead it provides humanitarian aid by reallocating ODA from recipient r*'s aid previously provided for other sectors.
4.2. Post-disaster aid data: cross-country reallocation
We next consider all the aid surges for all the donor–recipient pairs, and specifically in conjunction with the previously identified large catastrophic events. We define an aid surge as the difference between the aid flows for the year or the two-year period following the disaster onset, and the average aid flows in the two years preceding the event. The full data are presented in the online appendix.
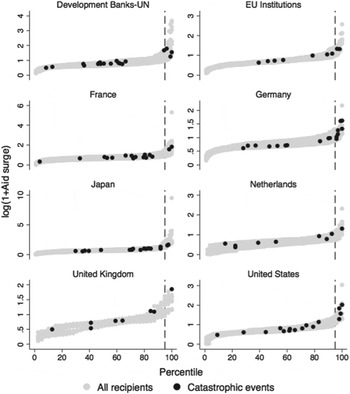
We summarize these data in figure 3, which plots the distribution of all the aid surges in the data set, and specifically highlight the aid surges that are associated with catastrophic natural disasters. Even in the aftermath of the largest catastrophic events, not all the donors react with large (abnormal) increases in aid to the disaster-hit country recipient. Not surprisingly, the most remarkable aid surges are related to the largest four catastrophic events (in terms of absolute mortality levels): the 2010 Haiti earthquake, the 2004 Indian Ocean tsunami in Sri Lanka and Indonesia, and Cyclone Nargis in Myanmar. The US response to the aftermath of the 2010 Haiti earthquake is the highest surge in absolute value (2010 US$815 million, 3.8 times higher than the previous two-year average).
The distribution of aid surges

Even though we observe large increases in ODA for some of the large disasters, most of them are not large compared with the level of the total ODA activities of a donor country. We identified, in figure 3, 25 recipient–donor pairs as large aid surges out of a possible 118. We also find that the increases in total ODA to the recipient tend to be low when compared to the increase in the aggregate ODA from that donor in most cases. This pattern, of course, suggests that the cross-country reallocation is typically not observed, but it also suggests that donor countries do not seem to mobilize all available resources even in the aftermath of quite catastrophic events (for the affected countries).
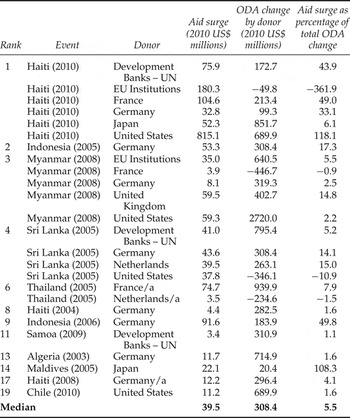
Table 3 shows the largest aid surges highlighted in figure 3, and compares them to the change in the total ODA by donor (relative to the previous two-year average) for the same year. After a large surge, the median increase in ODA by recipient was 2010 US$39.5 million, whereas the median increase in total ODA by donor was 2010 US$308.4 million. As a proportion of the change in total ODA, the median change in ODA by recipient represented 5.5 per cent of the total change by donor country.
Post-disaster aid surges

Notes: Figures are those reported for the year after the catastrophic event occurred.
Aid surge is the difference between the aid flows in the year the disaster occurred and the average aid flows in the two years preceding the catastrophic event.
In summary, after the occurrence of a catastrophic event, not all the donors increase ODA dramatically; moreover, the increase in ODA is typically smaller than the one observed for the aggregate ODA – except for the cases of Haiti – EU Institutions (2010), Haiti – United States (2010), Sri Lanka – United States (2005) and Maldives – Japan (2005). The evidence suggests that the cross-country reallocation of foreign aid to channel more aid to an affected country is low.
4.3. Post-disaster aid data: humanitarian aid
The CRS data set classifies the bilateral aid flows according to their intended sector (social, infrastructure, etc.). We would like to describe the sectoral composition of post-disaster aid surges; i.e., we ask what the sectoral characteristics of this aid are. We considered only the sectors with the largest share in total aid activities from the largest donors we had already identified. The relative importance of the sectors varies between the donors, but for consistency we examine the same five biggest sectors for all donors. These sectors are: social infrastructure and services, economic infrastructure and services, production sectors, humanitarian aid, and multi-sector.Footnote 13
We separate the analysis by donor country, having a two-dimensional panel data set for each donor country (recipient/year, whereas aid in each sector becomes the variable of interest). Implicitly, we are assuming in this analysis that the aid decision is donor driven and that donors do not coordinate their aid disbursements. In what follows, the analysis is carried out by group of recipients given a donor.
We start by examining the impact of an event (a catastrophic disaster in a recipient) on humanitarian aid. This examination is both interesting in and of itself, and important since a lot of the empirical research on disaster aid cited earlier only uses humanitarian aid flows, implicitly assuming that only these flows are related to post-disaster assistance. Using a similar approach to the one used in the previous section, we analyze the aid surges for the humanitarian aid sector in the aftermath of a catastrophic event. The full results of these tabulations and figures are presented in the online appendix (figure A12). We plot the distribution of humanitarian aid surges, while highlighting all the recipient–donor pairs for the large catastrophic events previously identified. For these, we compute the humanitarian aid surges, and compare them to the overall change in ODA for the same period.
The data suggest there is an occasional shift of the donors, in the aftermath of catastrophic events in recipient countries, towards humanitarian aid; this increase is more frequently accompanied both by an overall increase in aid but with some cross-sector reallocation. While there are a few cases of large aid surges in aggregate ODA, humanitarian aid tends to show large aid surges in many of the countries with large catastrophic events. Out of the total 118 pairs listed (see online appendix table A4), 20 humanitarian aid surges are greater than percentile 95 of the humanitarian aid surge distribution by donor, and for 25 events the recipient countries were not receiving any humanitarian aid before the catastrophic event. Secondly, many of the cases in which an overall aid surge is identified as large do not coincide with a large aid surge in humanitarian aid. Out of the 25 events we previously classified as a large aid surge, 12 are in the top 5 per cent of the humanitarian aid surge distribution.
Thirdly, for the largest catastrophic events, the changes in humanitarian aid are more than half the change in total ODA; in general, this percentage tends to increase with the intensity of the event. For Japan's foreign aid provision, the change in humanitarian aid is larger than the change in the total ODA, providing suggestive evidence of cross-sector reallocation. For the first four large catastrophic events, the change in Japanese humanitarian aid is at least of the same magnitude as the change in total ODA. Similarly, the change in humanitarian aid accounts for almost 60 per cent of the change in total ODA from other donors, but the importance of the change in humanitarian aid over the total change in ODA is smaller as the intensity of the event falls. The exception to this trend is the Chilean case, for which the ranking of the event is relatively low, but the change in humanitarian aid accounts for the main part of the total change in ODA.
To summarize this section, while humanitarian aid is on some occasions the main driver for a post-disaster aid surge, in many cases it is not. There are many cases in which a donor country increased its post-disaster aid without a surge in humanitarian aid being observed, and equally instances in which humanitarian aid surged but total bilateral aid did not, as the donor country cross-allocated funds from other sectors to humanitarian assistance. As such, using humanitarian aid in an investigation of post-disaster aid patterns is at best incomplete and at worse misleading.
4.4. Cross-sector post-disaster aid patterns
If examining humanitarian aid by itself is not sufficient in order to understand post-disaster aid patterns, the next step is to more fully describe the sectoral allocation of aid in post-disaster environments, by donor. Some sectors have a consistent large share across the donor countries we observe. Although the shares varied between donor countries, four sectors were the most prominent across these donors: social infrastructure and services, economic infrastructure and services, production sectors, and multi-sector/cross-cutting activities. Given our interest in the role of post-disaster aid in total aid flows, we also included in the analysis the humanitarian aid sector, which had a share larger than 10 per cent for EU Institutions, the Netherlands and the United States.
In order to analyze the donor's choice of how to allocate aid after a catastrophic event, an appealing approach is to study a version of Balassa's relative comparative advantage index, which we call the Relative Importance (RI) index. For each pair of donor–recipient (i, j), the RI index is defined as the ratio between the disbursements' share for a specific sector in a recipient country, and the total share of aid of the donor country in the same sector. Formally, our RI index is defined as:
 $$RI_{j\comma s\comma t}^i = \displaystyle{{\displaystyle{{Ai{d_{i\comma j\comma s\comma t}}} \over {\sum\nolimits_{{s^/}} {Ai{d_{i\comma j\comma {s^{\prime}}\comma t}}} }}} \over {\displaystyle{{\sum\nolimits_{{j^{\prime}}} {Ai{d_{i\comma {j^{\prime}}\comma s\comma t}}} } \over {\sum\nolimits_{{j^{\prime}}} {\sum\nolimits_{{s^{\prime}}} {Ai{d_{i\comma {j^{\prime}}\comma {s^{\prime}}\comma t}}} } }}}}$$
where s and t stand for the sector and time indexes.
The RI index is suitable for our analysis because it summarizes in one number two different dimensions of our data: on the one hand, it quantifies the importance of a specific sector in the total aid of a recipient country. On the other hand, it compares this share relative to the same share for a reference group of countries. Moreover, the RI index has a clear reference point: a value of RI greater than one implies that compared with the other countries in our sample, country j is receiving more aid in that specific sector, and so the countries with a RI j,s,t i ≥ 1 are the countries in which the donor focuses their aid for that sector.
Consider, for example, the humanitarian aid sector in a particular country after the occurrence of a catastrophic event. In this case, an increase in the RI index implies that the change in humanitarian aid for a given country is larger than the variation in the total share that the donor country disbursed as humanitarian aid for all the reference countries. This is particularly useful in cases in which there was more than one catastrophic event per year, for example, the 2004 Indian Ocean tsunami, in which Indonesia and Sri Lanka received more humanitarian aid than India and Thailand.
The basic bivariate cross-correlation coefficient provides an alternative way of analyzing the patterns of post-disaster aid flows. We compute the cross-correlation coefficient as
 $$Corr \left(RI_{j\comma s\comma t}^{i}\comma \; RI_{j\comma s\comma t-k}^{i}\right)= \displaystyle{{1} \over {\vert j \vert}} \sum_{j^{\prime}} Corr \left(RI_{j^{\prime}\comma s\comma t}^{i}\comma \; RI_{j^{\prime}\comma s^{\prime}\comma t-k}^{i}\right)$$
where |j| stands for the number of countries with a non-zero correlation coefficient (i.e., countries which have a non-constant value of RI j,s,t i across the sample). The set of correlation coefficients for each donor country allows us to identify some patterns in the cross-sectoral allocation; we focus on the main five aid sectors: social infrastructure (100), economic infrastructure (200), production sectors (300), multi-sector/cross-cutting (400) and humanitarian aid (700).
Figure A1 in the online appendix shows a summary of the estimated correlation coefficients for all donors. We display the range between the largest and smallest correlation coefficient obtained for each pair of sectors, pooling all the donor countries. The panel located at the first row and fifth column, for example, displays the correlation coefficients between the RI index for social infrastructure and lags of the RI index for humanitarian aid. In the first range (at lag 0), the graph displays the range of the maximum and minimum correlation coefficient estimated by donor for between those two sectors (−0.25 for the Netherlands and −0.59 for the United States).
The figure makes evident some patterns in the data. Humanitarian aid flows tend to be uncorrelated with their past: the range of the autocorrelation coefficients for all countries is roughly centered around zero for all lags, and shows the smallest dispersion among the autocorrelation of all sectors (graphs located at the main diagonal). Thus, a shock in the humanitarian aid sector tends to be short lived, lasting about one year. Even though this may be the case for other sectors (for example, the economic infrastructure sector), the range of the correlation is wider for them, suggesting that, at least for some donors, there is persistence in the level of aid focused on these other sectors. This is not surprising, as many ODA projects may be investment projects lasting more than one year, whereas the humanitarian aid is designed for a short-run response. If any, the RI for humanitarian aid showed a negative contemporaneous correlation (between −0.6 and −0.25) with the social infrastructure sector, and does not show a definite pattern with changes in the other considered sectors. Finally, correlation between humanitarian aid and changes in the other sectors was low in the subsequent observations.
A more formal approach to examining the dynamic relationship between the different flows (by sectors) is the use of a panel VAR with exogenous variables (PVAR) model, defined as:
 $$\eqalign{\left[{ \matrix{RI_{j\comma 100\comma t}^{i} \cr RI_{j\comma 200\comma t}^{i} \cr RI_{j\comma 300\comma t}^{i} \cr RI_{j\comma 400\comma t}^{i} \cr RI_{j\comma 700\comma t}^{i} \cr } } \right] = & \sum_{k=0}^p{\left[{ \matrix{ a_{1\comma 1}^{i\comma k} & a_{1\comma 2}^{i\comma k} & a_{1\comma 3}^{i\comma k} & a_{1\comma 4}^{i\comma k} & a_{1\comma 7}^{i\comma k} \cr a_{2\comma 1}^{i\comma k} & a_{2\comma 2}^{i\comma k} & a_{2\comma 3}^{i\comma k} & a_{2\comma 4}^{i\comma k} & a_{2\comma 7}^{i\comma k} \cr a_{3\comma 1}^{i\comma k} & a_{3\comma 2}^{i\comma k} & a_{3\comma 3}^{i\comma k} & a_{3\comma 4}^{i\comma k} & a_{3\comma 7}^{i\comma k} \cr a_{4\comma 1}^{i\comma k} & a_{4\comma 2}^{i\comma k} & a_{4\comma 3}^{i\comma k} & a_{4\comma 4}^{i\comma k} & a_{4\comma 7}^{i\comma k} \cr a_{7\comma 1}^{i\comma k} & a_{7\comma 2}^{i\comma k} & a_{7\comma 3}^{i\comma k} & a_{7\comma 4}^{i\comma k} & a_{7\comma 7}^{i\comma k} \cr }} \right]} \quad {\left[{ \matrix{RI_{j\comma 100\comma t-k}^{i} \cr RI_{j\comma 200\comma t-k}^{i} \cr RI_{j\comma 300\comma t-k}^{i} \cr RI_{j\comma 400\comma t-k}^{i} \cr RI_{j\comma 700\comma t-k}^{i} \cr}} \right]} \cr & + \left[{ \matrix{ b_{1}^{i} \cr b_{2}^{i} \cr b_{3}^{i} \cr b_{4}^{i} \cr b_{7}^{i} \cr } } \right]X_{j\comma t} + \left[{ \matrix { u_{j\comma 100\comma t}^{i} \cr u_{j\comma 200\comma t}^{i} \cr u_{j\comma 300\comma t}^{i} \cr u_{j\comma 400\comma t}^{i} \cr u_{j\comma 700\comma t}^{i} \cr } }\right]}$$
where X j,t is a dummy variable indicating whether a catastrophic event occurred, and u j,s,t i = α j,s i + v j,s,t i is the composite error term, the sum of the individual unobserved term α j,s i and the error term v j,s,t i . Because the previous analysis suggests a low level of persistence, and the time series is short (10 years), we include only one lag (p = 1).Footnote 14
We investigate the impulse response functions, the response of the system given a shock in the catastrophic event variable (X j,t ). This examination enables us to identify if there were contemporaneous effects in the other sectors, and how these are typically transmitted. Given a shock in the catastrophic event indicator, the average response of the RI index of the humanitarian sector is positive and significant only for the United States and EU Institutions – the two largest donors in our sample. For these two donors, the contemporaneous response of the RI index of the social infrastructure and sectors is negative and significant, and for the United States, the contemporaneous response of the RI index for the production sector is also negative and significant. Although not significant, the negative contemporaneous response of the RI index for the social infrastructure sector is observed in another four cases (Germany, Japan, the Netherlands and the United Kingdom), which suggests that, to the extent that there is some cross-sectorial reallocation, the reallocation seems to be stronger between the infrastructure to humanitarian aid sectors.
4.5. Panel VAR for aid across sectors in response to a disaster event
In the previous section, we examined the impact of a change (shock) in one type of aid flow on other sectorial aid flows originating from the same donor country (and aggregated across disaster events). In this next step, we use similar panel VARs to investigate the impact of a disaster event on all types of aid flows (from the same donor). Before we present the VAR results, however, it is worth noting from a before-and-after comparison that even though there is significant heterogeneity within each sector and donor, some observed patterns are noteworthy: humanitarian aid increases in the year of the disaster for almost all donors, social infrastructure investment consistently falls for the United States in the year of the disaster, the humanitarian aid surge appears to last only one period, and there is no clear pattern for the other sectors and donors.Footnote 15
The response to a shock in the catastrophic event indicator variable is presented in the figure 4 panels. We present the VAR results for the five biggest aid flow sectors previously mentioned, and separately for the largest eight donors in our sample. These five sectors satisfy three conditions: (1) they are important for the donor (the aggregate share by donor is large); (2) they are important for the recipients (the average share per recipient is large); and (3) they are important for the majority of recipients (the share is non-zero for the major part of the country-year observations).
We find some evidence of partial reallocation across sectors, but the data are fairly noisy, and this reallocation effect is statistically indistinguishable from the null of ‘no effect’ for most of the donor countries (see figure 4). This reallocation effect, however, does seem to be notable in the US data; i.e., from the five biggest donors, the United States is the likeliest to reduce flows in other sectors once a disaster has an impact and humanitarian aid has increased.
Response of aid (by sector) to a disaster shock (as percentage of GDP)

5. Conclusions, caveats and some comments on policy
After examining the most detailed bilateral aid data available, we find three dominant patterns for aid in the aftermath of catastrophic disasters. First, the magnitudes and patterns of post-disaster aid are not consistent, and are very different across donors and across disaster events. Secondly, there is little evidence that donors reduce their aid to other countries when they boost aid to a country that suffers a catastrophic event. Thirdly, donors do sometimes engage in cross-sectoral substitution in the aftermath of an event, reducing their aid in other sectors to the same recipient, while increasing humanitarian aid. This observation leads us to conclude that research efforts that rely only on data for humanitarian assistance are mis-measuring the amount that affected countries receive in the aftermath of disasters. We investigated the robustness of our insights in several ways, including examining a larger set of disaster events, and splitting the sample between disasters experienced in high- and low-income countries. All of these robustness results are included in the online appendix. Our contribution is intended to be descriptive, and should not be viewed as either prescriptive or as identifying the fundamental characteristics that lead to the outcomes we describe.
An issue we have not explored sufficiently here is the dramatic difference between aid promises and actual disbursements; an example is the Haitian post-quake aid with only 62 per cent disbursement rate. Equally important is Becerra et al.'s (Reference Becerra, Cavallo and Noy2014) finding that generally the aid surges that follow disasters are not sufficient to cover the disasters' costs. A theoretical insight of these descriptions is also outside the scope of this paper, but should provide a fruitful goal for future research.
Another important question, of course, is not how much aid arrives in a disaster-stricken country, but rather what the aid accomplishes. Generally, it is not well documented that aid reaches its intended recipients, and supports the projects that are most worthy of support (in the sense of generating the most desirable outcomes) (see, for example, Werker et al., Reference Werker, Ahmed and Cohen2009; Aldrich, Reference Aldrich2010; Becchetti and Castriota, Reference Becchetti and Castriota2011; Takasaki, Reference Takasaki2011; Resosudarmo et al., Reference Resosudarmo, Sugiyanto and Kuncoro2012). Ultimately, the desire is to place affected communities on a long-term sustainable path of prosperity. Whether post-disaster aid assists in that process, if it indeed occurs, is not really known. The copious research on aid and growth more generally allows one to be skeptical, but the circumstances of post-disaster aid are quite different, and we believe that that conclusion would be unwarranted. Overall, however, it seems that in any case the aid that does arrive is not sufficient, and successful reconstructions cannot depend on aid alone.
The fact that post-disaster aid is unpredictable, and countries suffering disasters have quite a heterogeneous experience with post-disaster aid receipts, imposes its own costs. Aid becomes both uncertain and volatile. As Agénor and Aizenman (Reference Agénor and Aizenman2010) have shown, this uncertainty and volatility leads in itself to inefficient policy choices among recipient countries.
Supplementary materials and methods
The supplementary material referred to in this paper can be found online at journals.cambridge.org/EDE/.