


Because of a production error, we are recreating Table 1.
Table 1.
Demographic and clinical characteristics of the study participants (N = 117)

M = mean, SD = standard deviation. *p < 0.05, **p < 0.01.
Published online by Cambridge University Press: 10 July 2015
Because of a production error, we are recreating Table 1.
Demographic and clinical characteristics of the study participants (N = 117)
M = mean, SD = standard deviation. *p < 0.05, **p < 0.01.
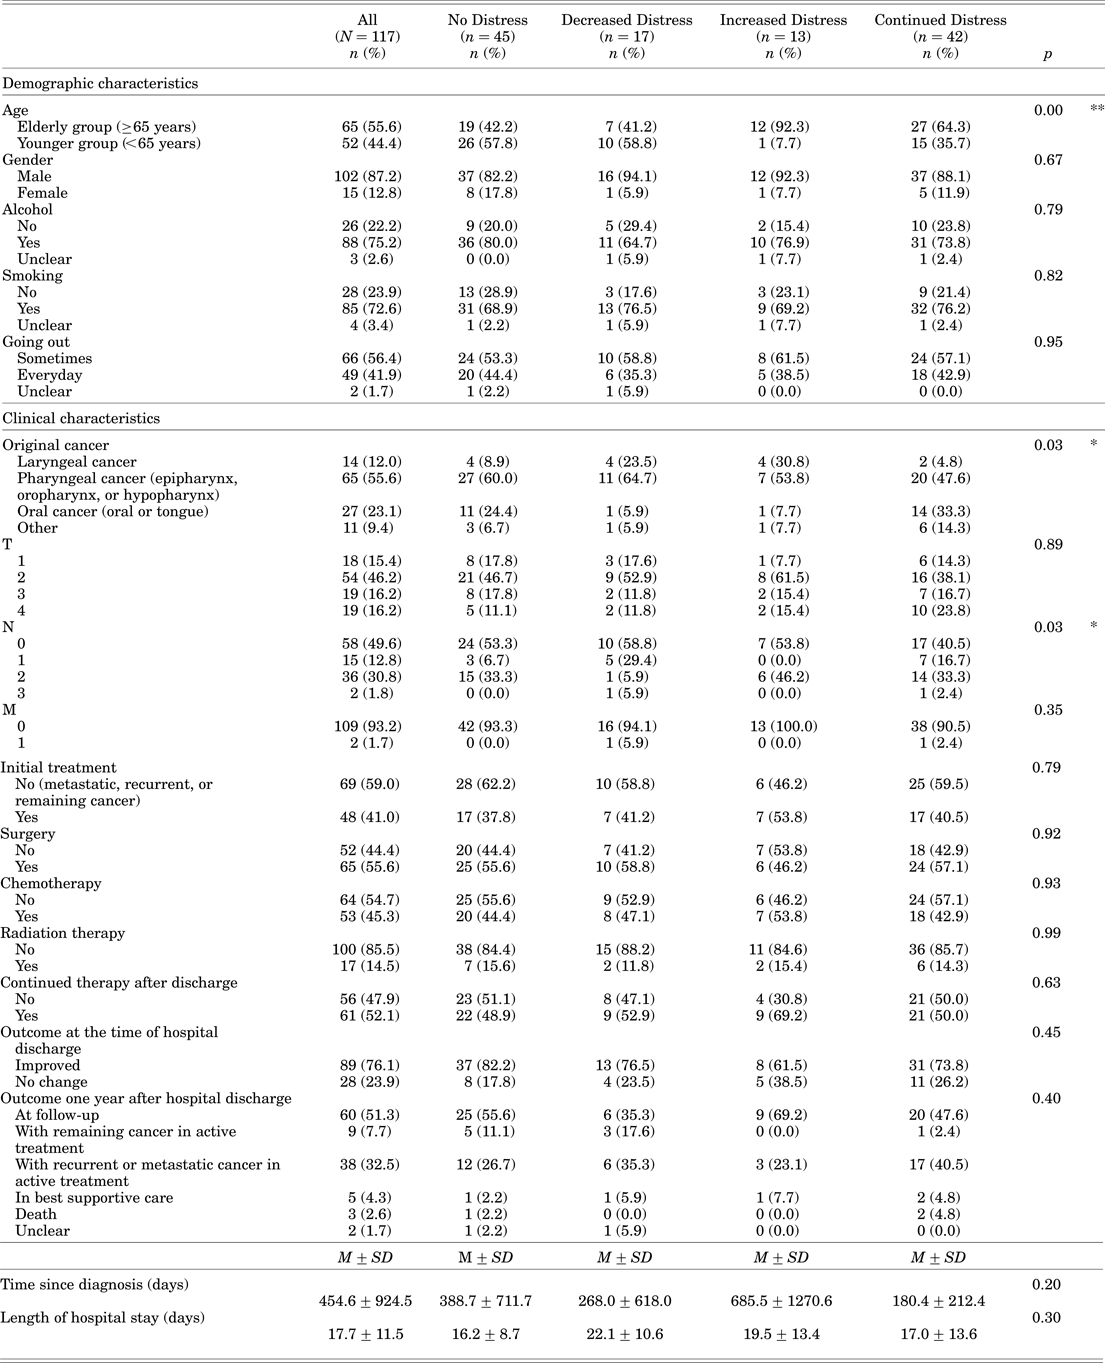
Table 1. Demographic and clinical characteristics of the study participants (N = 117)
 You have
Access

