

Introduction
In Western countries, many people die with dementia and most die in nursing homes (Mitchell et al., Reference Mitchell, Teno, Miller and Mor2005). At least 27 quantitative studies on end of life with dementia have been published prior to 2008. Almost all were small and/or retrospective. Most were conducted in the U.S.A., and some in Canada, the U.K., Italy, Israel, Switzerland, Spain, and the Netherlands (van der Steen et al., Reference van der Steen, Ribbe, Deliens, Koopmans and Onwuteaka-Philipsen2007a; Reference van der Steen and Ribbe2007b). These studies cannot be compared directly due to the use of different design and measurement instruments, yet direct comparison would be useful to identify those areas where care can be improved (van der Steen et al., Reference van der Steen2008a).
Further, validity of the instruments in dementia patients has not always been tested (Teno, Reference Teno2000; Steel et al., Reference Steel2003), is uncertain (Hearn and Higginson, Reference Hearn and Higginson1999; Brandt et al., Reference Brandt, Deliens, van der Steen, Ooms, Ribbe and van der Wal2005), or the instruments were not developed for evaluating the last days of life specifically (Steel et al., Reference Steel2003; Aminoff et al., Reference Aminoff, Purits, Noy and Adunsky2004). Development of a measure of Quality of Dying in Long-Term Care (QOD-LTC) explicitly considered validity in residents with cognitive impairment (Munn et al., Reference Munn2007; Caprio et al., Reference Caprio2008), but the most comprehensive and most specific set of instruments specific to assess end of life with dementia are the End-of-Life in Dementia (EOLD) scales (Volicer et al., Reference Volicer, Hurley and Blasi2001; Reference Volicer, Hurley and Blasi2003).
The EOLD scales include the “Satisfaction With Care” (SWC), “Symptom Management” (SM) and “Comfort Assessment in Dying” (CAD) scales which were originally rated by family caregivers using a written survey (Volicer et al., Reference Volicer, Hurley and Blasi2001; Reference Volicer, Hurley and Blasi2003). We regard the SM and CAD scales as outcomes rather than process (quality of care) measures, while the SWC addresses both – satisfaction being an outcome and specific items addressing quality of care issues (Stewart et al., Reference Stewart, Teno, Patrick and Lynn1999; Hales et al., Reference Hales, Zimmermann and Rodin2008). The EOLD scales were sensitive to differences across national settings: in the U.S.A., end-of-life care at home was evaluated as better than end of life in nursing homes or in hospitals (Volicer et al., Reference Volicer, Hurley and Blasi2003). They are used in ongoing prospective studies in the U.S.A. and the Netherlands (Engel et al., Reference Engel, Kiely and Mitchell2006; Kiely et al., Reference Kiely, Volicer, Teno, Jones, Prigerson and Mitchell2006; Mitchell et al., Reference Mitchell, Kiely, Jones, Prigerson, Volicer and Teno2006; van der Steen et al., Reference van der Steen, Ribbe, Deliens, Koopmans and Onwuteaka-Philipsen2007a; Reference van der Steen2008b). However, there have not been any cross-national comparative studies to test if the EOLD total and item scores are sensitive to differences between countries in similar institutional settings and if such differences could be interpreted in terms of care elements that need improvement in these countries.
Cross-nationally, end-of-life care for residents can vary widely. For example, studies on pneumonia in nursing home residents with dementia identified major differences between U.S. and Dutch care (van der Steen et al., Reference van der Steen2004; Helton et al., Reference Helton, van der Steen, Daaleman, Gamble and Ribbe2006). Dutch nursing home physicians are on-staff and usually know the residents and their family well, long before the death is imminent (Hoek et al., Reference Hoek, Penninx, Ligthart and Ribbe2000; Helton et al., Reference Helton, van der Steen, Daaleman, Gamble and Ribbe2006). Decisions to withhold curative treatment were more frequent for Dutch than for U.S. residents. Nevertheless, most types of treatments to relieve symptoms were used sparingly among U.S. (Missouri) and Dutch residents with pneumonia and dementia, but dying Dutch residents did receive morphine frequently (van der Steen et al., Reference van der Steen2004; Reference van der Steen, Kruse, van der Wal, Mehr and Ribbe2007c). Instruments evaluating end of life with dementia may reflect such differences between countries.
In this pilot study, we evaluated end-of-life experiences of Dutch nursing home residents and compared them with earlier collected data from U.S. residents who had died with dementia using family ratings of EOLD scales, to detect differences between the two studies. We additionally explored association of the EOLD scales with some other variables.
Methods
The two studies
The Dutch study was performed in four nursing homes as a pilot for a larger ongoing prospective study (van der Steen et al., Reference van der Steen, Ribbe, Deliens, Koopmans and Onwuteaka-Philipsen2007a; Reference van der Steen2008b). Data were collected between November 2005 and July 2007. Participating homes were an urban and a rural traditional home, and an urban and a rural “anthroposophic” home. Anthroposophy is a philosophy of life in which dying is considered as a transition to another form of life, a birth into the spiritual world. As well as supporting symptom management, palliative anthroposophic care places great importance on meeting the dying person's emotional, social and spiritual needs, possibly even more so than traditional palliative care systems. EOLD SM and CAD scores, but not the SWC scores, have been shown to be more favorable in relation to anthroposophic nursing homes (Gijsberts et al., Reference Gijsberts, van der Steen, Muller and Deliens2008).
Nurses identified the family caregiver who had been most involved in the last months of life of each resident with dementia (as diagnosed by a physician) who had died within the period of data collection. Questionnaires were completed about two months after death. Family caregivers were provided with a mailed questionnaire including the EOLD items. The response rate was 61% (54/89). The study protocol was approved by the Medical Ethics Committee of the VU University Medical Center in Amsterdam.
The U.S. study is described in more detail elsewhere (Volicer et al., Reference Volicer, Hurley and Blasi2001; Reference Volicer, Hurley and Blasi2003). The data of this national study were collected between January and June 1999, and have been used to develop the EOLD. Families of residents with dementia whose relatives had died in the preceding year completed a mailed or handed out questionnaire that included all EOLD items. For the purpose of the comparison, we selected 76 U.S. residents who died in a nursing home.
Dementia severity was measured by the Bedford Alzheimer Nursing-Severity (BANS-S) comprising seven items. Total scores range from 7 to 28 (Volicer et al., Reference Volicer, Hurley, Lathi and Kowall1994; Bellelli et al., Reference Bellelli, Frisoni, Bianchetti and Trabucchi1997). In the U.S. study, families completed the BANS-S while in the Dutch study it was completed by nurses. Items are straightforward (e.g. eating dependency, eye contact) and reflected status 90 days before death.
The EOLD scales
The SWC scale has ten items with four response options scored 1 to 4; total scores are sums of item scores with a range from 10 to 40, 40 representing highest satisfaction. The SM scale has six response options (0 to 5); nine items are summed to calculate a total score ranging from 0 to 45 (best symptom management). Eight items reflect symptoms or other negative conditions; one item is a positive condition (“calm”). The CAD scale has three response options (scored 1 to 3) with 14 items; summed total scores range from 14 to 42. The CAD comprises four subscales with a varying number and some overlapping items: Physical Distress, Dying Symptoms, Emotional Distress, and Well Being. For all scales, coding was reversed when applicable. A category “not applicable” was included for the SWC only in both studies. In both studies, evaluations reflected status over the last three months of life (SWC and SM) or during dying (CAD).
Psychometric properties were adequate in an independent U.S. population where nurses scored the SM and CAD in a cross-sectional sample of residents with advanced dementia (Engel et al., Reference Engel, Kiely and Mitchell2006; Kiely et al., Reference Kiely, Volicer, Teno, Jones, Prigerson and Mitchell2006). Distributions were normal and Cronbach's α varied between 0.68 and 0.83.
Analyses
To compare demographics between countries χ2 statistics were calculated. Item and total scores were compared between countries with independent sample t-tests and items were also tested with the non-parametrical Mann-Whitney U-test. A significance level of 0.01 was adopted to account for multiple comparisons for all comparisons of means between the two studies.
Additionally, linear regression with EOLD total and subscale scores as the dependent and the country as the independent was performed with adjustment for demographics and dementia severity. Adjustment for relationship with the resident was performed with dummy variables for “spouse of the resident;” we additionally tested “child of the resident” entered in separate models to avoid colinearity, but results were similar. Unstandardized beta coefficients and 95% confidence intervals were calculated for the country variable, representing adjusted differences in scale scores between the Netherlands and the U.S.A.
We further explored associations between EOLD total scores and demographics (gender of resident and respondent, resident age, respondent being a spouse, child, or daughter) and dementia severity, adjusted for nationality, and – available in the Dutch dataset only – whether the nursing home was the respondent's or resident's nursing home of preference. We report on associations that were at least marginally significant (p < 0.10) because of limited power for regression analyses.
Missing BANS-S items were imputed with subject means if two or fewer. Missing SWC and SM items were imputed with subject means if three or fewer, and for the CAD, four or fewer. Only in the U.S. study were >5% of items frequently missing. Previously published means were without imputation (Volicer et al., Reference Volicer, Hurley and Blasi2003) and therefore differ slightly from means presented in this paper. The largest difference was for the CAD; the published CAD mean was 31.0 (standard deviation (SD), 6.2) for 44 observations (n = 54 to 63 per item) versus 30.5, SD 5.9 for 53 observations after imputation.
Results
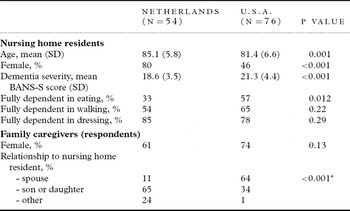
The Dutch nursing home residents in the study were more frequently female, and, on average, older than the U.S. residents (Table 1). Nevertheless, on average they had less severe dementia, and were less frequently fully dependent with eating. Respondents in the U.S. sample were more frequently spouses.
Characteristics of Dutch and U.S. nursing home residents and family caregivers

* Spouse versus all others (son or daughter and other).
SD = Standard Deviation; BANS-S = Bedford Alzheimer Nursing Severity-Scale (range 7–28).
Satisfaction With Care
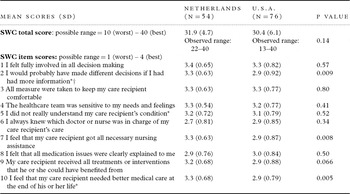
Satisfaction With Care (SWC) scale total scores were not significantly different between the Dutch and U.S. studies (p = 0.14). Table 2 shows mean total scores of 31.9, SD 4.7 versus 30.4, SD 6.1 respectively, from which follows a beta coefficient (SWC score mean difference) for the Netherlands versus the U.S.A. of +1.5 (CI −0.47–3.4). Adjusted for dementia severity, gender of resident and respondent, resident's age, and respondent being a spouse, the coefficient for the Netherlands as a country was somewhat larger but still not significant for the SWC scale (+1.9, CI −0.62–4.4).
Satisfaction With Care (SWC) scores over residents' last 3 months of life

*Recoded so that higher score means better satisfaction.
†Missing item values were max. 7% for Dutch data (n = 50–54 Dutch) and max. 4% for U.S. data (n = 73–76) except for this item, which had the highest percentage of missing values in both studies: 20% (11/54) rated not applicable for Dutch residents, and for U.S. residents, four were rated not applicable and additionally two were missing, totaling 8%.
There were no missing total scores (imputed with subject means for or a maximum of three items missing).
Note: Cronbach's α was 0.91 for U.S. data and 0.87 for Dutch data. SD = standard deviation.
However, scores of three of the ten items were significantly different (p < 0.01), with higher ratings for Dutch than for U.S. residents. (We report parametrical item test results because non-parametrical results hardly differed.) These items included generally worded items on nursing assistance (item 7) and on medical care (10). The last item (2) referred to a lack of information and regret of decisions taken. This item was, however, frequently rated “not applicable,” especially by Dutch families (20% versus 8% in U.S. families). One of the most specific items, on knowing the health care provider in charge (6) was rated lowest in both countries.
Symptom Management
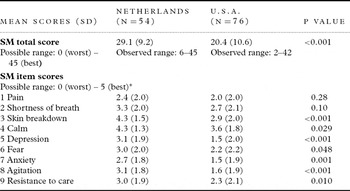
Symptom Management (SM; Table 3) total scores were significantly higher for Dutch residents than for U.S. residents (29.1, SD 9.2 versus 20.4, SD 10.6; beta + 8.7; CI 5.0–12.5), as were four of nine item scores (skin breakdown, depression, anxiety, and agitation). After adjustment, the mean difference between Dutch and U.S. SM scores remained the same (beta + 8.7; CI 4.0–13.5).
Symptom Management (SM) scores over the residents' last 3 months of life

* All items, except for “calm” were recoded so that a higher score implies better symptom management.
Missing values varied between 2% and 7% (n = 50–53) for Dutch residents and varied between 11% and 24% (n = 58–68) for U.S. residents.
Total scores (imputed with subject means for or a maximum of two items missing) refer to 52 Dutch cases (4% missing) and 62 U.S. cases (18% missing).
Note: Cronbach's α = 0.76 for US data and 0.72 for Dutch data.
Comfort Assessment in Dying
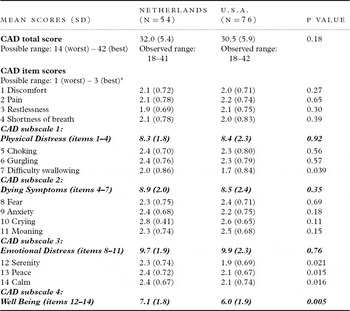
Comfort Assessment in Dying (CAD; Table 4) total scores showed no differences (32.0, SD 5.4 versus 30.5, SD 5.9; beta for the Netherlands versus the US +1.5, CI -0.69–3.7), and nor did the scores of any of the 14 items. The lack of difference in total CAD scores remained after adjustment (beta +1.0; CI –1.8–3.9).
Comfort assessment in dying (CAD) in nursing home residents

* All items, except for “serenity,” “peace,” and “calm” were recoded so that a higher score means better symptom management.
Missing values were a max. of 6% (n = 51–54) for Dutch residents and varied between 17% and 29% (n = 54–63) for U.S. residents. Total scores (imputed with subject means for a maximum of four items missing) refer to 53 Dutch cases (2% missing) and 53 U.S. cases (30% missing).
Note: Cronbach's α = 0.87 for U.S. residents and 0.80 for Dutch residents.
However, the CAD “well Being” subscale was rated more favorably for Dutch residents (7.1, SD 1.8 versus 6.0, SD 1.9; beta +1.1, CI 0.32–1.8; adjusted beta +1.3, CI 0.26–2.2).
Associations with EOLD scores
The SWC total score, adjusted for country, was most strongly associated with dementia severity. Family caregivers of residents with more severe dementia tended to be more satisfied with care (beta +0.22 per BANS-S 1-point increment, CI −0.02–0.46; p = 0.08). Nursing home of preference was significantly associated with satisfaction in the Dutch dataset. The mean SWC for home of preference was 3.3 points higher (33.0 versus 29.7; beta +3.3; CI 0.78–5.8).
The SM total score held the strongest association with the respondent being a spouse (adjusted for country). Spouses tended to provide higher ratings (beta +3.8, CI −0.61–8.1, p = 0.09) than other respondents. None of the examined variables was associated with total CAD scores.
Discussion
Our results show a consistent pattern of small differences between ratings of the EOLD scales in the U.S. study and the Dutch study. Although we did not find very large differences between the ratings of Dutch and U.S. families, any significant difference we found either in total scores, subscale scores or items scores was consistently more favorable for end of life in the Dutch study. This was more obvious for the SM and CAD scales than for the SWC scale. This suggests that at least the SM and CAD scales of the EOLD scales may be sensitive to differences between countries or, alternatively (or in addition), to differences in time frames given the difference of about seven years between the two studies. Nevertheless, the pattern of consistent differences suggests that the EOLD SM and CAD scales are valid scales to use in assessing differences in quality of dying.
Further, exploring associations of total scores with other variables, we found that proxy respondents of residents with more severe dementia tended to provide higher SWC scores, and that respondents where the resident died in the nursing home of preference were more satisfied. Spouses tended to provide higher SM scores than other respondents.
Symptoms and comfort
Dutch residents suffered from fewer symptoms in the last months of life and had higher levels of well-being when dying according to the family caregivers. Our finding of different quality of dying raises the question of whether there were any differences between the quality of care provided. This may refer to differences in care between the two countries. It is also possible that our results represent some cohort (time) effect if treatments to relieve symptoms are increasingly provided in the U.S.A. as they have been in the Netherlands between 1996–1998 and 2006–2007 (van der Steen et al., Reference van der Steen, Gijsberts, Knol, Deliens and Muller2009). More recently published U.S. data of SM and CAD mean total scores, from an ongoing prospective study on care for residents with advanced dementia (CASCADE; Boston area), were higher indeed (SM: 36.4, SD 7.8 and CAD: 33.6, SD 5.0) (Kiely et al., Reference Kiely, Volicer, Teno, Jones, Prigerson and Mitchell2006). However, they are not comparable because the SM scores did not refer to end of life while CAD scores referred to the last week of life which may be more inclusive than the dying phase per se. Further, data were obtained from nurses by face-to-face interview, potentially introducing bias in favor of better symptom management, although in our Dutch data, we did not find evidence of such phenomenon. Further exploration of the Dutch data did not reveal any time trends between 2005 and 2007. We conclude that the observed consistent patterns cannot be linked with certainty to either differences between countries or improvements of care over time, but the EOLD consistently captured these differences, as it captured differences between settings within the U.S.A. (Volicer et al., Reference Volicer, Hurley and Blasi2003).
Satisfaction with care
Interpreting satisfaction with care results may present difficulties that are inherent to instruments that measure satisfaction with care. Significant differences between the Netherlands and the U.S.A. were found only in two generally-worded items on nursing care and medical care, and in an item on decision-making that suggested that the respondent made decisions on her/his own. This item was frequently rated as “not applicable” and may not apply well to a shared decision-making model employed in the Netherlands (Helton et al., Reference Helton, van der Steen, Daaleman, Gamble and Ribbe2006). Reported mean SWC scores in CASCADE were not obtained during the last three months of life, but were nevertheless very similar to those we found in our study (31.9, SD 4.7 in the Netherlands, and 30.4, SD 6.1 in the U.S.A): 31.0, SD 4.2 (Engel et al., Reference Engel, Kiely and Mitchell2006) and 30.9, SD 4.1 in a broader sample (Kiely et al., Reference Kiely, Volicer, Teno, Jones, Prigerson and Mitchell2006).
Measures of satisfaction with care have been criticized for not being very sensitive due to the dependency on respondents' expectations and other unmeasured factors (Williams, Reference Williams1994). It is possible that total mean scores are not suitable for comparison between countries because respondents' expectations of care may vary according to the standards of care, implying circularity and regression to the mean within each country. In fact, dying in the preferred home contains a substantial expectation component, and the possibility of dying in the place of preference may vary according to country-specific policies. Anecdotal evidence in our ongoing study (van der Steen et al., Reference van der Steen, Ribbe, Deliens, Koopmans and Onwuteaka-Philipsen2007a; Reference van der Steen2008b) and in various other studies (Turris, Reference Turris2005) suggests that respondents are hesitant to be critical, tending to express understanding for hard working nurses. Lubart et al. (Reference Lubart2004) found that three-quarters of Israeli representatives of residents with dementia rated satisfaction with care as a 5 on a 1–5 scale. They suggested that guilt over leaving the care to others or reluctance to be involved in care and admiring the efforts of staff in dealing with difficult behaviors might also explain high satisfaction with care scores. This may also explain our finding of a tendency to be more satisfied with care for more severely demented dying residents. Although we found no ceiling effect with the EOLD-SWC scores, cross-country samples present a complex mix of expectations and feelings that may well result in a tendency to produce relatively stable and high mean overall SWC scores in spite of differences in care between countries.
Associations
In using the EOLD scales across different settings and different case mixes, it is preferable that the outcome is not overly dependent on respondents' and residents' characteristics or, alternatively, that one can adjust for known correlates, especially if the outcome measures are in fact used as indicators of quality of care. Our study suggests that nursing home of preference, severe dementia and rating by a spouse all influence EOLD scores. Several studies have examined associations of representatives' satisfaction with care scores. In a recent U.S. study, male respondents tended to be more satisfied with communications with professional caregivers, although differences were not significant (Biola et al., Reference Biola, Sloane, Williams, Daaleman, Williams and Zimmerman2007). Further, daughters tended to be more critical. In our study we did not find such an association with SWC scores, although there was a non-significant (p = 0.14) tendency for daughters to give lower SM ratings (−2.9, CI –6.9–0.99).
Study limitations
Our study is limited by the U.S. data being older, and by the small sample sizes, which limits the power to detect differences between studies. Further, family perspectives present an important, but just a single view. For example, Berlowitz et al. (Reference Berlowitz, Du, Kazis and Lewis1995) examined the correspondence between the rating of quality of life domains by nursing home residents' self-reports and nurses' and physicians' ratings and found that physical function and in general, more directly observable symptoms corresponded best with resident self-report. However, it was found that mean scores between families and nurses did not differ much, in spite of poor to moderate agreement of family individual CAD and SM scores with nurses scores (Rich et al., Reference Rich, Williams and Zimmerman2007).
The Dutch study was not nationally representative, and 37% of cases were enrolled in “anthroposophic” Dutch nursing homes deploying a specific philosophy of life. These homes had higher SM and CAD scores than the traditional homes in the study. Although this may have resulted in an overestimation of cross-national differences, any item which Dutch families rated significantly more favorably than U.S. families was consistently scored higher (in absolute values) in Dutch traditional homes compared with U.S. nursing homes.
Reconciling different study designs is crucial for any cross-national pooling of data (van der Steen et al., Reference van der Steen2008a). The U.S. and Dutch studies in our comparison both employed a mortality follow-back design with written surveys for families and equal time-windows, although there was variability in time of assessment after death (two months versus “within a year”). Few studies have examined effects of timing of questionnaires after death on proxies' recollection (McPherson and Addington-Hall, Reference McPherson and Addington-Hall2003). Casarett et al. (Reference Casarett, Crowley and Hirschman2003) showed that responses to satisfaction surveys undertaken at two weeks and six weeks post-death were identical.
Conclusions and implications for further study
The EOLD scales may be used to compare end of life of nursing home residents with dementia across different nations, if confirmed in other studies. This refers to the SM and CAD scales; further work is needed to determine if and how the SWC scale or specific items can complement this. We further recommend the use not only of overall means but also of item scores and the need to adjust for potential confounders.
Ongoing work will determine how the EOLD scales are related to other end-of-life scales that are being applied to nursing home residents with dementia and how these measures relate conceptually to quality of care and quality or experience of dying. Our findings can inform future comparisons between ongoing and new prospective studies such as those performed in the U.S.A., the Netherlands, Israel, and Belgium (van der Steen et al., Reference van der Steen, Ribbe, Deliens, Koopmans and Onwuteaka-Philipsen2007a; Reference van der Steen2008b), employing similar designs and time frames. Combined studies will allow researchers to examine system-level factors affecting end of life as in a “natural experiment,” and, by comparing outcomes directly, to identify opportunities for improving care (Higginson, Reference Higginson2005; van der Steen et al., Reference van der Steen2008a). This will ultimately inform intervention studies in each setting, where the EOLD scales may be used as an outcome.
Conflict of interest
None.
Description of authors' roles
The study was conceived and designed by J. T. van der Steen, M-J Gijsberts, M. T. Muller and L. Volicer. The data were collected by M-J Gijsberts and L. Volicer; analyzed by J. T. van der Steen; and interpreted by J. T. van der Steen, M-J Gijsberts, M. T. Muller, L. Deliens and L. Volicer. Early drafts of the paper were written by J. T. van der Steen; all the authors provided critical and important intellectual content during the revision stage and all approved the final paper.
Acknowledgments
This study was supported by the VU University Medical Center, EMGO Institute, Departments of Nursing Home Medicine and Department of Public and Occupational Health, Amsterdam, the Netherlands, and by a career award for JTS of the Netherlands Organisation for Scientific Research (NWO, The Hague; Veni 916.66.073).