Introduction
Lymphatic filariasis (LF) is the second leading cause of long-term disability all over the world predominantly in tropical and subtropical countries (Perera et al., Reference Perera, Whitehead, Molyneux, Weerasooriya and Gunatilleke2007). This parasitic disease threatens about 1.10 billion people in 55 countries worldwide (WHO, 2016). Round worms such as Wuchereria bancrofti, Brugia malayi and B. timori are the causative agents of LF and infected mosquitoes are the carrier of these nematodes (Dreyer et al., Reference Dreyer, Noroes, Fiqueredo-Silva and Piessens2000). W. bancrofti infection is highly prevalent among them. This chronic disease causes moderate to severe lymphatic damage and swelling of the affected extremities. These lead to permanent and long-term disability in the form of elephantiasis, lymphedema, lymphangitis or hydrocoele (Perera et al., Reference Perera, Whitehead, Molyneux, Weerasooriya and Gunatilleke2007). This parasitic disease mainly affects poor people and has been considered as one of the neglected tropical diseases among six. The current drugs (albendazole, ivermectin, diethylcarbamazine citrate, and doxycycline) available in the market possess several limitations with insignificant macrofilaricidal effect. Emergence of drug resistance and adverse side effect to human insisted the researchers to develop new potential antifilarial agents (Dhananjeyan et al., Reference Dhananjeyan, Milev, Kron and Nair2005; James et al., Reference James, Hudson and Davey2009; Gucchait et al., Reference Gucchait, Joardar, Parida, Roy, Mukherjee, Dutta, Yesuvadian, Sinha Babu, Jana and Misra2018; Mukherjee et al., Reference Mukherjee, Joardar and Sinha Babu2018a; Reference Mukherjee, Joardar, Mondal, Schiefer, Hoerauf, Pfarr and Sinha Babu2018b; Ray et al., Reference Ray, Joardar, Mukherjee, Rahaman and Sinha Babu2018).
Setaria cervi is a filarial parasite which resides in the peritoneal cavity of cattle and is similar with human filariid W. bancrofti in their antigenic variation and nocturnal periodicity along with its easy availability established this parasitic nematode as a suitable model organism in the field of drug development (Saha et al., Reference Saha, Roy, Saini, Mondal, Chowdhury and Sinha Babu2016; Gucchait et al., Reference Gucchait, Joardar, Parida, Roy, Mukherjee, Dutta, Yesuvadian, Sinha Babu, Jana and Misra2018; Joardar et al., Reference Joardar, Mukherjee and Sinha Babu2018; Mukherjee et al., Reference Mukherjee, Joardar and Sinha Babu2018a, Reference Mukherjee, Joardar, Mondal, Schiefer, Hoerauf, Pfarr and Sinha Babu2018b; Ray et al., Reference Ray, Joardar, Mukherjee, Rahaman and Sinha Babu2018). Previously a number of heterocyclic compounds like dihydropyrimidines, triazines, benzimidazoles, and chalcone derivatives had shown their experimental effectiveness on filarial species (Srivastava et al., Reference Srivastava, Chauhan, Bhaduri, Murthy and Chatterjee2000; Singh et al., Reference Singh, Mishra, Saxena, Yadav, Maulik, Sahoo, Gaur, Murthy and Tripathi2008; Sashidhara et al., Reference Sashidhara, Rao, Kushwaha, Modukuri, Verma and Murthy2014). In our previous study (Roy et al., Reference Roy, Dhara, Parida, Kar, Bhunia, Jana, Sinha Babu and Misra2016), the micro-filaricidal activity of C-cinnamoyl glycosides (CCGs) against both the human and bovine filarial parasites was reported. However, the present study was designed to evaluate the macro-filaricidal potential of CCGs and also to investigate the roles of oxidative stress, apoptosis, autophagy, and their interplay in mediating the antifilarial efficacy. Intriguingly, the present experimental findings demonstrated that apoptosis and autophagy triggered by CCG play a considerable role in mediating filaricidal activity. Thus CCG may be predicted as a useful and novel chemical moiety for designing an effective antifilarial compound or may be a future treatment choice after detail in vivo study and proper clinical trials.
Materials and methods
Materials
Foetal bovine serum (FBS), 4-(2-hydroxyethyl)-1 piperazineethanesulfonic acid (HEPES) buffer, Streptomycin, Penicillin, Amphotericin-B, Hoechst 33258, Krebs-Ringer bicarbonate buffer, TRI Reagent, N-acetyl-L-cysteine (NAC), 2′,7′-dichlorofluorescein diacetate (H2DCFDA), JC-1, Monodancylcadeverine (MDC) and Apoptosis Detection Kit (Annexin V-Cy3) were purchased from Sigma-Aldrich Co. (St. Louis, MO, USA). Caspase Assay System was purchased from Promega, USA. Dimethyl sulfoxide (DMSO) and Tris-saturated phenol were purchased from Merck (Mumbai, India). RPMI-1640, Ivermectin (IVM) (Sigma-Aldrich, USA), MTT [3-(4,5-dimethyl-thiazol-2-yl)-2,5-diphenyl-tetrazolium bromide], 5,5′-dithiobis (2-nitrobenzoate) (DTNB), 1-chloro-2,4-dinitrobenzene (CDNB), Glutathione (GSH) and EDTA were purchased from Hi-Media Laboratories (Mumbai, India). Proteinase-K, DNase free RNase and DNA ladder were purchased from Fermentas (USA). Pre-stain protein ladder and protease inhibitor cocktail were purchased from Thermo Fisher Scientific (Waltham, MA, USA). Protein A/G agarose beads were purchased from Santa Cruz (sc-2003, Santa Cruz). The 60 mm culture plates and 24 well microtiter plates were purchased for parasite culture from Tarsons (India). Lysis buffer (Tris-HCl 20 mm, EDTA 50 mm, SDS 0.5%, NaCl 100 mm, β mercaptoethanol 1%, v/v, pH 8.0), phosphate buffer saline (PBS), Tris-EDTA (TE) buffer were prepared in our laboratory.
Instrumentation
Microtiter plate reader (Beckman, USA), Inverted fluorescence microscope (Dewinter, victory, Italy), Light microscope (Dewinter Biowizard 4.2, Italy), Gel documentation system (Bio-Rad, USA), Fluorescence spectrometer (Jasco, FP-6500, Germany), Flow cytometer (BD Accuri™ C6).
Synthesis of C-cinnamoyl glycosides (CCGs)
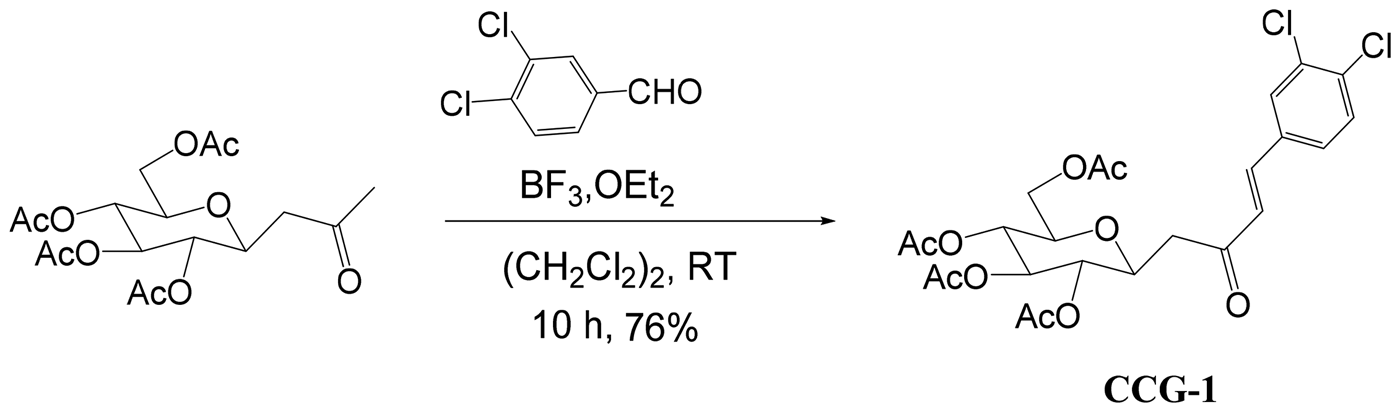
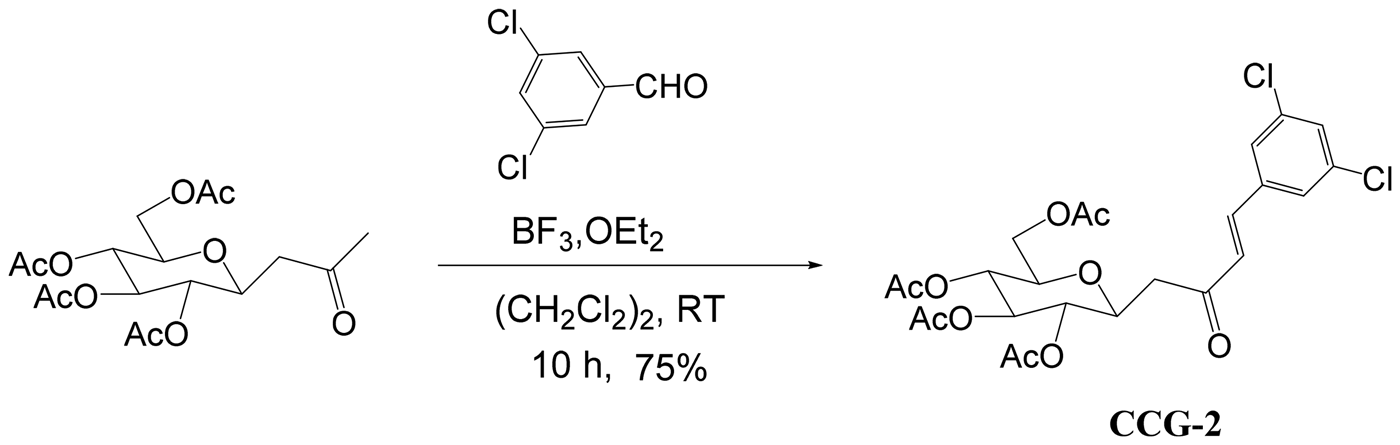
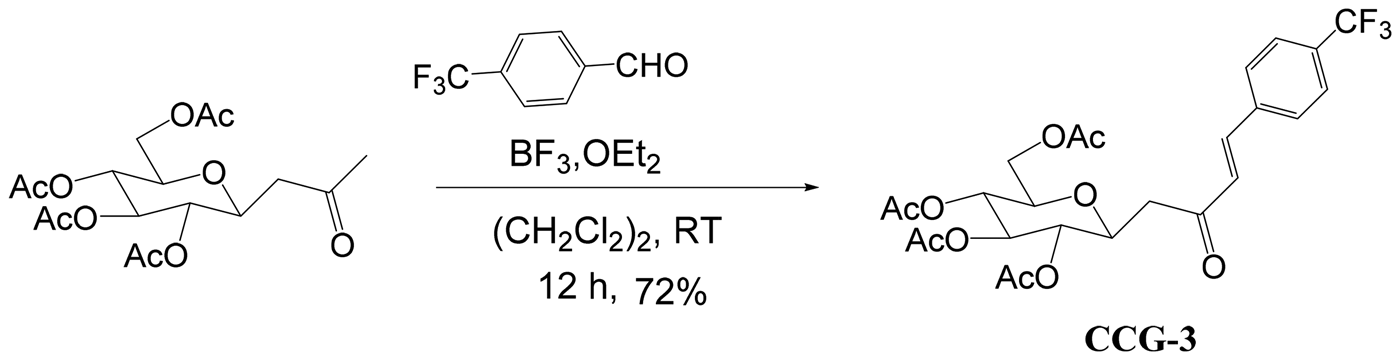
C-cinnamoyl glycosides were synthesized by the aldol reaction of various aldehydes with per-O-acetylated-b-D-glucopyranosylpropan-2-one in the presence of BF3, OEt2 in 1,2-dichloroethane. Per-O-acetylated-b-D-glucopyranosyl-propan-2-one was obtained from the condensation reaction of free D-glucose with ethyl acetoacetate in the presence of sodium bicarbonate in water (Rodrigues et al., Reference Rodrigues, Canac and Lubineau2000; Roy et al., Reference Roy, Dhara, Parida, Kar, Bhunia, Jana, Sinha Babu and Misra2016) (Schemes 1–3).
Thereaction between per-O-acetylated-b-D-glucopyranosyl-propan-2-one (1) and 3,4-dichlorophenyl aldehyde in presence of 1.0 equiv. of BF3.OEt2 in 1,2-dichloroethane furnished C-cinnamoyl glycoside (CCG-1) after 10 h (Roy et al., Reference Roy, Dhara, Parida, Kar, Bhunia, Jana, Sinha Babu and Misra2016).

The reaction between per-O-acetylated-b-D-glucopyranosyl-propan-2-one (1) and 3,5-dichlorophenyl aldehyde in the presence of 1.0 equiv. of BF3.OEt2 in 1,2-dichloroethane furnished C-cinnamoyl glycoside (CCG-2) after 10 h (Roy et al., Reference Roy, Dhara, Parida, Kar, Bhunia, Jana, Sinha Babu and Misra2016).

The reaction between per-O-acetylated-b-D-glucopyranosyl-propan-2-one (1) and 4-trifluoromethyl phenyl aldehyde in the presence of 1.0 equiv. of BF3.OEt2 in 1,2-dichloroethane furnished C-cinnamoyl glycoside (CCG-3) after 12 h (Roy et al., Reference Roy, Dhara, Parida, Kar, Bhunia, Jana, Sinha Babu and Misra2016).

Collection of parasites
Motile adult female worms of S. cervi of average length (6 ± 2.0 cm) and weight (35.0 ± 5.0 mg) were obtained from the peritoneal cavity of freshly slaughtered infected cattle (Bovis indica Linn.) and are carried to the laboratory in normal saline (0.85%) water. The parasites were cleaned several times with normal saline and were kept in RPMI-1640 media at 37 °C until further use. The oocytes and microfilariae (Mf) were isolated by dissecting the gravid females and were maintained in RPMI-1640 media at 37 °C in 5% CO2 atmosphere.
In vitro culture and treatment with CCGs
Adult parasites (two females, or one male and one female) were incubated in 5 mL of complete culture medium (RPMI-1640 supplemented with streptomycin (100 U mL−1), penicillin (100 µg mL−1), amphotericin B (0.25 µg mL−1) and fetal bovine serum (10%, V/V)), alone and in combination with varying concentrations of CCGs (25–200 µg mL−1) (Nayak et al., Reference Nayak, Gayen, Saini, Mukherjee and Sinha Babu2012). The cultures were continued for 24 h and repeated five times. Approximately, a minimum of ~1.0 × 10⁵ Mf and oocytes were dissected out from the treated gravid females and subsequently used for monodancylcadeverine (MDC) staining. ~1.0 × 10⁴ oocytes were dissected out from the adult female parasites and incubated with CCG for flow cytometric analyses. Ivermectin (IVM) was used as positive control in equivalence to the CCG doses.
MTT assay
The macro-filaricidal activity of CCGs was evaluated by MTT reduction assay and LC50 values of CCGs against adult bovine filariid were calculated following the reported method (Roy et al., Reference Roy, Dhara, Parida, Kar, Bhunia, Jana, Sinha Babu and Misra2016). The experiment was conducted in quadruplicate and repeated for at least five times. The obtained result was represented as mean ± s.e.m. (standard error of the mean).
Relative motility of the treated parasites
Worm motility was assessed visually for 24 h at 4 h interval by microscopy. Survivability was based on the motility of worms according to a Movability Index scoring method by Mukherjee et al. (Reference Mukherjee, Mukherjee, Saini, Roy and Sinha Babu2014). Movability Index (MI) were then assessed as highly active, moderately active, slightly active, immobile but responding to stimuli, and no response or dead with a score of 4, 3, 2, 1, and 0 respectively. This experiment was done in duplicate and repeated thrice. The macrofilaricidal activity of CCG was described as relative movability (RM) with both MI and RM values were calculated using the equations given below.
 $$ {\rm Motility}\;{\rm Index}\,({\rm MI}) = \displaystyle{{\mathop \sum \nolimits_{i = 0}^4 \left( {iN_i} \right)} \over {\mathop \sum \nolimits^ N}}. $$
where, i = index of motility score (0, 1, 2, 3 or 4); N i = number of parasites with the score i; PN = total parasite number for a particular observation.
 $$ {\rm Relative}\;{\rm Motility}\left( {{\rm RM}} \right) = \displaystyle{{{\rm MI}\;{\rm sample}} \over {{\rm MI}\;{\rm control}}}{\rm \times 100} $$
where, RM value of 100 = no filaricidal activity, RM value of 0 = strongest filaricidal activity. Ivermectin was used as a standard antifilarial drug for in vitro tests.
Hoechst staining
Thin sections of CCG treated (at LC90 dose) adult parasite were processed for Hoechst staining according to the method of Saini et al. (Reference Saini, Saha, Roy, Chowdhury and Sinha Babu2016) to analyze the texture of nuclear morphology.
DNA fragmentation assay
Total genomic DNA was isolated from control and CCG and IVM treated (at doses of LC50 and LC90 for 24 h) adult parasites by the standard phenol-chloroform isolation method to analyze the status of DNA as described previously (Nayak et al., Reference Nayak, Gayen, Saini, Maitra and Sinha Babu2011). The isolated DNA samples were run on 2% agarose gel electrophoresis and visualized after staining with ethidium bromide (EtBr) under gel documentation system.
In situ terminal deoxynucleotidyl transferase dUTP nick end labeling (TUNEL) assay
TUNEL assay was done to detect in situ DNA fragmentation in CCG treated parasite section following manufacturer protocol (DeadEnd™ ColorimetricTUNEL System, Promega).
H2DCFDA assay
H2DCFDA assay was carried out to quantify the level of intracellular ROS production in control and treated parasites by using a fluorescence dye H2DCFDA following the previously reported method (Saha et al., Reference Saha, Roy, Saini, Mondal, Chowdhury and Sinha Babu2016).
Estimation of reduced glutathione (GSH) level
The level of reduced glutathione (GSH) in control and treated parasites was measured following the reported method (Saini et al., Reference Saini, Saha, Roy, Chowdhury and Sinha Babu2016).
Estimation of glutathione S-transferase (GST) activity
We assessed GST activity of fresh worm extracts of control and treated parasites spectrophotometrically according to the method reported elsewhere (Saini et al., Reference Saini, Saha, Roy, Chowdhury and Sinha Babu2016).
Thiobarbituric acid reactive substances (TBARS) assay
The level of malondialdehyde (MDA) in control and treated (at doses of 1/2LC50 and LC50 for 24 h) worms was quantified by TBARS assay according to the previously reported method (Yoshida et al., Reference Yoshida, Umeno and Shichiri2013; Roy et al., Reference Roy, Saha, Gayen, Chowdhury and Sinha Babu2018).
Fluorometric analysis of JC1 staining
Mitochondrial membrane potential (ΔΨm) was determined by using a cationic mitochondrial vital dye JC-1 as reported earlier (Roy et al., Reference Roy, Saha, Gayen, Chowdhury and Sinha Babu2018). Following treatment with CCG adult parasites were incubated in 10 µ m JC-1 solution for 10 min at 37 °C and fluorescence at two different wavelengths (590 and 530 nm) was recorded by a fluorimeter. The relative ΔΨm values were calculated from the ratio of fluorescence intensity at 590 and 530 nm.
Assay of caspase 3 activity
Caspase activity in the adult worm homogenate was determined using the microplate-based Caspase Assay System (Promega, USA) following the manufacturer's guidelines. p-nitroaniline labeled DEVD peptide was used as a substrate while Z-VAD-FMK was used as an inhibitor (Mukherjee et al., Reference Mukherjee, Joardar, Mondal, Schiefer, Hoerauf, Pfarr and Sinha Babu2018b; Ray et al., Reference Ray, Joardar, Mukherjee, Rahaman and Sinha Babu2018).
Western blotting of apoptotic and autophagic proteins
The expression of apoptotic (EGL-1, CED-9, CED-4and CED-3) and autophagic (Beclin1, ATG5, ATG7, P62 and LC3) proteins was studied by exploring the technique western blotting using the worm homogenate of both control and treated parasites as described earlier (Nayak et al., Reference Nayak, Gayen, Saini, Mukherjee and Sinha Babu2012).
Monodancylcadeverine (MDC) staining
Monodancylcadeverine (MDC) is an auto-fluorescent dye that specifically marks autophagolysosome and helps to analyze the autophagic process (Munafo and Colombo, Reference Munafo and Colombo2001, Reference Munafo and Colombo2002; Cao et al., Reference Cao, Huang, Zhang, Lu, Donkor, Zhu, Qiu and Kang2018). Following treatment, Mf and oocytes of S. cervi were dissected out from the treated adult worm (at LC50 dose for 24 h) and were labeled with MDC by incubating with 0.05 mm MDC in RPMI at 37 °C for 10 min. After that, Mf and oocytes were washed with PBS and visualized under a fluorescence microscope equipped with a filter system (excitation filter 420 nm).
Flow cytometry analysis
Following incubation with CCG for 24 h oocytes of S cervi were stained with Annexin V and propidium iodide (PI) and flow cytometric analysis was done following the manufacturer's instruction (Apoptosis detection kit, Sigma).
Flow cytometric analysis of Cyto-ID autophagy detection reagent stained oocytes of S. cervi was done according to the manufacturer's instruction (Cyto-ID Autophagy Detection Kit, ENZ-51031-K200, Enzo Life Sciences). In brief, oocytes obtained from adult females were washed with PBS, stained with Cyto-ID for 30 min at 37 °C. After washed with 1× Assay Buffer, oocytes were suspended in 1× Assay Buffer and quantified by flow cytometer (Iwai-Kanai et al., Reference Iwai-Kanai, Yuan, Huang, Sayen, Perry-Garza, Kim and Gottlieb2008; Shvets et al., Reference Shvets, Fass and Elazar2008).
Co-immunoprecipitation assay
The parasitic protein lysate was precleared by incubating with protein A/G agarose beads. 2 µg of a primary antibody of the protein of interest was added into the precleared lysate and was incubated at 4 °C on rotating device for overnight. 10 µL of protein A/G agarose beads were mixed to the same and was incubated them on the rotating device for 3 h at room temperature. Pellet was collected by centrifugation at 3000 rpm for 30 s at 4 °C. The pellet was washed four times in PBS and each washing was followed by centrifugation. The supernatant was discarded after the final wash. Pellet was re-suspended in 2× electrophoresis sample buffer. Samples were boiled for 2–3 min before starting the electrophoresis and immunoblotting. 10% of the whole lysate was used as input and IgG was used as isotype control (Liang et al., Reference Liang, Cao, Wang, Zhang, Wang, Gao, Li, Yang, Zeng, Wei, Li, Li and Yang2017).
Studies on the in vitro toxicity of CCG on RAW 264.7 macrophages
For in vitro toxicity evaluation, ~1 × 10⁶ mouse macrophages (RAW 264.7, ATCC, USA) were cultured in six-well plates following Mukherjee et al. (Reference Mukherjee, Joardar, Mondal, Schiefer, Hoerauf, Pfarr and Sinha Babu2018b). RAW 264.7 cells were treated with the LC50 and LC90 doses calculated from the parasite after CCG treatment for 24 h. After incubation, cells were isolated by scraping and centrifuged to remove the spent medium. The cell pellet was washed twice with PBS and cell viability was determined by MTT assay (Mukherjee et al., Reference Mukherjee, Joardar, Mondal, Schiefer, Hoerauf, Pfarr and Sinha Babu2018b).
Statistical analysis
All experiments were conducted in triplicate and repeated for at least five times. The data were expressed as mean values ± s.e.m. (standard error of the mean) of the respective variable (n = 5). Alphabets on the error bars signify statistically significant (P < 0.05) changes of a particular variable in between different experimental groups. The results were analyzed by following one way ANOVA and post-hoc Duncan's multiple range test (DMRT) and a P value < 0.05 was considered as statistically significant. Densitometric analysis was done using ImageJ software and represented as arbitrary units.
Results
CCGs reduced the viability of filarial parasites
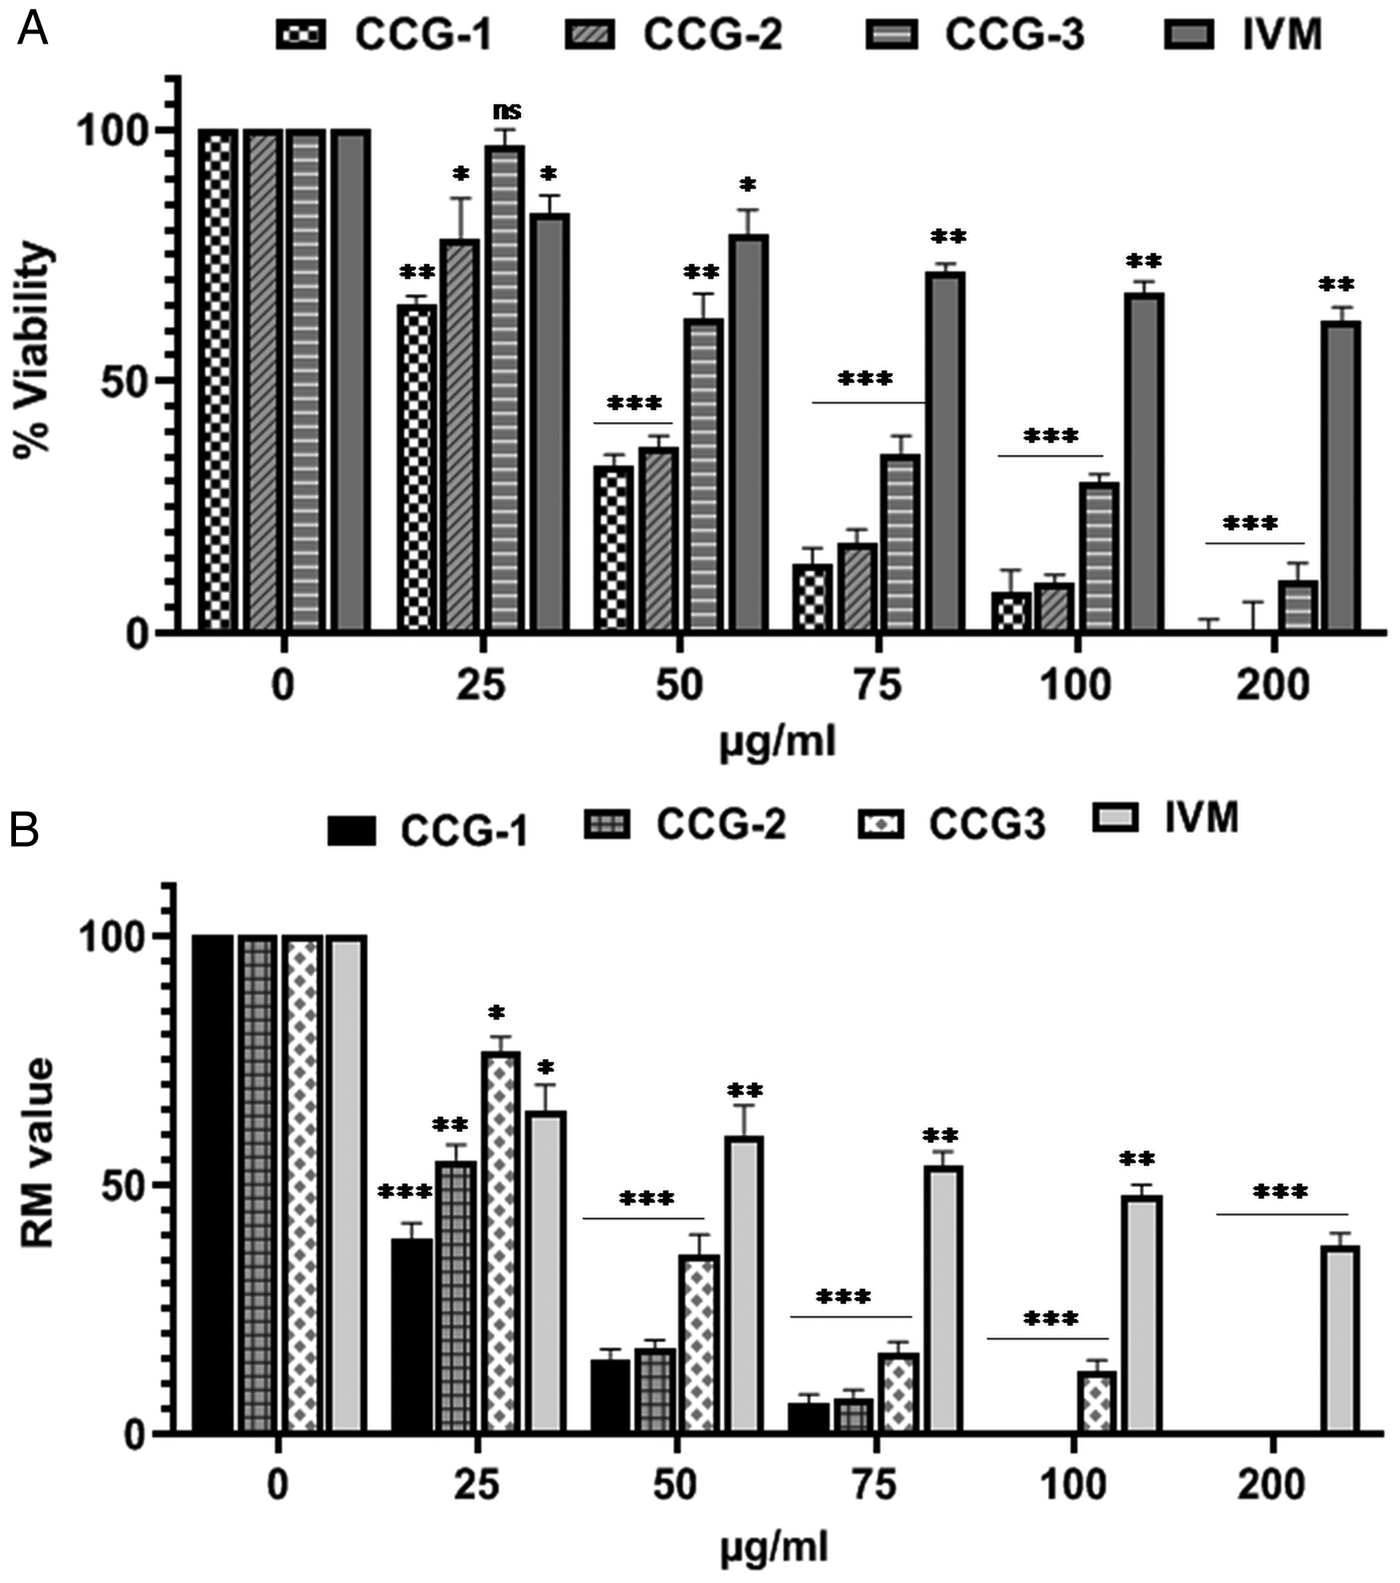
The macro-filarial activity of C-cinnamoyl glycosides (CCG-1, 2 and 3) against adult S. cervi was determined by MTT assay and summarized in Fig. 1A. Different doses of CCGs at 24 h interval exhibited a significant reduction in worm viability in a dose-dependent manner. After incubation with these compounds at a dose of 100 µg mL−1, the reduction in viability reached over 96.37, 96.15 and 71.27% respectively. The gradual increase in percent inhibition was observed with the gradual increase of dose. LC50 values were found to 37.7 ± 2.1, 41.6 ± 2.83, and 62.5 ± 4.5 µg mL−1 in case of CCG-1, CCG-2, and CCG-3, respectively. Thus CCG-1 produced best macro-filaricidal effects on bovine parasite S. cervi among these three and was chosen for the investigation of probable mode of action of CCGs.
(A) Toxic effects of CCG-1, CCG-2, and CCG-3 on the viability of the bovine filarial parasite S. cervi (adult) are presented in terms of percent inhibition after 24 h treatment at concentrations ranging from 25–200 µg mL−1. Ivermectin was used as a positive control. (B) Relative motility of the parasites after CCG treatment. All the data are representative of at least five individual experiments performed in triplicate manner. Two gravid females, or one male and one gravid female were used for each experiment. Data represented as mean ± s.e.m. *P < 0.05**, P < 0.01, ***P < 0.001, ns = not significant.

Result obtained from the relative motility assessment revealed that the compound CCG is efficacious in inhibiting the adult parasites after stipulated hours of treatment compared to the standard antifilarial drug Ivermectin. Although the available drugs have limited efficacy towards the microfilarial stage of the parasite, however, the adulticidal activity is not prominent. However, CCG has shown remarkable efficiency to kill adult filarial parasite (Fig. 1B).
Enhancement of apoptosis after CCG treatment
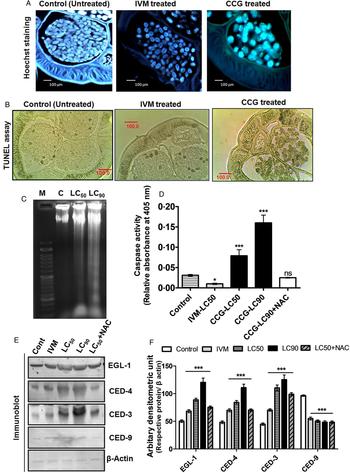
A unique feature of apoptotic signaling is the occurrence of chromatin condensation associated with DNA strand break (Saha et al., Reference Saha, Roy, Mondal, Roy, Gayen, Chowdhury and Sinha Babu2017). The resulting micrographs of Hoechst stained section of the treated worm displayed the presence of shrinkage in nuclear morphology, and condensation and breakage in chromatin compared to the control section (Fig. 2A).
(A) CCG induced DNA strand break is evident in Hoechst stained bovine worm. (B) Determination of TUNEL positive cells in the tissue sections of bovine worm after treatment with CCG. It shows a large number of apoptotic cells in treated parasite compare to control one. (C) A dose-dependent laddering of genomic DNA is found in agarose gel electrophoresis. (D) Caspase activity after CCG treatment. (E) Expression of CED-3, CED-4, and EGL-1 is increased and expression of CED-9 is decreased with the increase of dose as found in Western blot analysis (F) Densitometric analysis of the western blots, where the pro-apoptotic and the anti-apoptotic proteins have been up-regulated and down-regulated respectively in comparison to the control. Two gravid females, or one male and one gravid female worm were incubated for conducting each set of experiment. All the data are representative of at least five individual experiments performed in triplicate manner. Data represented as mean ± s.e.m. (*P < 0.05**, P < 0.01, ***P < 0.001, ns = not significant).

Interestingly, the 3′-OH ends are generated with the degradation of DNA. Therefore, evidence of a large number of 3′-OH end is the consequence of DNA fragmentation. Histological section of the treated (with LC90 dose) worm (Fig. 2B) displayed a large number of TUNEL positive nuclei (which were visualized as dark brown spots) compared to the control sections (Fig. 2B).
DNA laddering assay revealed that adult worms treated with higher concentrations (LC50 and LC90) of CCG showed a dose-dependent laddering of genomic DNA (Fig. 2C), a characteristic of apoptosis (Saini et al., Reference Saini, Saha, Roy, Chowdhury and Sinha Babu2016). The control worm exhibited intact genomic DNA with no such noticeable DNA damage. Thus this finding indicated the induction of DNA strand break upon CCG treatment which may be through activating caspase-activated DNase (CAD) or may be the result of oxidative stress. Furthermore, this result strengthens the occurrence of apoptosis in treated S. cervi.
Induction of apoptosis was again confirmed from the increasing trend of caspase activity in the treated worm homogenates (Fig. 2D). Moreover, the expression level of apoptotic proteins was studied after treating the bovine filarial parasite with CCG. The results of western blotting showed a marked increase in the level of pro-apoptotic proteins CED-3, CED-4, and EGL-1, and also the subsequent down-regulation of the anti-apoptotic protein CED-9 (Fig. 2E) levels after treatment.
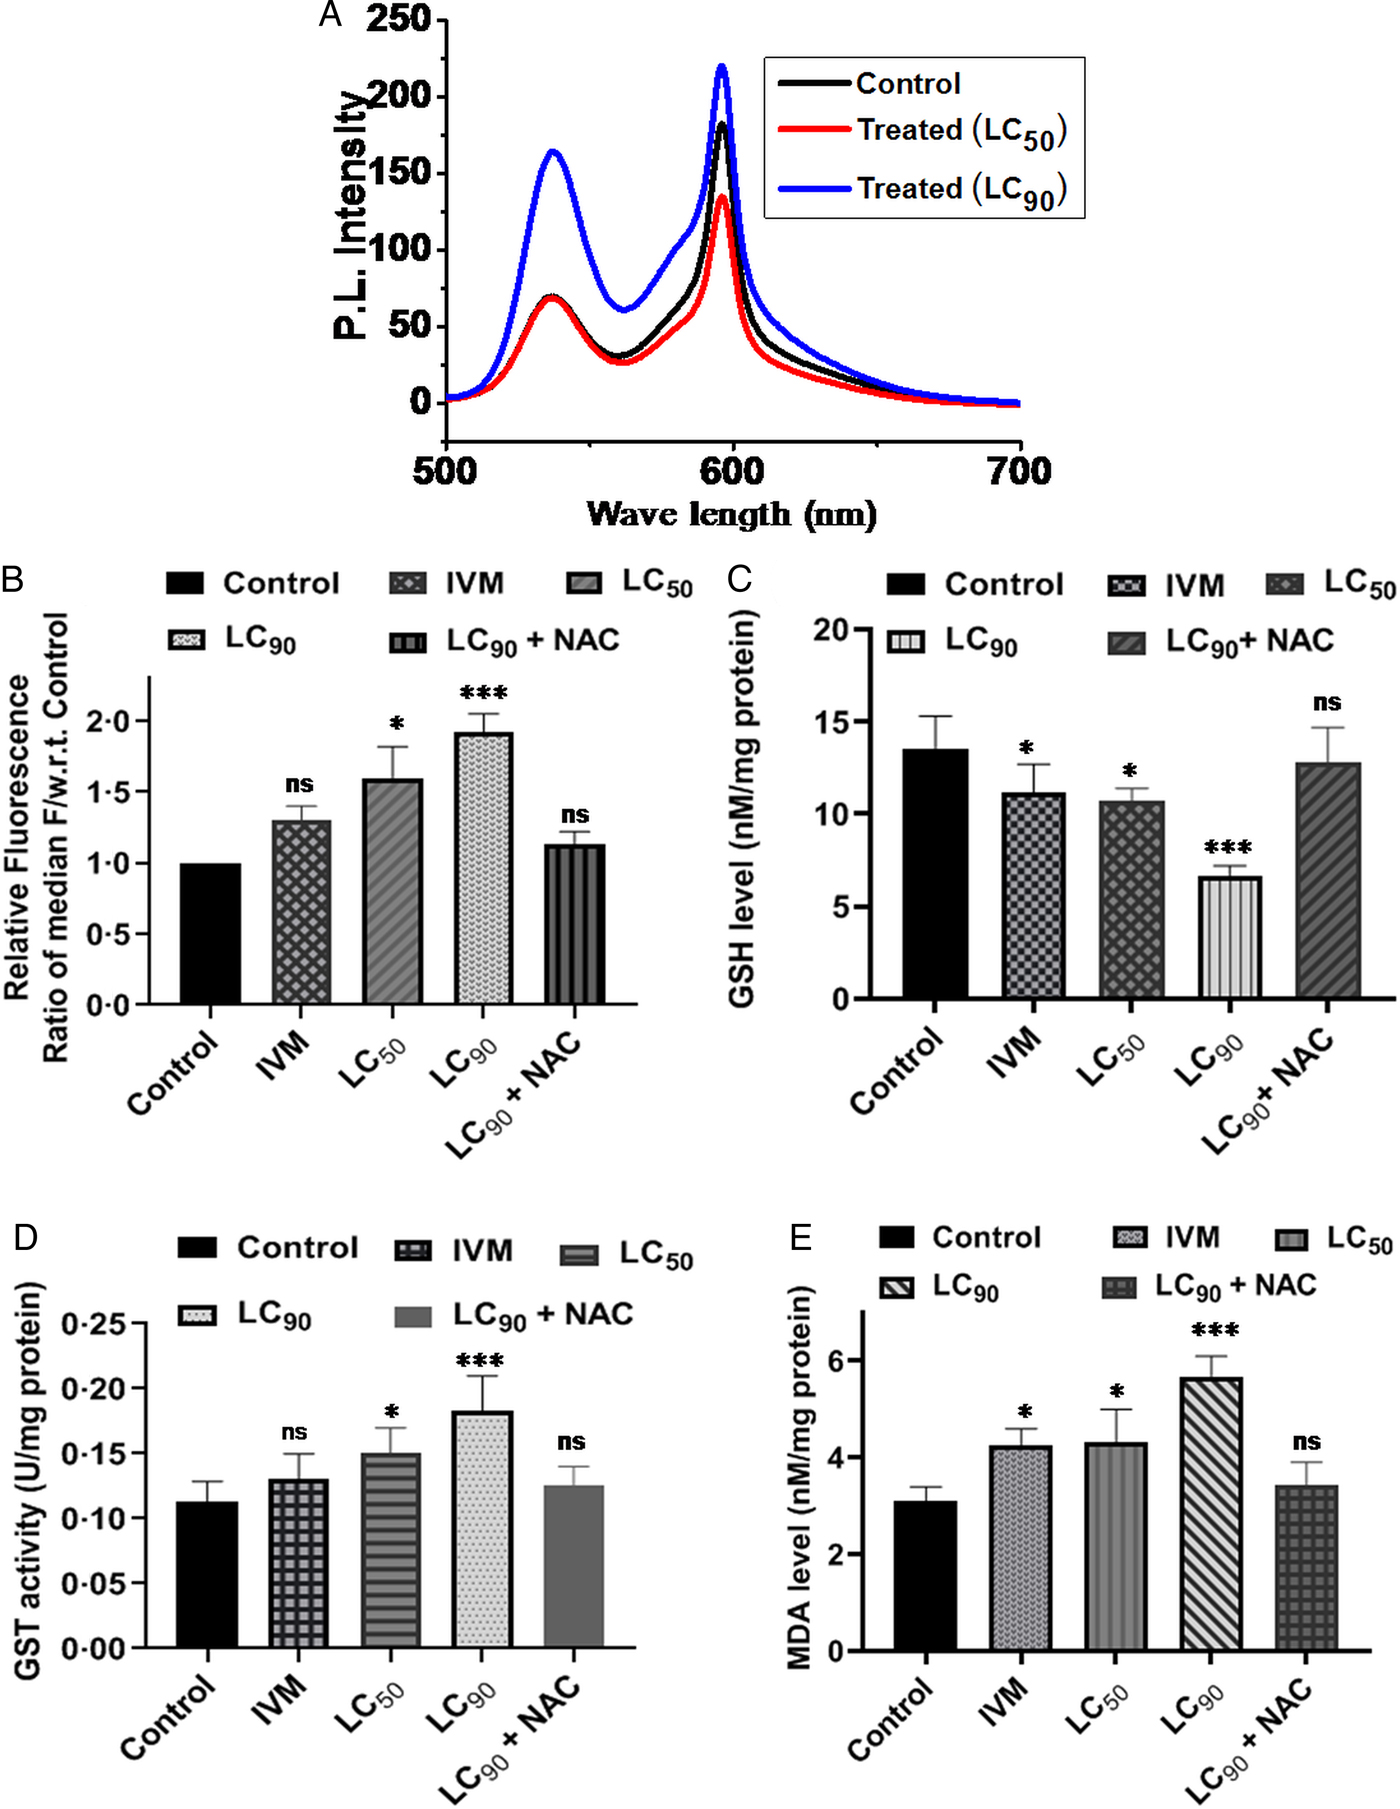
Changes in mitochondrial membrane potential after treatment with CCG were determined by JC-1 staining. Fluorometric analysis of JC-1 staining of control and CCG treated adult parasites (at doses of LC50 and LC90) was demonstrated in Fig. 3A. Control parasites emit pale green fluorescence (530 nm) along with a bright red signal (590 nm), whereas CCG treated parasites showed lighter red signal (590 nm) with a stronger green signal (530 nm) and the changes were found to be dose-dependent. The ratio of red and green fluorescence represents the relative energy state of mitochondria (Roy et al., Reference Roy, Saha, Gayen, Chowdhury and Sinha Babu2018). This ratio was decreased up to 70% at LC90 dose. Therefore, in vitro CCG treatment significantly decreased the mitochondrial membrane potential (ΔΨm) dose-dependently. Thus, findings of JC-1 staining suggested the involvement of mitochondria in CCG induced cell death.
Fluorometric analysis of JC-1 reveals that CCG incubation converts green signal to red signal i.e. increases the apoptotic signal (A). Quantification of intracellular generation of ROS after treatment of varying concentrations (at LC50 and LC90 doses). Findings of H2DCFDA assay show dose-dependent elevation in ROS accumulation which is neutralized by co-treatment with N-acetyl cysteine (NAC) (B). CCG treatment decreases the level of GSH (C) and elevates GST activity (D) and MDA level (E) dose-dependently. But the addition of NAC reverses the effects of CCG. Two gravid females, or one male and one gravid female worm were incubated for conducting each set of experiment. All the data are representative of at least five individual experiments performed in triplicate manner, presented as the mean ± s.e.m. *P < 0.05**, P < 0.01, ***P < 0.001, ns = not significant.

Increased generation of ROS and subsequent changes in the antioxidant parameters after CCG treatment
The evidence of the increased generation of ROS due to CCG treatment was confirmed from the findings of H2DCFDA assay. Relative fluorescence ratio of the median of the treated parasites was increased dose-dependently with respect to the control one. Relative fluorescence ratio was increased up to 1.6 and 1.9 fold at doses of LC50 and LC90 compared to control (Fig. 3B). The ROS level gets back to the control level when parasites were co-treated with N-acetyl-cysteine (NAC, an inhibitor of ROS), which signifies the increase of fluorescence level in H2DCFDA method is only due to the increase of ROS level (Fig. 3B).
CCG exposure decreased the level of glutathione (GSH, an antioxidant non-enzymatic component) in a dose-dependent manner (Fig. 3C). At doses of LC50 and LC90 GSH level was reduced to 20.9 (±0.64) % and 50.8 (±1.1) % respectively. Glutathione S-transferase (GST), a phase II detoxification enzyme which employed glutathione in many reactions that contribute to the transformation of numerous compounds which are involved in oxidative stress was significantly increased with dose (Fig. 3D). GST activity increased to 1.4 and 1.7 fold at LC50 and LC90 respectively. Co-treatment with NAC increased GSH level and decreased GST activity towards its basal level and neutralized the effect of CCG.
The treated parasites possessed a higher level of malondialdehyde (MDA) in comparison to control parasites. Elevation in MDA level (up to 1.4 and 1.8 fold at LC50 and LC90 respectively) was found to be dose-dependent (Fig. 3E). MDA is the end product of lipid peroxidation (Roy et al., Reference Roy, Saha, Gayen, Chowdhury and Sinha Babu2018). So, results of TBARS assay exhibited that CCG promoted lipid peroxidation in bovine filarial parasite dose-dependently. But co-treatment with NAC treatment resulted in the drop of MDA level to its basal level (Fig. 3E).
Therefore, the above results further reinforce the previously obtained evidence of apoptosis induction and from it, a conclusion can be drawn that, induction of apoptosis might be due to oxidative stress imposed by CCG upon the parasites.
Enhancement of autophagy after treatment of CCG
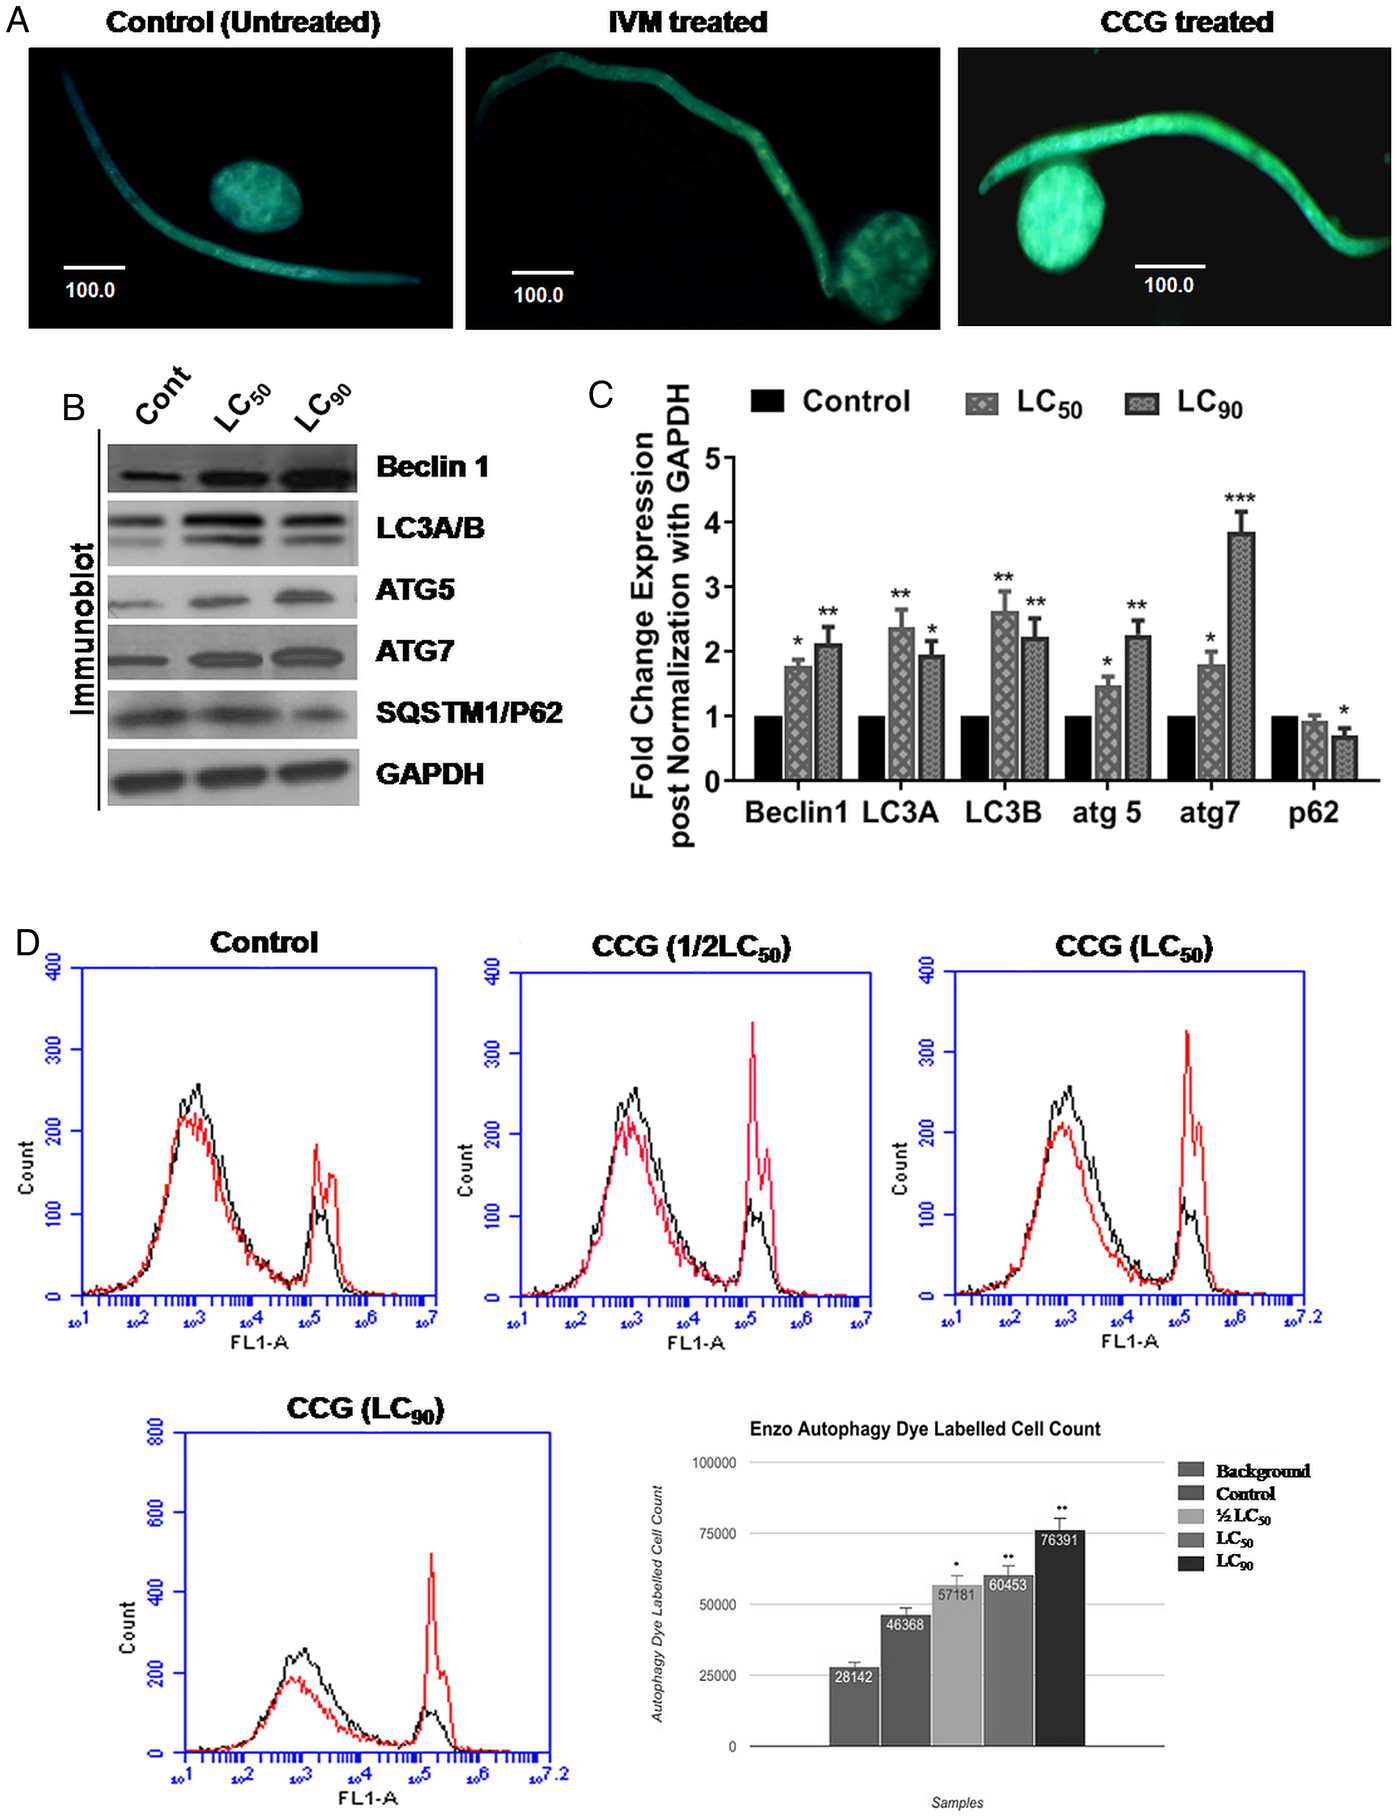
MDC staining of oocyte and Mf was done to make sure that if any other modes of cell death were operating in bovine filariid when treated with CCG. The treated parasite showed a significant increase in staining level compared to the control one (Fig. 4A), detected under a fluorescence microscope. This signified an increase in the acidic vacuoles of the cells and the system as a whole. To make sure if these vacuoles are lysosomes or any other acidic compartments or had formed due to autophagolysosomes we had used the ENZO CYTO-ID autophagy detection dye, that exhibited bright fluorescence upon incorporation into pre-autophagosomes, autophagosomes and autolysosomes (autophagolysosomes) (Chan et al., Reference Chan, Shen, Wilkinson, Patton, Lai and Chan2012). The increase in the level of fluorescence in the treated Mf in comparison to control signified the dose-dependent increase in autophagic flux (Fig. 4D). The up-regulation of autophagic proteins expression was measured by western blotting. A marked increase in the expression level of pro-autophagic proteins like Beclin1, ATG5 and ATG7 were examined after treatment of adult S. cervi (Fig. 4B). Lipidated LC3B (lower band) expression increased denoting the conversion of non-lipidated LC3A to lipidated LC3B form, a marker of autophagic progression (Koukourakis et al., Reference Koukourakis, Kalamida, Giatromanolaki, Zois, Sivridis, Pouliliou, Mitrakas, Gatter and Harris2015).
MDC staining of Mf and oocytes shows increased fluorescence upon treatment with CCG compared to control one (A) indicating up-regulation of autophagic flux (~1.0 × 10⁵ Mf and oocytes were utilized for each treatment set). (B) The protein expression level of Beclin-1, ATG-5, and ATG-7 (the positive regulators of autophagy) increase with dose. The conversion rate of LC3A to LC3B increases dose-dependently. SQSTM1 or P62 (degrades during autophagy) expression decreases with dose. Two gravid females, or one male and one gravid female worm were incubated for conducting each set of experiment. (C) Densitometric analyses of the western blots. (D) Flowcytometric data shows that CCG treatment increases the autophagic flux in a dose-dependent way. 1.0 × 10⁴ oocytes were used for each treatment set for flowcytometric analysis. All the data are representative of at least five individual experiments performed in triplicate manner. *P < 0.05**, P < 0.01, ***P < 0.001, ns = not significant.

Increase in late apoptotic level was revealed by annexin V-propidium iodide (PI) flow cytometric analysis, whose partial recovery was observed following treatment with ROS inhibitors and autophagic inhibitors
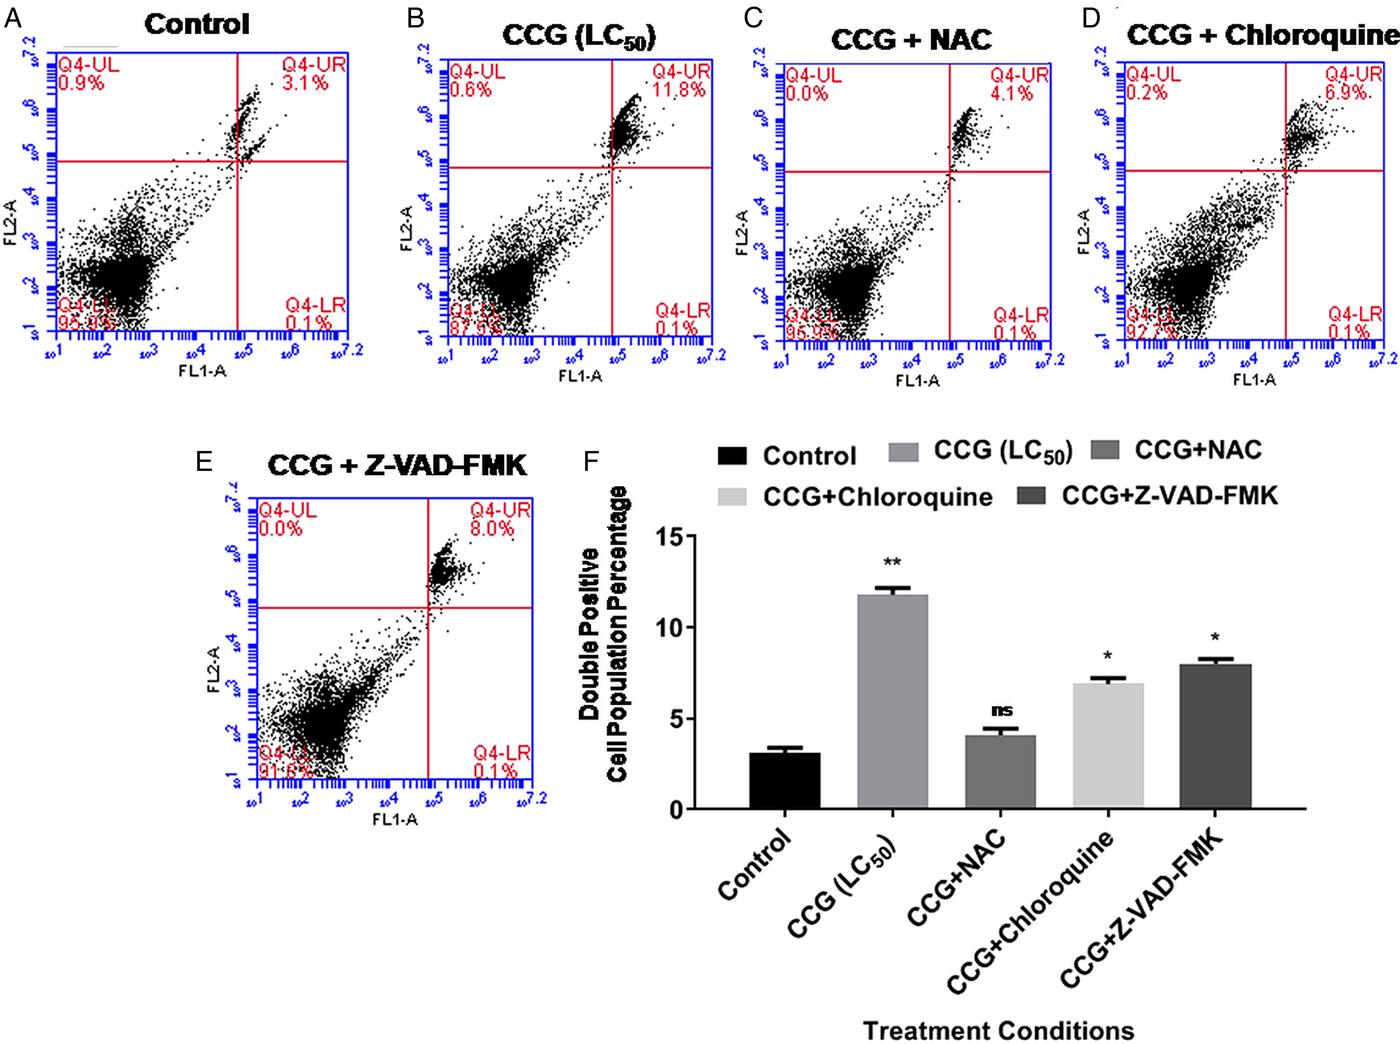
The oocytes of S. cervi were analyzed by Annexin V and PI to assess the level of apoptosis induction. We found that in comparison to the control, only 3.1% oocytes were shown to be late apoptotic (Fig. 5A). There was an increase in the late apoptotic oocytes by 11.8% after incubation with CCG (at LC50) (Fig. 5B). However, after NAC treatment following CCG exposure resulted in a decrease in the late apoptotic cells to 4.1% (Fig. 5C). This suggests that ROS is the potent player for the apoptosis, playing an important role in parasitic demise. Interestingly, we also found a mild reduction in the apoptosis level to 6.9% after the application of the autophagy inhibitor chloroquine followed by CCG treatment (Fig. 5D), while the apoptosis inhibitor reduced the apoptosis level to 8% (Fig. 5E). The double positive (Annexin-V/FITC and PI) cell population percentages are shown in Fig. 5F. It might be consequential as both the mechanisms of apoptosis and autophagy is connected by different molecular crosstalk, and influencing one may have some underlying consequences as observed here.
Flow cytometry analysis after staining with Annexin V/PI. CCG increases the apoptotic level up to 11.8% (B) whereas the control panel exhibited only 3.1% apoptotic death (A). NAC treatment decreases apoptotic death to 4.1% (C). Chloroquine more potently inhibits apoptotic death (6.9%) (D), than Z-VAD-FMK [which reduces apoptotic death to 8% (E)]. (F) Graph showing the percentage of the double positive cell population. All the data are representative of at least five individual experiments performed in triplicate manner. ~1.0 × 10⁴ oocytes were used for each treatment set. *P < 0.05**, P < 0.01, ***P < 0.001, ns = not significant.

Increase in autophagic level observed after incubation with CCG which was partially downregulated by ROS inhibitor but got elevated significantly upon exposure to apoptosis inhibitor
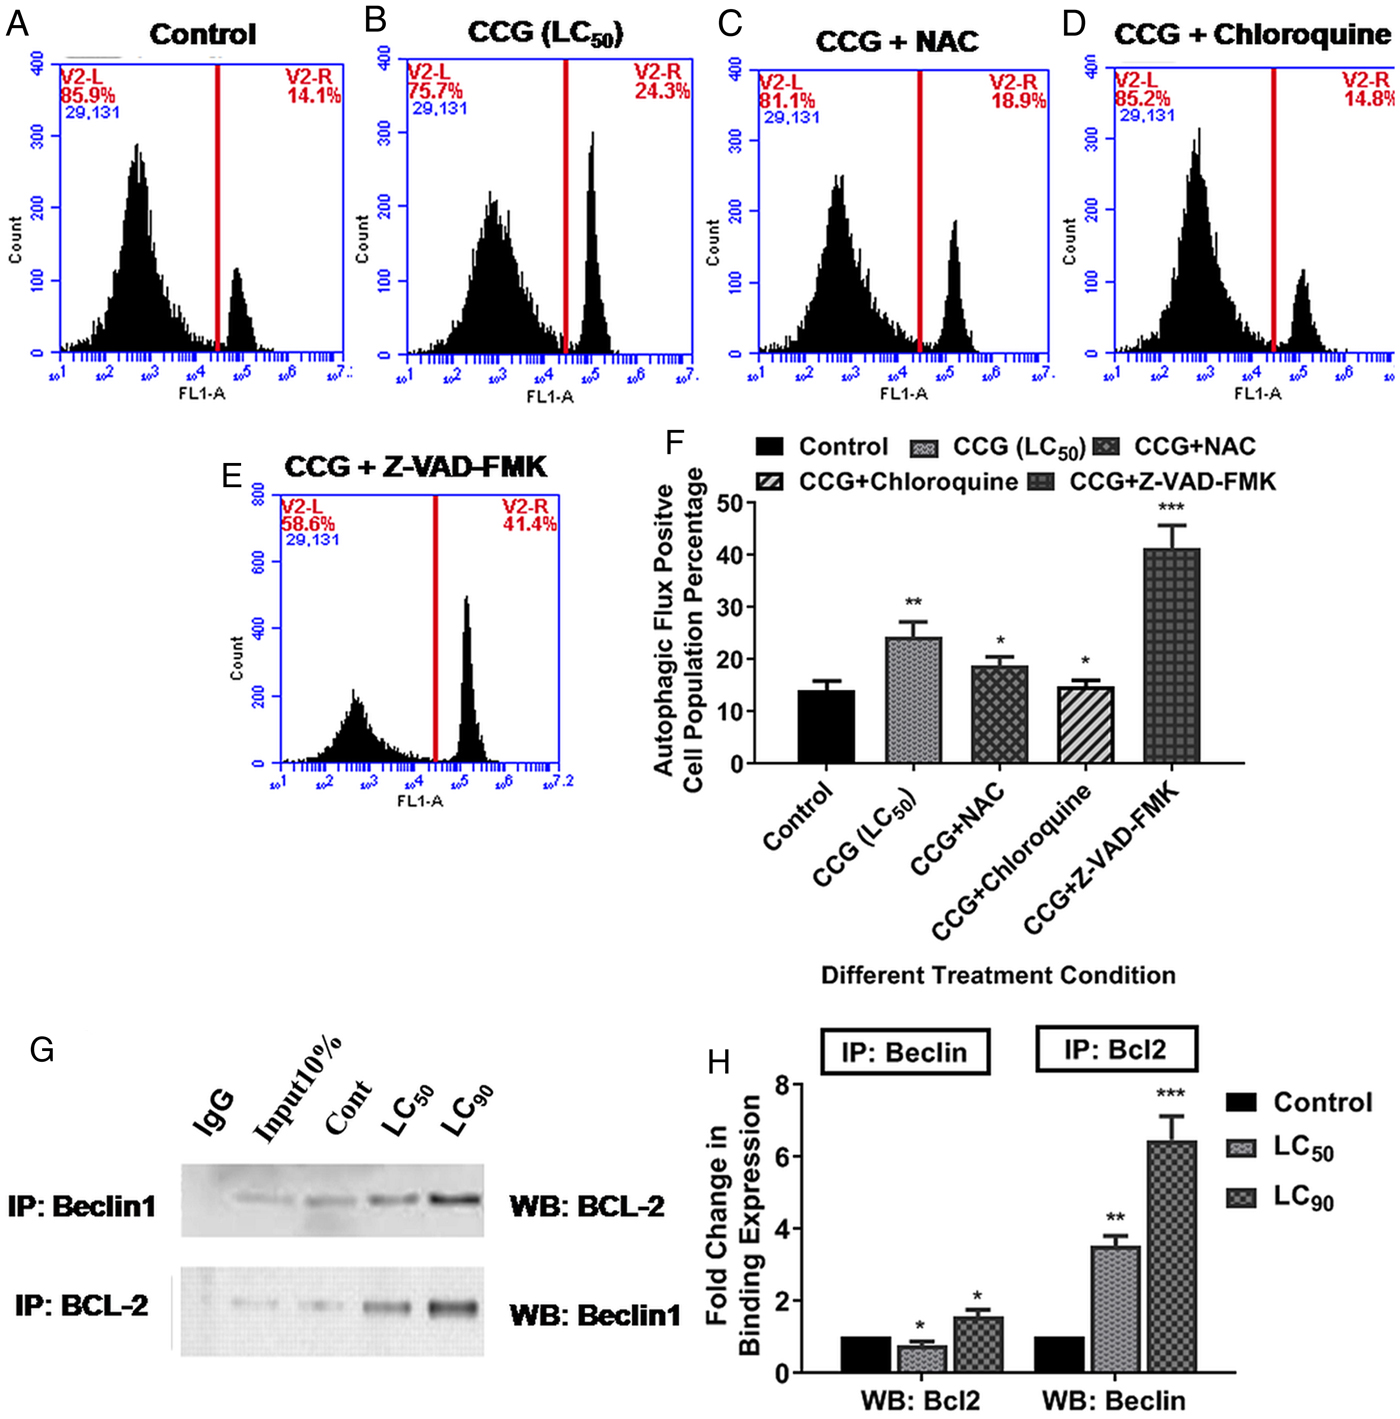
We got a significant increase in the autophagy level after CCG treatment. The basal level of 14.1% autophagic cell count (Fig. 6A) increased to 24.3% due to CCG exposure (at LC50) (Fig. 6B). Hence we can conclude that a major portion of our cells was also dying via autophagic cell death mechanism. Interestingly, with NAC treatment followed by CCG, we found a considerable decrease in the autophagic level to18.9% (Fig. 6C). Hence we can conclude that autophagic cell death mechanism was partially governed by ROS. However, a huge increase in the autophagy level by 41.4% was observed after administering the apoptosis inhibitor Z-VAD-FMK (Fig. 6E). On the contrary, the autophagy inhibitor reduced the level of autophagy to 14.8% (Fig. 6D). It was quite obvious from the data that the inhibition of apoptosis caused an up-regulation in autophagy.
Oocytes from treated parasites were analyzed by flow cytometry after staining with CYTO-ID Autophagy detection kit. CCG increases the autophagy level up to 24.3% from the basal level of 14.1% as found in the control panel (A, B respectively). NAC co-treatment decreases the autophagic level to 18.9% (C). Interestingly apoptosis inhibitor dramatically increases autophagy level to 41.4% (D), whereas autophagy inhibitor reduces the same to 14.8% (E). (F) Graph showing the autophagic flux positive cell population percentage. (G) Immunoprecipitation assay shows that CCG treatment increases the BCL-2-Beclin 1 interaction dose-dependently. (H) Fold change in binding expression. All the data are representative of at least five individual experiments performed in triplicate manner. ~1.0 × 10⁴ oocytes were used for each treatment set. *P < 0.05**, P < 0.01, ***P < 0.001, ns = not significant.

Increase in anti-apoptotic protein (BCL-2) interaction with pro-autophagic Beclin1
The co-immunoprecipitation study was done to decipher the interaction of anti-apoptotic protein BCL-2 and pro-autophagic protein Beclin1. We found a marked increase in BCL-2 level while immunoprecipitating using Beclin1 antibody (lower panel) (Fig. 6G) and increase in Beclin1 level while immunoprecipitating with the BCL-2 antibody (Upper panel) (Fig. 6G). Whereas, IgG control showed no expression of either Beclin1 (lower panel) or BCL-2 (upper panel) (Fig. 6G). Thus in both ways, immunoprecipitation confirmed that the interaction between these two proteins had increased subsequently after CCG treatment.
CCG is a non-toxic molecule
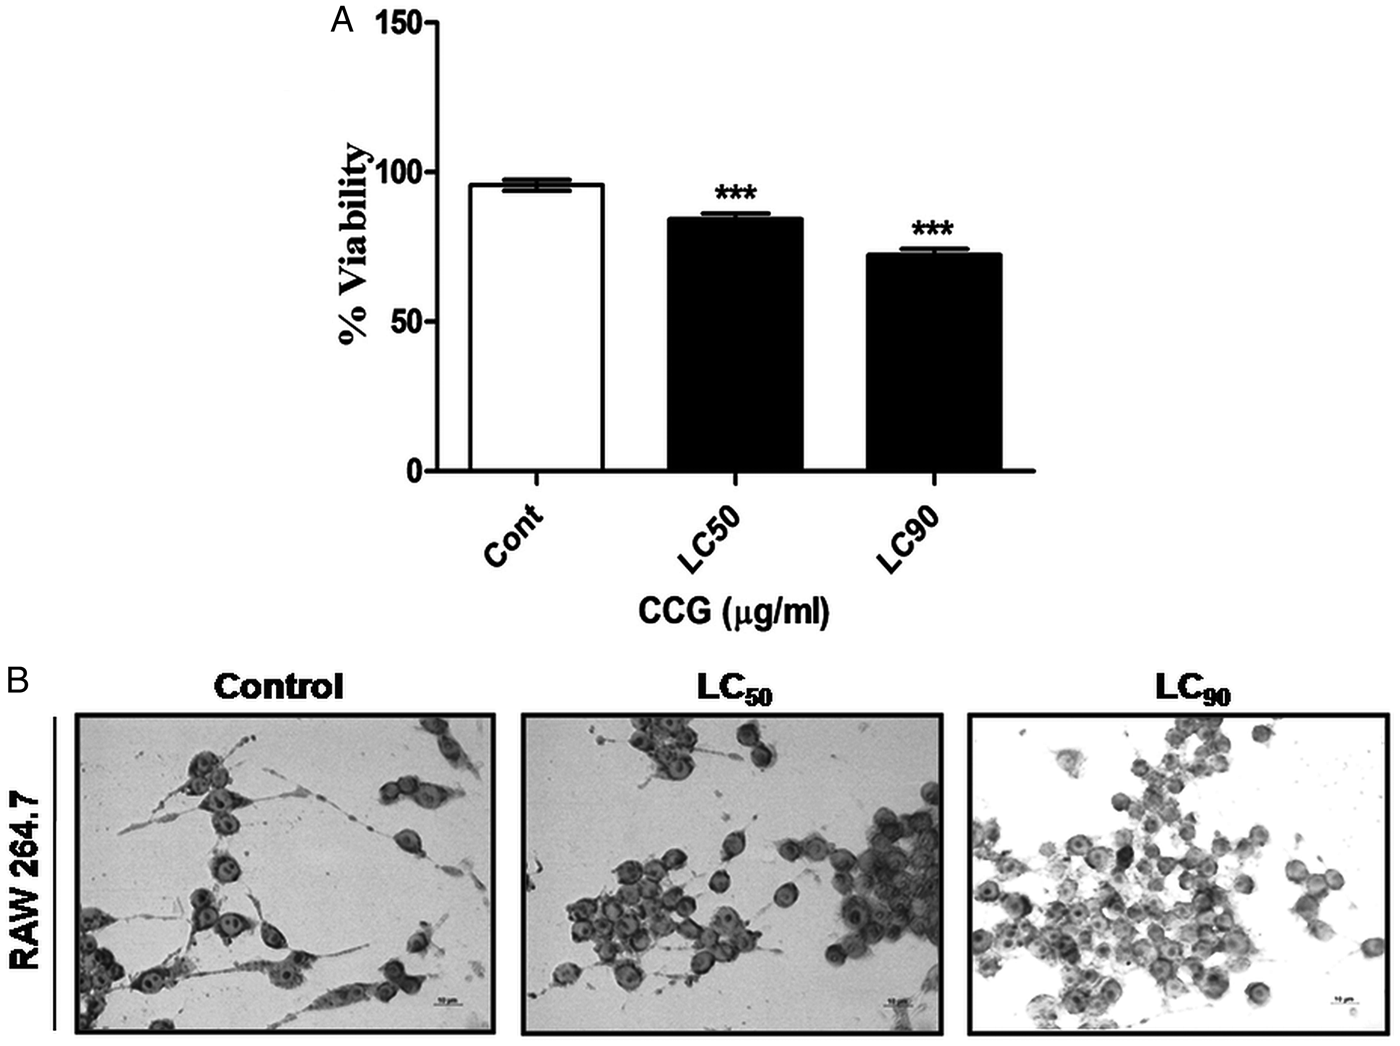
CCG was found non-toxic when administered on mouse macrophage cell line RAW 264.7. LC50 value was found to be 69.25 ± 2.1 µg ml−1 which means the dose required to kill the parasite is non-toxic to RAW 264.7 cells (Fig. 7A and B).
(A) Graph showing the percent viability of the RAW 264.7 macrophages treated with CCG at the concentration similar to the LC50 and LC90 dose derived from the parasites. (B) Morphology of the raw 264.7 macrophages after treatment. All the data are representative of at least five individual experiments performed in triplicate manner. ~1 × 10⁶ mouse macrophages (RAW 264.7) were used for each treatment set. *P < 0.05**, P < 0.01, ***P < 0.001, ns = not significant.

Discussion
The present study highlighted the probable mechanism of macro-filaricidal activity of C-cinnamoyl glycosides (CCGs) on bovine parasite S. cervi. The death of the filarial parasite showed a positive correlation with the concentration of CCGs. To decipher how the death of the parasitic cells actually happening, we studied both apoptotic and autophagic cell death mechanisms respectively. Interestingly initial studies on parasitic death caused by CCG treatment showed that both types of cell death are in action. Hoechst stain prominently showed the nuclear degeneration after 24 h of treatment with CCG (at LC90). TUNEL assay detected apoptotic cells that have undergone extensive DNA degradation during the late stages of apoptosis. DNA laddering pattern was observed when CCG was added to the parasite culture medium. Flow cytometric analysis of the treated oocytes of bovine parasite showed a significant rise in the AnnexinV level denoting a rise in apoptosis level. The rise in the expression level of the pro-apoptotic proteins like CED-3, CED-4, and EGL-1, and down-regulation of the anti-apoptotic protein like CED-9 supported our finding of the pro-apoptotic mode of cell death after CCG treatment.
While studying the level of ROS generated within the bovine parasite after incubation with CCG we found a significant increase in its level. We can postulate that CCG causes apoptotic cell death via the profound generation of ROS. The level of antioxidant components like GSH decreased with subsequent increase in the activity of GST. Increase in lipid peroxidation level also signifies the oxidative status of the parasite (Fimia et al., Reference Fimia, Kroemer and Piacentini2013). The disruption of mitochondrial membrane potential, as observed via fluorometric analysis of JC1 staining, can be a probable cause for the generation of ROS after CCG exposure.
However, we are interested to figure out the role of autophagy as one of the secondary mechanisms of cell death as it performs the task in balancing cell survival and death. An increase in the acidic vacuole formation was observed in CCG treated parasites in comparison with the control after staining with MDC. To make our hypothesis about autophagic cell death more clear we have done a flow cytometric analysis with Cyto ID autophagy detection dye (Enzo) which helped us to monitor the autophagic flux. Enzo is a novel dye that selectively labels accumulated autophagic vacuoles. The dye has been optimized through the identification of titratable functional moieties that allow for minimal staining of lysosomes while exhibiting bright fluorescence upon incorporation into pre-autophagosomes, autophagosomes, and autolysosomes (autophagolysosomes) (Iwai-Kanai et al., Reference Iwai-Kanai, Yuan, Huang, Sayen, Perry-Garza, Kim and Gottlieb2008; Shvets et al., Reference Shvets, Fass and Elazar2008).
The up-regulated expression of autophagic proteins confirms the same. Sqstm1/p62 is a carrier protein which binds with the autophagic cargo proteins which carry it to the vacuoles for degradation via autophagy (Fimia et al., Reference Fimia, Kroemer and Piacentini2013). In the process, the p62 level was reduced due to co-degradation with the proteins it carried with. Conversion from LC3A form to LC3B phosphatidyl ethanolamine conjugated form signifies a pro-autophagic nature of cell death due to the treatment with CCG (Koukourakis et al., Reference Koukourakis, Kalamida, Giatromanolaki, Zois, Sivridis, Pouliliou, Mitrakas, Gatter and Harris2015; Cao et al., Reference Cao, Huang, Zhang, Lu, Donkor, Zhu, Qiu and Kang2018).
Our experimental data conclusively showed that both autophagic and apoptotic mechanisms underplay a critical role when the parasites were treated with the compound of our interest. The apoptosis level in the parasites increased after CCG treatment which is essentially mediated by ROS. This can be confirmed when the ROS inhibitor NAC causes downregulation of apoptosis. CCG treatment on the bovine filariid also shows a positive upregulation in autophagy, whose level is downregulated when ROS is depleted by NAC administration. Interestingly there is a huge increase in the autophagic induction of the filarial parasite post apoptotic block by caspase inhibitor treatment. This finding further corroborates with the fact that perturbation in apoptosis promotes autophagy as a last resort to enhance the possibility of cell survivability. Failure of restoring to the full potential might lead to autophagy-mediated cell death. A number of cellular interactions are involved in the balancing process between apoptosis and autophagy of which, the interaction between anti-apoptotic protein BCL-2 and pro-autophagic protein Beclin1 is imperative.
The fine-tuning of these two cell death processes are maintained by the interaction of pro-autophagic protein Beclin1 with the anti-apoptotic protein BCL-2. Post CCG treated filariid have shown a significant increase in the interaction between these two proteins. The bulk of BCL-2 being interacted with Beclin1, resulted in the loss of function of its anti-apoptotic mechanism, which might be the major cause behind the apoptotic cell death. However, Beclin-1 in its co-interaction form with BCL-2 should have resulted in downregulation of autophagic machinery. Our obtained result does not fit with this hypothesis. Some active autophagic flux was observed although there happened a partial dampening of the autophagic response. Interestingly, this unusual phenomenon might have occurred due to the activation of Beclin-independent autophagic pathway in the treated parasites. Moreover, excess free Beclin1 in the treated parasites might be a possible cause behind this contradictory event. Intriguingly, this free Beclin1 is sufficient to trap BCL-2 after proper activation, vacuole formation and initiation in autophagy.
In conclusion, the compound, CCG possesses strong macro-filaricidal activity, which is mediated through the induction of autophagic and apoptotic mode of cell death. CCG plays a pivotal role in the enhancement of both apoptosis and autophagy mediated death in S. cervi. The generation of ROS and functional quenching of BCL-2 by Beclin1 are the probable causes of apoptosis induction. On the other hand, autophagy also runs in hand-in-hand with apoptosis to enhance the death of the parasite after treatment. Thus the compound may play a significant role to limit the debilitating effects of this parasitic disease and its mechanistic pathways may help to pave the way to develop new antifilarial therapeutics in the near future.
Author ORCIDs
Santi P. Sinha Babu, https://orcid.org/0000-0002-7441-6426
Acknowledgements
N.J. sincerely acknowledges UGC, Government of India for providing Non-NET research fellowship. Sincere thanks are due to Prof. Goutam Ghosal, Department of English, Visva-Bharati University, Santiniketan for critically evaluating the language of the manuscript.
Financial support
The work was supported by the Department of Science & Technology (DST) (SR/SO/AS-006/2014) and University Grants Commission (UGC) (42-534/2013 (SR)). The 1st author (P.R.) sincerely acknowledge DSKPDF (No.F.4-2/2006 (BSR)/BL/17-18/0389) scheme by UGC, Govt. of India for providing financial support.
Conflict of interest
None.
Ethical standards
The authors declare that all procedures and protocols for this study comply with the ethical standards of the relevant guides on the care and use of laboratory animals and have been approved by the Institutional Animal Ethical Committee, Visva-Bharati University, Santiniketan, West Bengal, India under the guidelines of Committee for the Purpose of Control and Supervision of Experiments of Animals (CPCSEA); Government of India (Registration No. 1819/GO/Ere/S/15/CPCSEA).