I. INTRODUCTION
Biomineralized composites constitute the majority of the “hard” materials in nature. Different biomineralized composites exhibit different material properties using the same constituent materials, by influencing both the location and absolute amount of the organic components within the mineral while controlling the overall microstructure and local mineral polymorphs by templating onto organic macromolecules.Reference Hunter1 It is this composite nature of included organic components and controlled microstructure that gives many biomineralized composites superior mechanical properties when compared with their constituent parts. Mollusks achieve a large fracture toughnessReference Barthelat and Espinosa2 of a calcium carbonate–organic composite (nacre) by depositing thin layers of chitin and protein between plates of aragonite giving a mineral of total organic content of less than 5%. Ascidians manipulate the tunic spicules of their skeleton by controlling the polymorphs of calcium carbonate deposited to have an amorphous calcium carbonate (ACC) core (stabilized using a protein content of less than 1%Reference Aizenberg, Lambert, Weiner and Addadi3) surrounded by a calcitic outer layer, which has a lower solubility in the seawater in which they live than the ACC core.Reference Aizenberg, Lambert, Weiner and Addadi3 In this way, organisms achieve the mechanical superiority of ceramic-like materials (on a per weight if not absolute basis) while being formed under ambient conditions from naturally abundant ingredients.
The majority of work on replicating CaCO3 biomineralization has been conducted using either a vapor diffusion methodReference Gower4–Reference Shen6 or supersaturated solutions of Ca2+ and  ${\rm{CO}}_3^{2 - } $ ions for exploration of how a variety of proteins and other biological macromolecules affect crystal growth.Reference Addadi and Weiner7, Reference Elhadj, Salter, Wierzbicki, De Yoreo, Han and Dove8 Work by Munch et al.Reference Munch, Launey, Alsem, Saiz, Tomsia and Ritchie9 has focused on nacre replication by using preformed ceramic crystals and binding them with various polymeric or organic components to produce nacre-like microstructures. Yet, very little work has focused on the codeposition of both constituents of a mineral–organic composite concurrently. In many natural biominerals, the mineral and organic components are codeposited, and as such, an experimental technique that can mimic this could provide a more biomimetic way of producing mineralized composites. The alternate soaking process (ASP) is a laboratory technique developed to rapidly deposit biocompatible hydroxyapatite (HA)Reference Taguchi, Kishida and Akashi10–Reference Taguchi, Kishida and Akashi12 or calcium carbonate (CaCO3)Reference Watanabe and Akashi13 coatings on polymers and metals. Previous authors have primarily focused on mineral deposition for use in tissue engineering on substrates ranging from extracted tendonReference Yamaguchi, Kogure, Sakane, Tanaka, Osaka and Tanaka14 to electrospun polymer meshesReference Yu, Jang, Kim, Lee and Kim15 alongside cell compatibility studies.Reference Ogomi, Serizawa and Akashi16 Where CaCO3 deposition using the ASP has been studied, it has been either alongside HA for drug delivery applicationsReference Watanabe and Akashi13, Reference Watanabe and Akashi17, Reference Ogomi, Serizawa and Akashi18 or on its own for the purpose of determining cell viability on composite substrates of HA and CaCO3.Reference Serizawa, Tateishi and Akashi19 In contrast, here, the heterogeneous nucleation and growth of CaCO3–organic composites are demonstrated for the purpose of replicating composite biominerals.
Mineral deposition during the ASP relies on layer-by-layer ion binding to the surface of the substrate, while the rinse solution removes loose ions that would form solution precipitates. This method of mineral deposition is heterogeneous from the substrate, as occurs in natural biominerals. In addition to heterogeneous nucleation from an organic substrate, the majority of biomineralized materials contain some organic phase of collagen and proteins throughout the bulk of the mineral. Recently, the ASP for HA was modified to include an organic component, gelatin (GEL), for coprecipitation of an organic–inorganic composite (HA–GEL).Reference Strange and Oyen20 This technique lends itself to replicating the natural formation of a biomineralized composite, such as eggshell, where the mineral is heterogeneously nucleated on a collagenous membrane, containing proteins, which dictate the mineral microstructure, and in addition where some organic material—2% to 3%Reference Panheleux, Nys, Williams, Gautron, Boldicke and Hincke21–Reference Hunton23—is found throughout the biomineralized layer.
Here, a CaCO3–GEL composite is deposited using the modified ASPReference Strange and Oyen20 on both glass coverslips and demineralized eggshell membranes. The organic fraction of the composite is ascertained from comparison between the Fourier transform infrared spectra (FTIR) of the sample and FTIR calibration curves determined from a series of reference materials of known organic contents. Once the organic fraction of the CaCO3–GEL composite has been determined, it is demonstrated how this can be controlled over the range of 1–10% by weight. Polymorphism of calcium carbonate particles is determined to be either calcite or vaterite using scanning electron microscope (SEM) imaging and FTIR spectrometry. Particle morphology is strongly influenced by the substrate onto which the mineral composite is nucleated. SEM imaging reveals that calcite particles exhibit size dependence on the number of ASP cycles performed. This work replicates many of the natural features of eggshell by producing a CaCO3–GEL composite with a controllable organic content, heterogeneously nucleated on an eggshell membrane.
II. MATERIALS AND METHODS
A. Demineralized eggshell membrane preparation
Japanese quails eggs (Clarence farm brand; J Sainsbury PLC, London, U.K.) were demineralized to release the eggshell membranes by a 24-h soak in 5% by weight ethylene diamine tetraacetic acid (EDTA) solution, pH 7.4, made from powdered EDTA and NaOH pellets (Sigma-Aldrich, Andover, U.K.). The active surface of the membrane is defined as the outside surface, which contains the mamillary knobs from which the palisade crystals of the natural eggshell nucleate.Reference Hunton23
B. Reference materials
Reference composites of calcium carbonate and gelatin of known gelatin content in the range of 1–20% GEL by weight were produced by mixing dry 180 bloom gelatin powder (Sigma-Aldrich, U.K.) and calcium carbonate powder (Sigma-Aldrich, U.K.) with 10 mL of distilled water (DW) to form a slurry. These samples were subsequently heated to 80 °C to melt the GEL and then transferred to a heated and sealed 25 mL conical tube. The conical tube was then placed in a continuous roller made from parts from a Lego Mindstorms NXT kit (Lego Group, Billund, Denmark) where it was rolled at 30° to the horizontal while slowly cooled in a water bath over 4 h to room temperature. Conical tubes were then rolled for a further 2 days with the lid removed to allow evaporation of water from the sample, at which point the slurry had formed a solid. After forming a solid, samples were transferred to an autodesiccator for 7 days to dry completely. After the reference composite samples had been dried, they were weighed to confirm that all water had evaporated and hence check that the weight percentage of gelatin in the final homogeneous solid is the same as was added to the dry powder mixture; for all samples, the total mass of the solid was within ±1% of the original mass of the two powders.
Calcite powder was purchased from Sigma-Aldrich (U.K.). Vaterite powder was produced by mixing 20 mL of a 200 mmol Ca2+ ion solution with 20 mL of a 200 mmol  ${\rm{CO}}_3^{2 - } $ ion solution, followed by immediate addition of 20 mL of 100% ethanol (Sigma-Aldrich, U.K.) to arrest vaterite conversion to calcite.Reference Jin, Wang and Yue24–Reference Manoli and Dalas26 Once mixed, the resulting solution was centrifuged, the remaining fluid drained off, and the precipitate dried.
C. Automated ASP
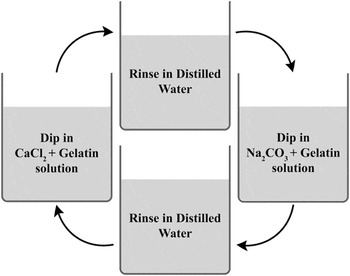
The ASP, Fig. 1, was used to coprecipitate CaCO3–GEL composites on both glass coverslips and demineralized eggshell membrane substrates. The solutions for this were produced as follows: a 200 mmol Ca2+ ion solution stabilized to pH 7.4 was prepared by dissolving 5.88 g of calcium chloride dihydrate (CaCl2·2H2O; Sigma-Aldrich Company Ltd., U.K.) in 20 mL of 1 mol Tris-HCl (Sigma-Aldrich Company Ltd., U.K.) diluted with 180 mL of DW. A 200 mmol  ${\rm{CO}}_3^{2 - } $ solution was prepared by diluting 80 mL of 0.5 mol Na2CO3 solution (Sigma-Aldrich Company Ltd., U.K.) with 120 mL of DW. Gelatin was included in both of these solutions by heating the solutions to 80 °C and adding between 2.5 and 15 g of dry 180 bloom gelatin extracted from porcine skin (Sigma-Aldrich Company Ltd., U.K.). For one cycle of the ASP, glass coverslips or eggshell membranes were soaked first in 200 mL of 200 mmol Ca2+ and GEL solution for 10 s followed by a 10-s soak in DW, then a 10-s soak in 200 mL of 200 mmol
 ${\rm{CO}}_3^{2 - } $and GEL solution followed by an additional 10-s soak in a different bath of DW. All solutions were kept at 50 °C in a water bath to stay above the melting temperature of gelatin.
The ASP with gelatin (adapted from Ref. Reference Ogomi, Serizawa and Akashi16). Both the CaCl2 and Na2CO3solutions are 200 mmol, with between 2.5 and 15 g of gelatin in each 200 mL of solution.

The ASP was automated using a robotic crane built from a Lego Mindstorms NXT kit (Lego Group, Denmark) with a mesh basket for holding glass coverslips.Reference Strange and Oyen20 Membrane samples were mounted by wrapping around a stainless steel disk and supported by a magnet with the active surface facing down.
D. Scanning electron microscopy
Samples were gold coated and then imaged in an EVO LS 15 (Carl Zeiss, Oberkochen, Germany) SEM. In addition, three images were taken across the surface and those displayed are representative of the structure across the surface of each sample.
E. Image analysis
ImageJReference Abramoff, Magelhaes and Ram27 was used to extract quantitative data from SEM images. Particles were characterized based on their morphology to be either spherulitic or rhombohedral. Counts of total numbers of particles for determining the percentage of each particle type, measurements of rhombohedral crystal sizes, and measurements of the minimum size of particles of each morphology were made. Averages from nine images were computed, where three were from each of three different samples produced under the same conditions.
F. Attenuated total reflection–FTIR
A Spectrum 100 FTIR spectrometer (Perkin Elmer, Waltham, MA) was used to collect attenuated total reflection–FTIR spectra of the component and composite materials in this study. Spectra were averaged over a minimum of 16 readings and were recorded from 4000 to 600 cm−1 with a resolution of 4 cm−1. All spectra herein are analyzed in absorbance mode so as to allow the spectra of mixtures to be considered as linear combinations of two or more constituents.Reference Haaland28
III. RESULTS
A. Characterization of reference materials
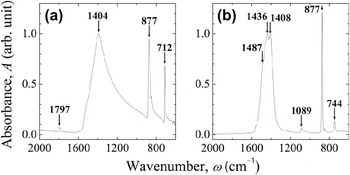
To identify the polymorphs of calcium carbonate deposited via the ASP, spectra were taken of both calcite and vaterite. Calcite spectra, Fig. 2(a), are taken of powdered calcium carbonate (Sigma-Aldrich, U.K.). Vaterite spectra are taken of the powder produced as detailed above. The method of producing vaterite powder discussed above produced a solid of approximately 98% vaterite with a small amount of calcite present; if the same process is performed without the addition of ethanol, the precipitate is approximately 70% vaterite with the remainder being calcite.
Characteristic FTIR spectra of (a) calcite with the distinct calcite peak at 712 cm−1 and (b) vaterite with the distinct vaterite peak at 744 cm−1.

In this study, only those peaks characteristic of vaterite and calcite were observed. Specifically, calcite's in-phase, V3 vibration mode of the carbonate ion around 1430–1400 cm−1 is narrow and observed as a single peak, while the V2 peak is observed at 713 cm−1; with no second adjacent peak at 700 cm−1 as would indicate aragonite.Reference Jackson29 In this study, the V3 peak of calcitic structures is observed specifically in the range 1409–1400 cm−1, which is closer to the single crystal value of 1407 cm−1 than the powdered values in the range of 1432–1410 cm−1.Reference Farmer30 For vaterite, the V3 peak of the carbonate ion around 1430 cm−1 is observed to widen into three closely spaced peaks at 1487, 1436, and 1408 cm−1, and the V2 peak is observed at 744 cm−1.Reference Jackson29–Reference Farmer30 These differences can be observed in the characteristic spectra of calcite and vaterite in Figs. 2(a) and 2(b), respectively.
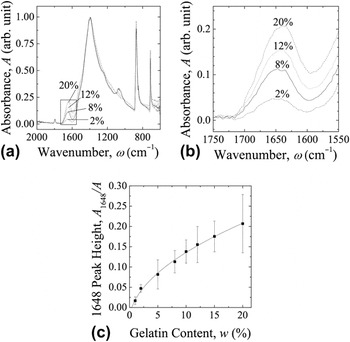
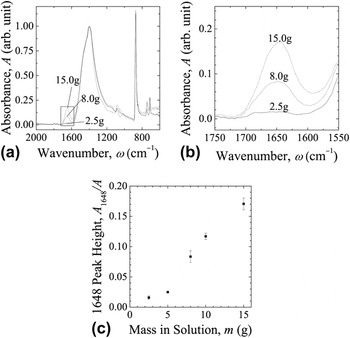
To determine the GEL content of the deposited CaCO3–GEL composites using FTIR, reference spectra were taken from the samples of calcium carbonate powder and gelatin that were manufactured as discussed above. All spectra of both these reference samples and of experimental samples were normalized such that the height of the V3 peak of the carbonate ion around 1430 cm−1 is unity, thus allowing the heights of the 1648 cm−1 gelatin peak to be compared. The spectra are normalized to the V3 peak as it is the least dependent on which polymorph of calcium carbonate is present.Reference Farmer30 Four of the eight reference spectra are shown in Figs. 3(a) and 3(b). It can be seen that the GEL peak absorbance increases with increasing GEL content. From this, a calibration curve was determined between the height of the 1648 cm−1 GEL peak and the known GEL content by weight and is shown in Fig. 3(c). The organic content of any composite of CaCO3 and a polypeptide such as GEL or collagen can then be determined by measuring the height of the amide I peak around 1648 cm−1 and comparing with the relationship determined from Fig. 3(c) and described by:
 $$w{\rm{\% }}\, = \,327.82A_G^2 \, + \,26.10A_G \, + \,0.3991\quad,$$
(a) Four reference FTIR spectra of CaCO3–GEL composites prepared as reference samples of known GEL content showing the increasing height of the 1648 cm−1 peak with increasing GEL content by weight. (b) An expanded version of the key 1648 cm−1 peak highlighted in (a). (c) The trend of the height of the 1648 cm−1GEL peak with increasing mass of GEL by weight in the reference samples.

where  $A_G \, = \,{{A_{1648} } \over A}$ is the height of the 1648 cm−1 peak (A 1648) divided by the height of the V3 peak around 1430 cm−1 (A), which is the peak with the highest absorbance, and wt.% is the GEL percentage by weight. Equation (1) is the quadratic inverse of the x 0.5 trend line in Fig. 3(c).
B. Samples deposited using the ASP
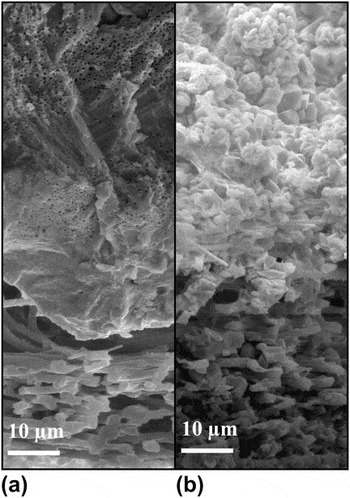
The ASP was performed using a variety of gelatin contents and cycle numbers on both glass coverslips and eggshell membranes to determine the effects of the substrate and the inclusion of gelatin on the deposited mineral, as observed primarily using FTIR and SEM. Samples were produced on eggshell membranes with 2.5 g of GEL per ionic solution all held at 50 °C and grown as far as 120 cycles; this produced a CaCO3–GEL composite approximately 60 μm thick on the surface of the eggshell membrane as can be seen in Fig. 4(b).
Comparison in cross section of the mineral–membrane interface region in (a) a quails egg and (b) a specimen produced by the ASP after 120 cycles using 2.5 g of GEL per ionic solution at 50 °C. In both images, the membrane of collagen fibrils can be seen at the bottom with the mineral structure above.

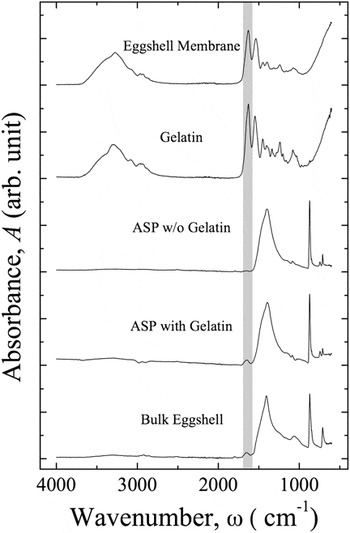
Before undergoing the ASP, the demineralized eggshell membranes were investigated using FTIR analysis to determine that the calcitic shell mineral had been removed. Spectra of the demineralized membrane can be observed in Fig. 5(a), and the confirmation that all shell mineral had been removed can be seen by the lack of a peak around 1430 cm−1 characteristic of calcite, as can be observed in Fig. 2(a). FTIR was also used to identify the presence of gelatin in ASP samples. Figure 5(c) shows FTIR spectra of an ASP sample with no GEL in solution and Fig. 5(d) shows an ASP sample with 8 g of GEL in each 200 mL of solution, both deposited on a demineralized eggshell membrane substrate. The inclusion of GEL in the mineral observed in Fig. 5(d) can be identified by the presence of the amide I peak (highlighted area) characteristic of the backbone of polypeptides.Reference Krimm and Bandekar31
FTIR spectra showing how the 1648 cm−1amide I peak of polypeptides (highlighted region) can identify the presence of an organic component in calcium carbonate biominerals, both natural and those deposited via ASP (20 cycles) when GEL is included in the ASP solution.

The effect of changing the mass of GEL in the ionic solutions used for the ASP was determined. The GEL content was varied from 2.5 to 15 g per 200 mL of ionic solution, and 40 cycles of the ASP were then performed on an eggshell membrane substrate. FTIR spectra in Figs. 6(a) and 6(b) show how the peak height around 1648 cm−1 characteristic of GEL increases for samples made using different masses of GEL in the ionic solutions. Figure 6(c) shows the relationship between mass in solution and peak height.
(a) Three FTIR spectra demonstrating how the height of the 1648 cm−1 GEL peak in a mineral deposited by an ASP on eggshell membranes increases with dry mass of GEL added to each 200 mL of ionic solution. (b) An expanded version of the key 1648 cm−1 peak highlighted in (a). (c) The trend in the height of the 1648 cm−1peak with the dry mass of GEL in solution.

C. Effect of substrate on composites
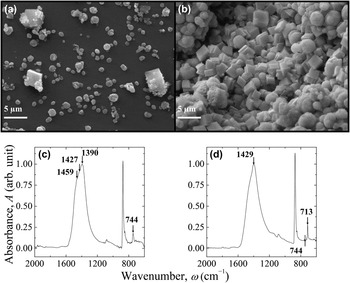
For the deposition of the calcium carbonate–GEL composites, two different substrates were used, glass coverslips and demineralized natural eggshell membranes. On both substrates, particles were found with either a spherulitic or rhombohedral morphology. On glass coverslips, the calcium carbonate particles that were deposited formed a sparse covering across the surface of the coverslip and had a predominantly spherulitic morphology (98% when counted) as can be seen in Fig. 7(a), with only a small number of rhombohedral particles in between. FTIR of samples containing primarily spherulitic particles, Fig. 7(c), shows the V2 peak at 744 cm−1 and almost no peak at 713 cm−1 and hence are largely vaterite. Quantitatively, if the relative peak heights of the characteristic calcite and vaterite peaks are compared—accounting for their already different heights in the pure spectra—then the glass substrates appear to have approximately 95% vaterite. On demineralized eggshell membranes, the total amount of particles in terms of both number and mass was much greater at the same conditions as can be seen in Fig. 7(b). Second, the morphology of particles changed to contain more rhombohedral particles (64% when counted) with a reduced proportion of spherulites in between. FTIR of samples on membranes, Fig. 7(d), shows V2 peaks at both 713 and 744 cm−1with the calcite peak being consistently larger than the vaterite peak, demonstrating that these samples contain both calcite and vaterite. Quantitatively, the heights of the characteristic calcite and vaterite peaks suggest that the eggshell membranes nucleate 50% of each calcite and vaterite.
SEM micrographs of the surface of (a) glass and (b) eggshell membrane substrates after mineralization using an ASP for 20 cycles at 50 °C with 2.5 g of GEL in solution. Image (b) on eggshell membrane shows a larger ratio of rhombohedral calcite crystals versus spheroid-shaped vaterite particles in addition to a greater number of total particles compared to (a) on glass at the same conditions. Graphs (c) and (d) are FTIR spectra of (a) and (b), respectively, and show the presence of almost exclusively vaterite on the glass substrate and predominantly calcite on natural eggshell membranes, as determined by comparison of the 713 and 744 cm−1peaks indicative of calcite and vaterite, respectively.

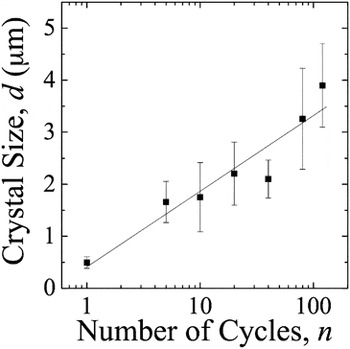
The average size of vaterite particles deposited on both glass coverslips and eggshell membranes exhibited a very small dependency on the number of ASP cycles. The average size of vaterite particles increased from 0.5 μm after one cycle to 2 μm after 20 cycles, as in Fig. 7(a), and did not increase further. By 120 cycles, the size remained consistent at 2 μm. Further increasing the number of cycles only caused increased numbers of particles to be observed. When examining calcite crystals nucleated on membranes, Fig. 7(b), the average size increased consistently from 0.5 μm with one cycle up to 4 μm at 120 ASP cycles, as shown in Fig. 8.
Average size of calcite crystals on mineralized eggshell membrane as a function of the number of ASP cycles.

IV. DISCUSSION
The ASP is a rapid experimental technique that can be used to produce biomineralized composites heterogeneously nucleated on a substrate that has not previously been utilized to deposit a calcium carbonate–GEL composite in a controlled manner. This control over composite mineral GEL content is essential for the process of mimicking biominerals that contain organic material distributed within the mineral. By production of reference samples and subsequently a calibration curve for the organic content, FTIR spectra can be used to predict the organic content of these CaCO3–GEL composite. In addition, it can be seen that for samples grown using the ASP, an extraordinary amount of control over the composition of the composites produced—in terms of organic content, mineral polymorph, and calcite crystal size—can be exercised by changing the substrate, amount of GEL included in solution, and number of cycles, respectively.
For the ASP samples in which molten GEL was included in the ionic growth solutions, the presence of the GEL in the mineral as a composite was identified using FTIR spectra. In the spectra of pure GEL, as in the collagen that comprises eggshell membrane, the amide I peak occurs at 1628 cm−1 as can be seen in Figs. 5(a) and 5(b). However, the amide I peak of both the collagen component of bulk eggshell and of GEL when it is incorporated into the deposited calcium carbonate mineral is shifted to 1648 cm−1. This signifies a conformational change in the organic component—whether it be the type I, V, and X collagen in natural eggshellReference Rose and Hincke22, Reference Arias, Fernandez, Dennis and Caplan32, Reference Fernandez, Araya and Arias33 or the GEL in ASP samples—when included within a calcium carbonate mineral. Subsequently, this shows that the addition of molten GEL to the ionic ASP solutions allows for the coprecipitation of a CaCO3–GEL composite where the GEL is bound within the mineral in a similar manner to that in natural eggshell.
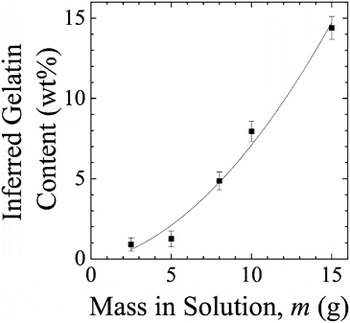
From quantitative FTIR analysis, the organic content of any composite of CaCO3 and a polypeptide such as GEL or collagen was determined by measuring the height of the amide I peak around 1648 cm−1 on a normalized plot. The organic content as a percentage was predicted using Eq. (1). Applying this method to the FTIR of bulk eggshell in Fig. 5(e) suggests that bulk eggshell has an organic content of 2.9% ± 0.61% (n = 5), in line with previous estimates of 2%, 2%, and 3% obtained by different methods.Reference Panheleux, Nys, Williams, Gautron, Boldicke and Hincke21–Reference Hunton23 From the relationship between the 1648 cm−1 peak height and the mass of GEL in solution and by using Eq. (1), the relationship between mass of gelatin in the growth ionic solutions and that achieved in the final mineral can be inferred, as shown in Fig. 9. From this relationship, it can be seen that to achieve a composite mineral deposited using the ASP with a similar organic content to bulk eggshell (2.6%), 5.90 g of dry 180 bloom GEL should be added to each 200 mL of calcium or carbonate ionic solution.

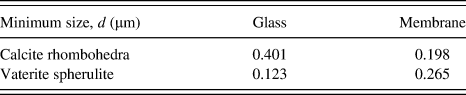
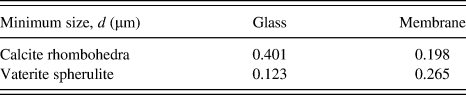
FTIR analysis shows that the glass substrates nucleate predominantly vaterite, while the eggshell membranes induce a larger proportion of calcite, thus we can assume (as is shown in Ref. Reference Andreassen34 and subsequently used in Ref. Reference Gower4) that the spherulitic particles are vaterite and the rhombohedral particles are calcite. Additionally, the numerical proportion of these particles was in agreement with the quantitative proportion suggested by the ratio of the two peaks characteristic of calcite and vaterite in the FTIR spectra of these samples; however, these numbers are very susceptible to variations in the baseline of the spectra. When the ASP solutions are mixed and quickly dried, the precipitate formed is predominantly vaterite. Hence, unsurprisingly when nucleated on a substrate such as glass, where the surface chemistry does not influence mineral nucleation, the predominant calcium carbonate phase formed is vaterite. Additionally, experiments were carried out with just one ASP cycle on each substrate and the samples imaged under SEM looking for the smallest single particles of both calcite crystals and vaterite spheroids. The results in Table I show that when nucleated on glass, vaterite spheroids can form with a much smaller diameter than calcite crystals, and therefore, the free energy of formation of vaterite is lower on the neutral substrate. When nucleated on the eggshell membrane, calcite crystals can form with a slightly smaller diameter than vaterite spheroids and hence changing to eggshell membranes lowers the free energy of formation of calcite. This preferential deposition of calcite on eggshell membrane is attributed to some or all the biological molecules present, which in vivo favor calcite nucleation. Exactly, which factors in the demineralized eggshell membrane result in preferential nucleation of calcite is unclear, but likely candidates include: residual molecules of polyaspartic acid,Reference Wu, Rodriguez, Fink, Carrino, Blackwell, Caplan and Heuer35 sulfate and carboxylate containing molecules within the membrane nodules,Reference Pines, Knopov and Bar36, Reference Addadi, Moradian, Shay, Maroudas and Weiner37 or simply the surface chemistry of collagen,Reference Hunter1 all of which are theorized to preferentially induce calcite nucleation.
The minimum size of calcite and vaterite particles on both glass and membrane substrates after a single cycle of the ASP, with particle sizes measured using ImageJReference Abramoff, Magelhaes and Ram27 on SEM images.
In the presence of water at the temperatures used herein, the metastable vaterite would ordinarily be converted to calcite.Reference Jin, Wang and Yue24 It is hypothesized that the observation here of vaterite is possible due to the samples being dried immediately after the conclusion of the ASP. Drying halts the conversion of vaterite to calcite—it is only metastable in water—effectively freezing the minerals in the morphology in which they were formed.Reference Jin, Wang and Yue24–Reference Manoli and Dalas26 Furthermore, the potential for the observation of more calcite on eggshell membranes to be a result of the longer drying time of a collagenous mesh compared to a smooth glass substrate was examined. Samples prepared on both substrates with otherwise identical process conditions were rinsed in a vaterite conversion inhibitor (ethanol) immediately after finishing the ASP; the proportion of vaterite or calcite particles on either substrate was not altered by this action.
V. CONCLUSIONS
By expansion upon previous work concerning the coprecipitation of a HA–GEL composite,Reference Strange and Oyen20 the codeposition of a CaCO3–GEL composite is demonstrated. These composites are deposited on a variety of substrates, and it is shown that the GEL content of the composite can be quantitatively controlled on the range of 1–10%. A method for determining the organic content of both natural and man-made CaCO3–protein composites is demonstrated using FTIR spectroscopy with calibration curves. This control over the samples’ organic content represents a promising tool for manipulating the composition of synthetically produced biomineralized composites. Additionally, during the deposition of the CaCO3–GEL composite, steady growth of calcite crystals is observed with increasing numbers of cycles. Finally, the mineralization substrate is seen to affect CaCO3polymorphism, an important factor in mimicking many of the advantageous material properties of biominerals.