

The empirical study of the meaning in life (MiL) construct, a central concept in theories of the good life and well-being, has increased in recent decades. Frankl (1961/2014) stated that MiL is the main motivational principle for human beings. He emphasized the role of self-transcendence and productive, experiential, and attitudinal values in the development of a sense of existential fullness as a condition for personal self-realization. MiL is related to the perception and experience of freedom, life satisfaction, responsibility and self-determination, optimism, mental health, and psychological well-being (e.g., Kleftaras & Psarra, Reference Kleftaras and Psarra2012), and it might be a protective factor against depression, hopelessness, self-injury behaviors, and suicide (e.g., Marco, García-Alandete, Pérez, & Botella, Reference Marco, García-Alandete, Pérez and Botella2014). By contrast, a low level of MiL has been related to a perception of lack of control over one’s life, lack of goals and purposes, depression, hopelessness, self-injury, and suicide, among other mental health problems, in a large number of studies (e.g., Kleiman, Adams, Kashdan, & Riskind, Reference Kleiman, Adams, Kashdan and Riskind2013).
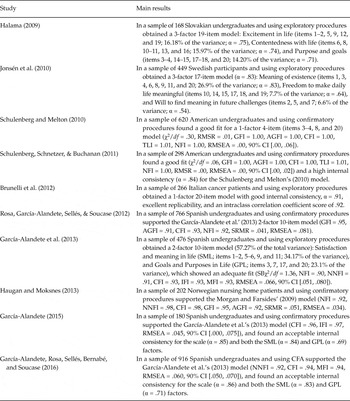
In another vein, in any scientific field it is important to have reliable, valid measurement instruments with a precise and well-established structure. The assessment of MiL is an example of the difficulty in finding valid, reliable scales. The Purpose-In-Life Test (PIL; Crumbaugh & Maholic, 1969), a unifactorial 20-item scale (see the appendix), is one of the most widely used scales for assessing MiL. Several studies have tested the construct validity of the PIL, finding different results (Table 1).
Main results of studies that analysed the factorial structure of the PIL

The reviewed studies used different factor analysis techniques (EFA, PCA, CFA), different sample compositions (undergraduates, nursing home patients, cancer patients), and different PIL models. Therefore, these studies are a source of confusion with regard to establishing the construct validity of the PIL. Moreover, considering that the PIL was devised for clinical purposes (Crumbaugh & Maholic, 1969), it is also relevant that most of these studies used non-clinical samples. This situation suggests the need to carry out a review of the models proposed for the PIL and compare them, in order to identify the best one, and it would quite useful to do this with a clinical sample.
Therefore, the objective of the present study was to analyze the main models for the PIL test using CFA, in order to identify which of them would show an acceptable data-model fit and compare the best ones in a sample of patients with mental disorders. In addition, we analyzed both the means and standard deviations, and we estimated the internal consistency of the model that showed the best fit.
Method
Participants
The sample was recruited from the outpatient unit of three Spanish public mental health services. The inclusion criteria called for patients between 13–70 years old who satisfied the DSM-IV-TR diagnostic criteria for mental disorders (APA, 2000). The exclusion criterion was moderate or severe mental retardation. Participation was voluntary and with no compensation, and informed consent was given by participants.
The final sample comprised 229 Spanish mental disorder patients (195 females, 85.2%, and 34 males, 14.8%) from 13 to 68 years old, M = 34.43, SD = 12.19. The length of time with the mental disorder was 1–35 years, with an average of 12.70 (SD = 7.69). The main diagnoses were Substance Use Disorder, 7%, n = 16 (2 men, 14 women); Major Depressive Disorder, 10.5 %, n = 24 (6 men, 18 women); Anxiety Disorder, 11.8%, n = 27 (5 men, 22 women); Eating Disorder, 54.1%, n = 124 (5 men, 119 women); Borderline Personality Disorder, 5.2%, n = 12 (1 men, 11 women); Body Dysmorphic Disorder, .4%, n = 1 (woman); Schizophrenia, 8.7%, n = 20 (13 men, 7 women); Bipolar Disorder, .4%, n = 1 (woman); Asperger’s Syndrome, .4%, n = 1 (man); Dissociative Disorders, .9%, n = 2 (1 man, 1 woman); and Intermittent Explosive Disorder, .4%, n = 1 (woman).
Assessment and measures
Structured Clinical Interview for DSM-IV Axis I Disorders (SCID I; First, Spitzer, Gibbon, & Williams, Reference First, Spitzer, Gibbon and Williams2002)
This interview is used to obtain the major DSM-IV-TR (APA, 2000) Axis I diagnoses. It offered good psychometric properties, Kappa = .66, demonstrating reliability (Lobbestael, Leurgans, & Arntz, Reference Lobbestael, Leurgans and Arntz2011).
Structured Clinical Interview for DSM-IV Axis II Personality Disorders (SCID II; First, Gibbon, Spitzer, Williams, & Benjamin, Reference First, Gibbon, Spitzer, Williams and Benjamin1997)
This interview is used to obtain DSM-IV-TR (APA, 2000) Axis II Personality Disorder diagnoses. It includes 119 questions and had a Kappa = .74, demonstrating reliability for admitted patients (First et al., Reference First, Gibbon, Spitzer, Williams and Benjamin1997).
Purpose-In-Life Test (PIL; Crumbaugh & Maholic, 1969)
The PIL is a unidimensional, 20-item Likert-type scale with seven response categories (both categories 1 and 7 have specific anchoring phrases, and category 4 indicates neutrality) that offers a measure of MiL. The higher the score, the higher the MiL. Several PIL models, along with the corresponding items and factors in each of them, were compared using the Noblejas (Reference Noblejas1994) Spanish adaptation.
Procedure and statistical analysis
Consecutive sampling was carried out for one year (from January to December 2014). Three individual sessions were conducted. In the first, the consent protocol was presented to the participants and their families, as well as the assessment instruments they had to complete. The diagnosis was established during the second and third sessions, using the SCID-I (First et al., Reference First, Spitzer, Gibbon and Williams2002). The PIL was filled out by patients in a later session under the supervision of therapists, who were instructed about the nature and purpose of the present study. The procedures met the ethical standards of the responsible committee on human experimentation (institutional and national) and the Helsinki Declaration of 1975, as revised in 2013.
The statistical analyses included: (1) CFA of the models analyzed in Schulenberg and Melton (Reference Schulenberg and Melton2010) and the models cited above, using the EQS 16.1 program; and (2) analysis of the mean, median and standard deviation, as well as the estimation of the Cronbach’s alpha of the model that showed the best fit, using the IBM SPSS Statistics 22.0 program. Regarding the CFA, because it was not possible to assume multivariate normality, the Maximum Likelihood method with robust estimation was used. Likewise, following the suggestions of several authors (e.g., Jackson, Gillaspy, & Purc-Stephenson, Reference Jackson, Gillaspy and Purc-Stephenson2009), the following indices were used to evaluate the fit of the models: Satorra-Bentler Chi-square (SBχ2) and p value, Root Mean Square Error of Approximation (RMSEA), Tucker-Lewis Index (TLI), Comparative Fit Index (CFI), Incremental Fit Index (IFI), Normed Chi-square (SBχ2/df), and Consistent Akaike Information Criterion (CAIC). The following criteria were used to reject the models: (1) a score close to, equal to, or greater than .10 on the RMSEA index; (2) a score below .90 on the TLI, CFI, and IFI indices. The criterion used to compare the selected models with an acceptable fit was the score on the CAIC index.
Results
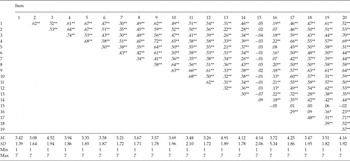
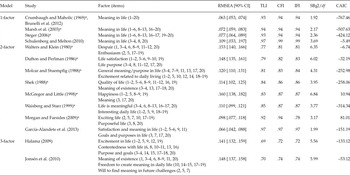
Previous to the CFA, the inter-item correlations of the PIL as well as the mean and standard deviation of the items were calculated (Table 2). Regarding to the confirmatory analyses of the proposed models for the PIL (Table 3), all the 1-factor models obtained a score greater than .90 on the TLI, IFI, and CFI indices. Regarding the RMSEA index, the Crumbaugh and Maholic (1969), Brunelli et al. (Reference Brunelli, Bianchi, Murru, Monformoso, Bosisio, Gangeri and Borreani2012), Marsh, Smith, Piek, and Saunders (Reference Marsh, Smith, Piek and Saunders2003), and Steger (Reference Steger2006) models obtained an acceptable value. The Schulenberg and Melton (Reference Schulenberg and Melton2010) model obtained a score greater than .10, which indicated the absolute inadequacy of the model. Likewise, the RMSEA confidence internal for the Schulenberg and Melton (Reference Schulenberg and Melton2010) model was quite large, indicating a poor estimation of its fit in the population, whereas the confidence interval of the other models was acceptable. Therefore, the Schulenberg and Melton (Reference Schulenberg and Melton2010) model was rejected.
Inter-item correlations and descriptive statistics of the PIL items

* p < .05; **p < .01.
CFA of the main models proposed for the PIL in the clinical sample used in the present study

Note: RMSEA = Root Mean Square Error of Approximation; TLI = Tucker-Lewis Index; CFI = Comparative Fit Index; IFI = Incremental Fit Index; CAIC = Consistent Akaike Information Criterion.
a Analysed in Schulenberg and Melton (Reference Schulenberg and Melton2010).
Regarding the 2-factor models, the Dufton and Perlman (Reference Dufton and Perlman1986), McGregor and Little (Reference McGregor and Little1998), Molcar and Stuempfig (Reference Molcar and Stuempfig1988), Shek (Reference Shek1988), Waisberg and Starr (Reference Waisberg and Starr1999), and Walters and Klein (Reference Walters and Klein1980) models obtained a poor fit, with a RMSEA score greater than .10 and TLI, CFI, and IFI scores lower than .90. The Morgan and Farsides (Reference Morgan and Farsides2009) model obtained a good value on both the TLI and CFI indices, but a poor value on the IFI and RMSEA indices. All these models were rejected. Only the García-Alandete, Rosa Martínez, and Sellés Nohales (2013) model obtained a good score on the overall indices and an acceptable RMSEA confidence interval. Finally, none of the 3-factor models (Halama, Reference Halama2009; Jonsén et al., Reference Jonsén, Fagerström, Lundman, Nygren, Vähäkangas and Strandberg2010) obtained an acceptable fit, with scores lower than .80 on the TLI, CFI, and IFI indices and a RMSEA score greater than .10.
In summary, only the Crumbaugh and Maholic (1969), Brunelli et al. (Reference Brunelli, Bianchi, Murru, Monformoso, Bosisio, Gangeri and Borreani2012), Steger (Reference Steger2006), and Marsh et al. (Reference Marsh, Smith, Piek and Saunders2003) 1-factor models, and the García-Alandete et al. (Reference García-Alandete, Rosa Martínez and Sellés Nohales2013) 2-factor model showed an acceptable overall fit and were accepted. The Crumbaugh and Maholic (1969) and Brunelli et al. (Reference Brunelli, Bianchi, Murru, Monformoso, Bosisio, Gangeri and Borreani2012) models showed the best RMSEA score, followed by the García-Alandete et al. (Reference García-Alandete, Rosa Martínez and Sellés Nohales2013), Marsh et al. (Reference Marsh, Smith, Piek and Saunders2003), and Steger (Reference Steger2006) models. Regarding the LTI, CFI, and IFI indices, the García-Alandete et al. (Reference García-Alandete, Rosa Martínez and Sellés Nohales2013) model obtained the best scores, followed by Marsh et al. (Reference Marsh, Smith, Piek and Saunders2003) and the Crumbaugh and Maholic (1969), Brunelli et al. (Reference Brunelli, Bianchi, Murru, Monformoso, Bosisio, Gangeri and Borreani2012), and Steger (Reference Steger2006) models (with the same values on all three indices).
Comparison of the accepted models based on the parsimony indices
The comparison of the accepted models was performed based on the SBχ2/df and CAIC parsimony indices. Regarding the SBχ2/df ratio, the lowest values were found for the Crumbaugh and Maholic (1969) and Brunelli et al. (Reference Brunelli, Bianchi, Murru, Monformoso, Bosisio, Gangeri and Borreani2012) models, followed by the García-Alandete et al. (Reference García-Alandete, Rosa Martínez and Sellés Nohales2013), Marsh et al. (Reference Marsh, Smith, Piek and Saunders2003), and Steger (Reference Steger2006) models. In the case of the CAIC index, the lowest scores were obtained by the Crumbaugh and Maholic (1969) and Brunelli et al. (Reference Brunelli, Bianchi, Murru, Monformoso, Bosisio, Gangeri and Borreani2012) models, followed by the Marsh et al. (Reference Marsh, Smith, Piek and Saunders2003), Steger (Reference Steger2006), and García-Alandete et al. (Reference García-Alandete, Rosa Martínez and Sellés Nohales2013) models. In summary, based on the parsimony indices, the best models were Crumbaugh and Maholic’s (1969) and Brunelli et al.’s (2012), followed by the García-Alandete et al. (Reference García-Alandete, Rosa Martínez and Sellés Nohales2013), Marsh et al. (Reference Marsh, Smith, Piek and Saunders2003), and Steger (Reference Steger2006) models. Both the Crumbaugh and Maholic (1969) and Brunelli et al. (Reference Brunelli, Bianchi, Murru, Monformoso, Bosisio, Gangeri and Borreani2012) models use a 20-item unidimensional scale (that is, the original structure of the PIL). The descriptive statistics and reliability of this scale were M = 77.10, Mdn = 77, SD = 25.49, and α = .90, respectively.
Discussion
The aim of this study was to use CFA to compare the fit of the main models proposed for the Purpose-In-Life Test (PIL; Crumbaugh & Maholic, 1969), a scale that assesses the achievement of MiL. The criteria for selecting the model with the best fit were rigorous, and bringing together the main models analyzed in previous studies makes a valuable contribution. The present study provides relevant data for considering the psychometric properties of the PIL, prior to its use and interpretation, and it might stimulate future empirical and theoretical studies about the PIL and, by extension, MiL.
As noted above, there are several models for the PIL. The diversity among these models, which differ in the number of dimensions and total number of items, and include the same items in different dimensions, might be due to sample diversity (undergraduates, substance abusers, cancer patients, mental disorder patients) and to the statistical analyses used (EFA or PCA using different extraction and rotation methods, CFA). Most of the revised studies used samples composed of undergraduates.
Findings showed that: (1) among the 1-factor models (Brunelli et al., Reference Brunelli, Bianchi, Murru, Monformoso, Bosisio, Gangeri and Borreani2012; Crumbaugh & Maholic 1969), the 20-item unidimensional scale showed the best fit, based on the overall fit indices; (2) among the 2-factor models, only the García-Alandete et al. (Reference García-Alandete, Rosa Martínez and Sellés Nohales2013) model obtained an adequate fit; and (3) none of the 3-factor models (Halama, Reference Halama2009; Jonsén et al., Reference Jonsén, Fagerström, Lundman, Nygren, Vähäkangas and Strandberg2010) showed an adequate fit. A statistical result not usually used in CFA is the range of the RMSEA confidence interval (CI); a large CI does not make it possible to determine the precision of the discrepancy estimation, and so we can conclude that it is not possible to determine the fit in the population with precision; however, a narrow CI implies good precision in the RMSEA estimation and, therefore, good precision in the estimation of the model fit with respect to the population. In this regard, the 20-item unidimensional model showed a narrow CI (21 points); in addition, its upper score was .074 (lower than the maximum score to accept the model, .080). The CAIC index showed that the 20-item unidimensional scale was the most parsimonious model; therefore, it was accepted as the best model for the PIL.
In the present study, a sample of patients with mental disorders was used. The adequate fit of the original version of the PIL (Crumbaugh & Maholic, 1969) in these clinical participants may provide evidence of its construct validity. As noted above, this scale includes a broad spectrum of constructs, and it might be clinically relevant. However, the major limitation of the present study is probably related to the sample composition, which is heavily biased towards persons with eating disorders, although there were other diagnoses, ranging from personality disorder to mood disorder and psychotic disorder. An important question is whether the MiL construct is equally expressed in these various disorders, or whether the PIL actually measures the same construct in all of them. This is a major limitation with regard to the interpretability of the results, and it requires further study. Likewise, although we used the TLI, CFI, and IFI indices, which are relatively unaffected by sample size (Hu & Bentler, Reference Hu, Bentler and Hoyle1995), the most important limitation of the present study was that the different groups of patients with mental disorders had different sizes; in fact, some groups included only one subject. In future studies, it would be important to use samples with balanced group sizes.
Furthermore, the PIL is probably highly sensitive to different populations. One possible explanation might be the content of several items that can be important for special populations. For example, item 7 (activity after retirement; excluded in Marsh et al., Reference Marsh, Smith, Piek and Saunders2003, and in Steger, Reference Steger2006), item 14 (freedom in making decisions; excluded in Marsh et al., Reference Marsh, Smith, Piek and Saunders2003, in Steger Reference Steger2006, and in García-Alandete et al., Reference García-Alandete, Rosa Martínez and Sellés Nohales2013), item 15 (being prepared for death; excluded in Marsh et al., Reference Marsh, Smith, Piek and Saunders2003, in Steger, Reference Steger2006, and in García-Alandete et al., Reference García-Alandete, Rosa Martínez and Sellés Nohales2013), item 16 (suicidal thoughts; excluded in García-Alandete et al., Reference García-Alandete, Rosa Martínez and Sellés Nohales2013), and item 18 (life internally/externally determined; excluded in Steger, Reference Steger2006, and in García-Alandete et al., Reference García-Alandete, Rosa Martínez and Sellés Nohales2013), which were included in the Crumbaugh and Maholic (1969) and Brunelli et al. (Reference Brunelli, Bianchi, Murru, Monformoso, Bosisio, Gangeri and Borreani2012) models (that is, the original PIL), might be important to mental disorder patients, terminal cancer patients, people suffering from chronic pain or severe physical disability, substance abusers, and elderly people, among others. Crumbaugh and Maholic (1969) used a sample that included three clinical groups (and 2 non-clinical samples), Marsh et al. (Reference Marsh, Smith, Piek and Saunders2003) used a sample of social drinkers and drinkers in alcohol treatment, and Brunelli et al. (Reference Brunelli, Bianchi, Murru, Monformoso, Bosisio, Gangeri and Borreani2012) used a sample composed of cancer patients, but none of the other reviewed studies that analyzed the construct validity of the PIL with CFA used a sample composed of mental disorder patients. It is very important to take this into account because the PIL was mainly constructed to assess the presence vs. lack of MiL (Frankl, 1961/2014).
It might be important to analyze the differences in MiL across different mental disorders, and their specific responses to the inclusion of MiL in therapy, as well as analyzing the importance of including MiL in therapy for mental disorders, such as cognitive-behavior therapy or dialectical behavior therapy, in order to enhance its effectiveness (e.g., Ameli & D’attilio, 2013). MiL might enhance the therapeutic process by focusing on personal positive functioning and strengths, preventing or buffering the risk of self-destructive behaviors, such as substance abuse, non-suicidal self-injuries, or thoughts of death and suicide (Kleiman et al., Reference Kleiman, Adams, Kashdan and Riskind2013; Marco et al., Reference Marco, García-Alandete, Pérez and Botella2014). In this regard, meaning-centered therapy might provide both theoretical and practical resources (Wong, Reference Wong and Wong2012).
The relationship between MiL and several mental disorders is a promising research field because it points to the moderator role of MiL between depression and hopelessness and suicidal thoughts and behaviors. Therefore, it is quite important to use scales with good psychometric characteristics. The results obtained in the present study represent an advance in determining the construct validity of the PIL, and they improve the possibilities of using this scale in populations with mental disorders, in order to assess MiL and introduce it in the therapeutic process. However, based on this psychometric study and earlier ones, the PIL fails to have robust construct validity across multiple cultures and samples. Therefore, clinicians should be very wary of PIL’s interpretability with varying groups of clinical respondents. In short, our results and the previous literature, as well as cross validation studies, support the conclusion that the PIL’s construct validity remains equivocal and the current investigation provides further evidence.
Appendix
The Purpose In Life Test