







1. Introduction
The dynamical systems view of turbulence (Hopf Reference Hopf1948; Eckhardt et al. Reference Eckhardt, Faisst, Schmiegel and Schumacher2002; Kerswell Reference Kerswell2005; Eckhardt et al. Reference Eckhardt, Schneider, Hof and Westerweel2007; Gibson, Halcrow & Cvitanovic Reference Gibson, Halcrow and Cvitanovic2008; Cvitanovic & Gibson Reference Cvitanovic and Gibson2010; Kawahara, Uhlmann & van Veen Reference Kawahara, Uhlmann and van Veen2012; Suri et al. Reference Suri, Kageorge, Grigoriev and Schatz2020; Graham & Floryan Reference Graham and Floryan2021; Crowley et al. Reference Crowley, Pughe-Sanford, Toler, Krygier, Grigoriev and Schatz2022) has revolutionised our understanding of transitional and weakly turbulent shear flows. In this perspective, a realisation of a turbulent flow is considered as a trajectory in a very high-dimensional dynamical system, in which unstable periodic orbits (UPOs) and their stable and unstable manifolds serve as a skeleton for the chaotic dynamics (Hopf Reference Hopf1948; Cvitanović et al. Reference Cvitanović, Artuso, Mainieri, Tanner and Vattay2016). However, progress with these ideas in multiscale turbulence at high Reynolds numbers ( $Re$) has been slower, which can be largely attributed to the challenge of finding suitable starting guesses for UPOs to input in a Newton–Raphson solver (Kawahara & Kida Reference Kawahara and Kida2001; Viswanath Reference Viswanath2007; Cvitanovic & Gibson Reference Cvitanovic and Gibson2010; Chandler & Kerswell Reference Chandler and Kerswell2013). As such, it is unknown whether a reduced representation of a high-
 $Re$ flow in terms of UPOs is possible, and how rapidly the number of such solutions grows as
 $Re$ increases. In this work, we outline a methodology based on learned embeddings in deep convolutional autoencoders that can both (i) map out the structure/population of solutions in state space at a given
 $Re$ and (ii) generate effective guesses for UPOs that describe the high dissipation bursting dynamics.
Since the first discovery of a UPO in a (transiently) turbulent Couette flow by Kawahara & Kida (Reference Kawahara and Kida2001) there has been a flurry of interest and the convergence of many more UPOs in the same configuration (Viswanath Reference Viswanath2007; Cvitanovic & Gibson Reference Cvitanovic and Gibson2010; Page & Kerswell Reference Page and Kerswell2020) and other simple geometries including two- and three-dimensional Kolmogorov flow (Chandler & Kerswell Reference Chandler and Kerswell2013; Yalnız, Hof & Budanur Reference Yalnız, Hof and Budanur2021), pipe flow (Willis, Cvitanovic & Avila Reference Willis, Cvitanovic and Avila2013; Budanur et al. Reference Budanur, Short, Farazmand, Willis and Cvitanović2017), planar channels (Zammert & Eckhardt Reference Zammert and Eckhardt2014; Hwang, Willis & Cossu Reference Hwang, Willis and Cossu2016) and Taylor–Couette flow (Krygier, Pughe-Sanford & Grigoriev Reference Krygier, Pughe-Sanford and Grigoriev2021; Crowley et al. Reference Crowley, Pughe-Sanford, Toler, Krygier, Grigoriev and Schatz2022). Individual UPOs isolate a closed cycle of dynamical events which are also observed transiently in the full turbulence (Wang, Gibson & Waleffe Reference Wang, Gibson and Waleffe2007; Hall & Sherwin Reference Hall and Sherwin2010), although all solutions found to date have a much narrower range of scales than the full turbulence itself, e.g. domain-filling vortices and streaks (Kawahara & Kida Reference Kawahara and Kida2001), spatially isolated structures (Gibson & Brand Reference Gibson and Brand2014) or attached eddies in unbounded shear (Doohan, Willis & Hwang Reference Doohan, Willis and Hwang2019). Recent work has identified families of equilibria and travelling waves which become increasingly localised as  $Re$ is increased, some of which are reminiscent of structures observed instantaneously in fully turbulent flows (Deguchi Reference Deguchi2015; Eckhardt & Zammert Reference Eckhardt and Zammert2018; Yang, Willis & Hwang Reference Yang, Willis and Hwang2019; Azimi & Schneider Reference Azimi and Schneider2020).
The most popular method for computing periodic orbits, termed ‘recurrent flow analysis’, relies on a turbulent orbit shadowing a UPO for at least a full cycle, with the near-recurrence, measured with an  $L_2$ norm, identifying a guess for both the velocity field and period of the solution (Viswanath Reference Viswanath2007; Cvitanovic & Gibson Reference Cvitanovic and Gibson2010; Chandler & Kerswell Reference Chandler and Kerswell2013). This inherently restricts the approach to lower
 $Re$, as the shadowing becomes increasingly unlikely as the Reynolds number is increased due to the increased instability of the UPOs, although in two dimensions the effect may not be uniform as
 $Re$ is increased due to connection to weakly unstable solutions of the Euler equation in the limit
 $Re\to \infty$ (Zhigunov & Grigoriev Reference Zhigunov and Grigoriev2023). Furthermore, measuring near-recurrence with an Euclidean norm is unlikely to be a suitable choice for a distance metric on the solution manifold, unless the near-recurrence is very close (Page, Brenner & Kerswell Reference Page, Brenner and Kerswell2021). More recent methods have sought to remove the reliance on near-recurrence, for example by using dynamic mode decomposition (Schmid Reference Schmid2010) to identify the signature of nearby periodic solutions (Page & Kerswell Reference Page and Kerswell2020; Marensi et al. Reference Marensi, Yalnız, Hof and Budanur2023), or by using variational methods that start with a closed loop as an initial guess (Lan & Cvitanovic Reference Lan and Cvitanovic2004; Parker & Schneider Reference Parker and Schneider2022).
Periodic orbit theory has rigorously established how the statistics of UPOs can be combined to make statistical predictions for chaotic attractors in uniformly hyperbolic systems (Artuso, Aurell & Cvitanovic Reference Artuso, Aurell and Cvitanovic1990a,Reference Artuso, Aurell and Cvitanovicb). The hope in turbulent flows is that a similar approach may be effective even with an incomplete set of UPOs. For instance, see the statistical reconstructions in Page et al. (Reference Page, Norgaard, Brenner and Kerswell2024) or the Markovian models of weak turbulence in Yalnız et al. (Reference Yalnız, Hof and Budanur2021); recent work in the Lorenz equations indicates that it is possible to learn ‘better’ weights than periodic orbit theory using data-driven techniques when only a small number of solutions are available (Pughe-Sanford et al. Reference Pughe-Sanford, Quinn, Balabanski and Grigoriev2023). These types of approach are attractive because they allow one to unambiguously weigh individual dynamical processes in their contribution to the long-time statistics of the flow. However, the ability to apply these ideas at high- $Re$ is currently limited by the search methods described previously, while extrapolating results at low
 $Re$ upwards is challenging because of the emergence of new solutions in saddle-node bifurcations, the turning-back of solution branches and the fact that solutions that can be continued upwards in
 $Re$ may leave the attractor (e.g. Gibson et al. Reference Gibson, Halcrow and Cvitanovic2008; Chandler & Kerswell Reference Chandler and Kerswell2013).
The challenge of extending the dynamical systems approach to high  $Re$, at least in classical time-stepping-based approaches, also involves a computational element associated with both the increased spatial/temporal resolution requirements and the slowdown of the ‘GMRES’ aspect of the Newton algorithm used to perform an approximate inverse of the Jacobian (van Veen et al. Reference van Veen, Vela-Martın, Kawahara and Yasuda2019); note, however, that Zhigunov & Grigoriev (Reference Zhigunov and Grigoriev2023) were able to successfully converge a number of exact solutions of the Euler equation with a regularising hyperviscosity. Modern data-driven and machine-learning techniques can play a role here, for instance by reducing underlying resolution requirements through learned derivative stencils (Kochkov et al. Reference Kochkov, Smith, Alieva, Wang, Brenner and Hoyer2021), or by building effective low-order models of the flow (see, e.g. the overview in Brunton, Noack & Koumoutsakos Reference Brunton, Noack and Koumoutsakos2020). In dynamical systems, neural networks have been highly effective in estimating attractor dimensions (Linot & Graham Reference Linot and Graham2020) and more recently in building low-order models of weakly turbulent flows (De Jesús Reference De Jesús and Graham2023; Linot & Graham Reference Linot and Graham2023). More recent network architectures have shown great promise as simulation tools with the surprising ability to work well when deployed in parts of the state space which were unseen in training (Kim et al. Reference Kim, Lu, Nozari, Pappas and Bassett2021; Röhm, Gauthier & Fischer Reference Röhm, Gauthier and Fischer2021), presumably because they have learnt a latent representation of the governing equations. One aspect of the model reduction considered in Linot & Graham (Reference Linot and Graham2023) that is particularly promising is that the low-order model (a ‘neural’ system of differential equations) was used to find periodic orbits that corresponded to true UPOs of the Navier–Stokes equation. However, all of these studies have only been performed at modest
 $Re$ or in other simpler partial differential equations (PDEs). Our focus here is on using learned low-dimensional representations to examine the impact of increasing
 $Re$ on the flow dynamics.
In previous work (Page et al. Reference Page, Brenner and Kerswell2021, hereafter PBK21), we used a deep convolutional neural network architecture to examine the state space of a two-dimensional turbulent Kolmogorov flow (monochromatically forced on the 2-torus) in a weakly turbulent regime at  $Re=40$. By exploiting a continuous symmetry in the flow we performed a ‘latent Fourier analysis’ of the embeddings of vorticity fields, demonstrating that the network built a representation around a set of spatially periodic patterns which strongly resembled known (and unknown) unstable equilibria and travelling wave solutions. In this paper, we consider the same flow but use a more advanced architecture to construct low-order models over a wide range of
 $40 \leq Re \leq 400$. Latent Fourier analysis provides great insight into the changing structure of the state space as
 $Re$ increases, by, for example, showing how high-dissipation bursts merge with the low-dissipation dynamics beyond the weakly chaotic flow at
 $Re=40$. It also allows us to isolate
 $O(150)$ new UPOs associated with high-dissipation events that have not been found by any previous approach.
Two-dimensional turbulence is a computationally attractive testing ground for these ideas because of the reduced computational requirements and the ability to apply state-of-the-art neural network architectures which have been built with image classification in mind (LeCun, Bengio & Hinton Reference LeCun, Bengio and Hinton2015; Huang et al. Reference Huang, Liu, van der Maaten and Weinberger2017). Kolmogorov flow itself has been widely studied with very large numbers of simple invariant solutions documented in the literature (Chandler & Kerswell Reference Chandler and Kerswell2013; Lucas & Kerswell Reference Lucas and Kerswell2014, Reference Lucas and Kerswell2015; Farazmand Reference Farazmand2016; Parker & Schneider Reference Parker and Schneider2022), although the phenomenology in two dimensions is distinct from three-dimensional wall-bounded flows discussed previously due to the absence of a dissipative anomaly and the inverse cascade of energy to large scales (Onsager Reference Onsager1949; Kraichnan Reference Kraichnan1967; Leith Reference Leith1968; Batchelor Reference Batchelor1969; Kraichnan & Montgomery Reference Kraichnan and Montgomery1980; Boffetta & Ecke Reference Boffetta and Ecke2012). There is the intriguing possibility that UPOs at high- $Re$ in this flow actually connect to (unforced) solutions of the Euler equation (Zhigunov & Grigoriev Reference Zhigunov and Grigoriev2023), and we are able to use our embeddings to explore this effect here by designing a UPO-search strategy for structures with particular streamwise scales. Our analysis highlights the role of small-scale dynamical events in high-dissipation dynamics, and also suggests that the UPOs needed to describe turbulence at high
 $Re$ may need to be combined in space as well as time, a viewpoint which is consistent with idea of a ‘spatiotemporal’ tiling advocated by Gudorf & Cvitanovic (Reference Gudorf and Cvitanovic2019) and Gudorf (Reference Gudorf2020).
The remainder of the manuscript is structured as follows: In § 2 we describe the flow configuration and datasets at the various  $Re$, along with a summary of vortex statistics under increasing
 $Re$. We also outline a new architecture and training procedure that can accurately represent high dissipation events in all the flows considered. In § 3 we perform a latent Fourier analysis for three values of
 $Re$, generating low-dimensional visualisations of the state space to examine the changing role of large-scale patterns and the emergence of the condensate. Section 4 summarises our UPO search, where we perform a modified recurrent flow analysis at
 $Re=40$ before using the latent Fourier modes themselves to find large numbers of new high-dissipation UPOs. Finally, conclusions are provided in § 5.
2. Flow configuration and neural networks
2.1. Kolmogorov flow
We consider two-dimensional flow on the surface of a 2-torus, driven by a monochromatic body force in the streamwise direction (‘Kolmogorov’ flow). The out-of-plane vorticity satisfies
 \begin{equation} \partial_t \omega + \boldsymbol u \boldsymbol{\cdot} \boldsymbol{\nabla} \omega = \frac{1}{Re} \Delta \omega - n\cos ny, \end{equation}
where  $\omega = \partial _x v - \partial _y u$, with
 $\boldsymbol u = (u, v)$. In (2.1) we have used the amplitude of the forcing from the momentum equation,
 $\chi$, and the fundamental vertical wavenumber of the box,
 $k= 2{\rm \pi} / L_y$, to define a length scale,
 $k^{-1}$, and timescale,
 $\sqrt {1/(k \chi )}$, so that
 $Re:=\sqrt {\chi }k^{-3/2}/\nu$. Throughout we set
 $L_x = L_y$ and the forcing wavenumber
 $n=4$ as in previous work (Chandler & Kerswell Reference Chandler and Kerswell2013, PBK21).
Equation (2.1) is equivariant under continuous shifts in the streamwise direction,  $\mathscr T_s: \omega (x,y) \to \omega (x+s,y)$, under shift-reflects by a half-wavelength in
 $y$,
 $\mathscr S: \omega (x, y) \to -\omega (-x, y+{\rm \pi} /4)$ and under a rotation by
 ${\rm \pi}$,
 $\mathscr R: \omega (x,y) \to \omega (-x,-y)$. In contrast with other recent studies (Linot & Graham Reference Linot and Graham2020; De Jesús Reference De Jesús and Graham2023), which pre-process data by pulling back continuous symmetries using the method of slices (Budanur et al. Reference Budanur, Cvitanović, Davidchack and Siminos2015, Reference Budanur, Short, Farazmand, Willis and Cvitanović2017), we explicitly do not perform symmetry reduction. Our neural networks, described fully later in this section and in Appendix A, are all fully convolutional without fully connected layers: they are invariant under translations (albeit discrete translations set by the spatial resolution) hence the training will be unaffected by the application of pullback to the data.
We consider a range of Reynolds numbers,  $Re\in \{40, 80, 100, 400\}$. For the majority of this paper we will focus only on
 $Re\in \{40, 100, 400\}$, with the
 $Re=80$ results included only to verify trends in the autoencoder performance. Our training and test datasets are generated with the open-source, fully differentiable flow solver JAX-CFD (Kochkov et al. Reference Kochkov, Smith, Alieva, Wang, Brenner and Hoyer2021). The workflow for converging UPOs was refined during the course of the project: we primarily converge periodic orbits in the spectral version of JAX-CFD (Dresdner et al. Reference Dresdner, Kochkov, Norgaard, Zepeda-Núñez, Smith, Brenner and Hoyer2023), though some results at
 $Re=40$ were obtained with an in-house spectral code (Chandler & Kerswell Reference Chandler and Kerswell2013; Lucas & Kerswell Reference Lucas and Kerswell2014). Resolution requirements were adjusted based on the specific
 $Re$ considered, ranging from
 $256^2$ at
 $Re=40$ (in the finite-difference version of JAX-CFD) to
 $1024^2$ at
 $Re=400$. Lower resolutions (by a factor of two) were used in the spectral solvers when converging UPOs. We downsampled our higher
 $Re$ training and test data to a resolution of
 $128^2$ for consistent input to the neural networks. Note that previous work has demonstrated the adequacy of a
 $128^2$ resolution in a spectral solver as high as
 $Re=100$ (see Chandler & Kerswell Reference Chandler and Kerswell2013; Lucas & Kerswell Reference Lucas and Kerswell2015), hence downsampling will not be an issue for most
 $Re$ considered. The truncation at
 $Re=400$ retains around nine decades in the time-averaged enstrophy spectrum (not shown) hence results in a loss of resolution of small-scale vortical structures of amplitude
 ${\lesssim } 10^{-4}$. This does not affect the performance of the autoencoder, which we will show to be equally effective at high dissipation when more small-scale structure is present.
At each  $Re \in \{40, 80, 100\}$ we generated a training dataset by initialising
 $1000$ trajectories from random initial conditions, discarding an initial transient before saving
 $100$ snapshots from each, with snapshots separated by an advective time unit (in dimensional variables this corresponds to
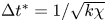 $\Delta t^* = 1/\sqrt {k \chi }$). When training the neural networks we applied a random symmetry transform to each of the
 $N = 10^5$ snapshots
 \begin{equation} \omega \to \mathscr T^{\alpha}\mathscr S^m \mathscr R^q \omega, \quad \text{with} \ \alpha \in [0, 2{\rm \pi}), \ m \in \{0, 1,\ldots,7\} \ \text{and} \ q \in \{0,1\} \end{equation}
each time we looped through the dataset. This data augmentation was included for historical reasons from previous architectural iterations which featured fully connected layers. As a result of the purely convolutional nature of the network, some of the symmetry operations are likely redundant: the network is essentially equivariant under translations in  $x$ and
 $y$ by design (approximately if the shifts are not integer numbers of grid points). However, convolutions are not invariant under the reflect or rotation operations, hence data augmentation is beneficial there. Note that the data augmentation is applied randomly as batches of snapshots are fed into the optimiser and we do not generate copies of the original dataset. Test datasets of the same size were also generated in the same manner. For the highest
 $Re=400$, our training dataset was smaller and formed of
 $700$ trajectories and our test dataset at
 $Re=400$ consisted of
 $200$ trajectories. In training (network architecture discussed in detail below) we reserved
 $10\,\%$ of the training data as a ‘validation’ set which is not used to update the model parameters. The performance of the model is recorded on the validation set as the model is trained as a method of determining whether overfitting occurs. This can be detected should the loss evaluated on the validation set depart significantly from that reported on the training data (Bishop Reference Bishop2006).
The dynamical regimes considered in this paper range from a weakly chaotic flow at  $Re=40$ to the formation of a pair of large-scale vortices that dominate the flow, the ‘condensate’ (Onsager Reference Onsager1949; Smith & Yakhot Reference Smith and Yakhot1993), at
 $Re=400$. These qualitative differences in the flow are explored in figure 1 where we report snapshots at
 $Re\in \{40, 100, 400\}$ (
 $Re=80$ is largely indistinguishable from
 $Re=100$) along with some statistical analysis of the vortical structures present in the flow. The vortex statistics shown here are computed by first computing the root-mean-square vorticity fluctuations
 $\omega _{{RMS}} := \sqrt {\langle (\omega (\boldsymbol x, t) - \bar {\omega } (y))^2\rangle }$, where
 $\overline {\bullet }$ is a time, (‘horizontal’)
 $x$ and ensemble average and
 $\langle \bullet \rangle :=\int ^{2{\rm \pi} }_0 \overline {\bullet } \,{{\rm d}\kern 0.05em y}/2{\rm \pi}$ is fully spatially averaged. We then extract spatially localised ‘vortices’ as connected regions where
 $|\omega (\boldsymbol x, t) - \langle \omega \rangle | \geq 2\omega _{{RMS}}$.
Vorticity snapshots and statistics for  $Re=40$,
 $100$ and
 $400$. Results at
 $Re=80$ are qualitatively very similar to those at
 $Re=100$ and are not shown. Top three rows show snapshots from within the test dataset at
 $Re=40$ (top; maximum contour levels
 $\pm 8$),
 $Re=100$ (centre; maximum contour levels
 $\pm 10$) and
 $Re=400$ (bottom; maximum contour levels
 $\pm 20$). Black/white lines indicate connected regions (‘vortices’ discussed in the text) where
 $|\omega (\boldsymbol x, t) - \langle \omega \rangle | \geq 2\omega _{{RMS}}$. Bottom row summarises the vortex statistics in the test datasets at
 $Re=40$ (black),
 $100$ (red) and
 $400$ (blue), from left to right showing PDFs of numbers of vortices
 $N_V$ (modal contribution highlighted with the shaded vertical bars), vortex area
 $A_V$ and normalised vortex circulation
 $|\varGamma _V|/\langle |\varGamma _V|\rangle$ (dashed line is
 $\exp (-(2/3) |\varGamma _V| / \langle |\varGamma _V|\rangle )$).
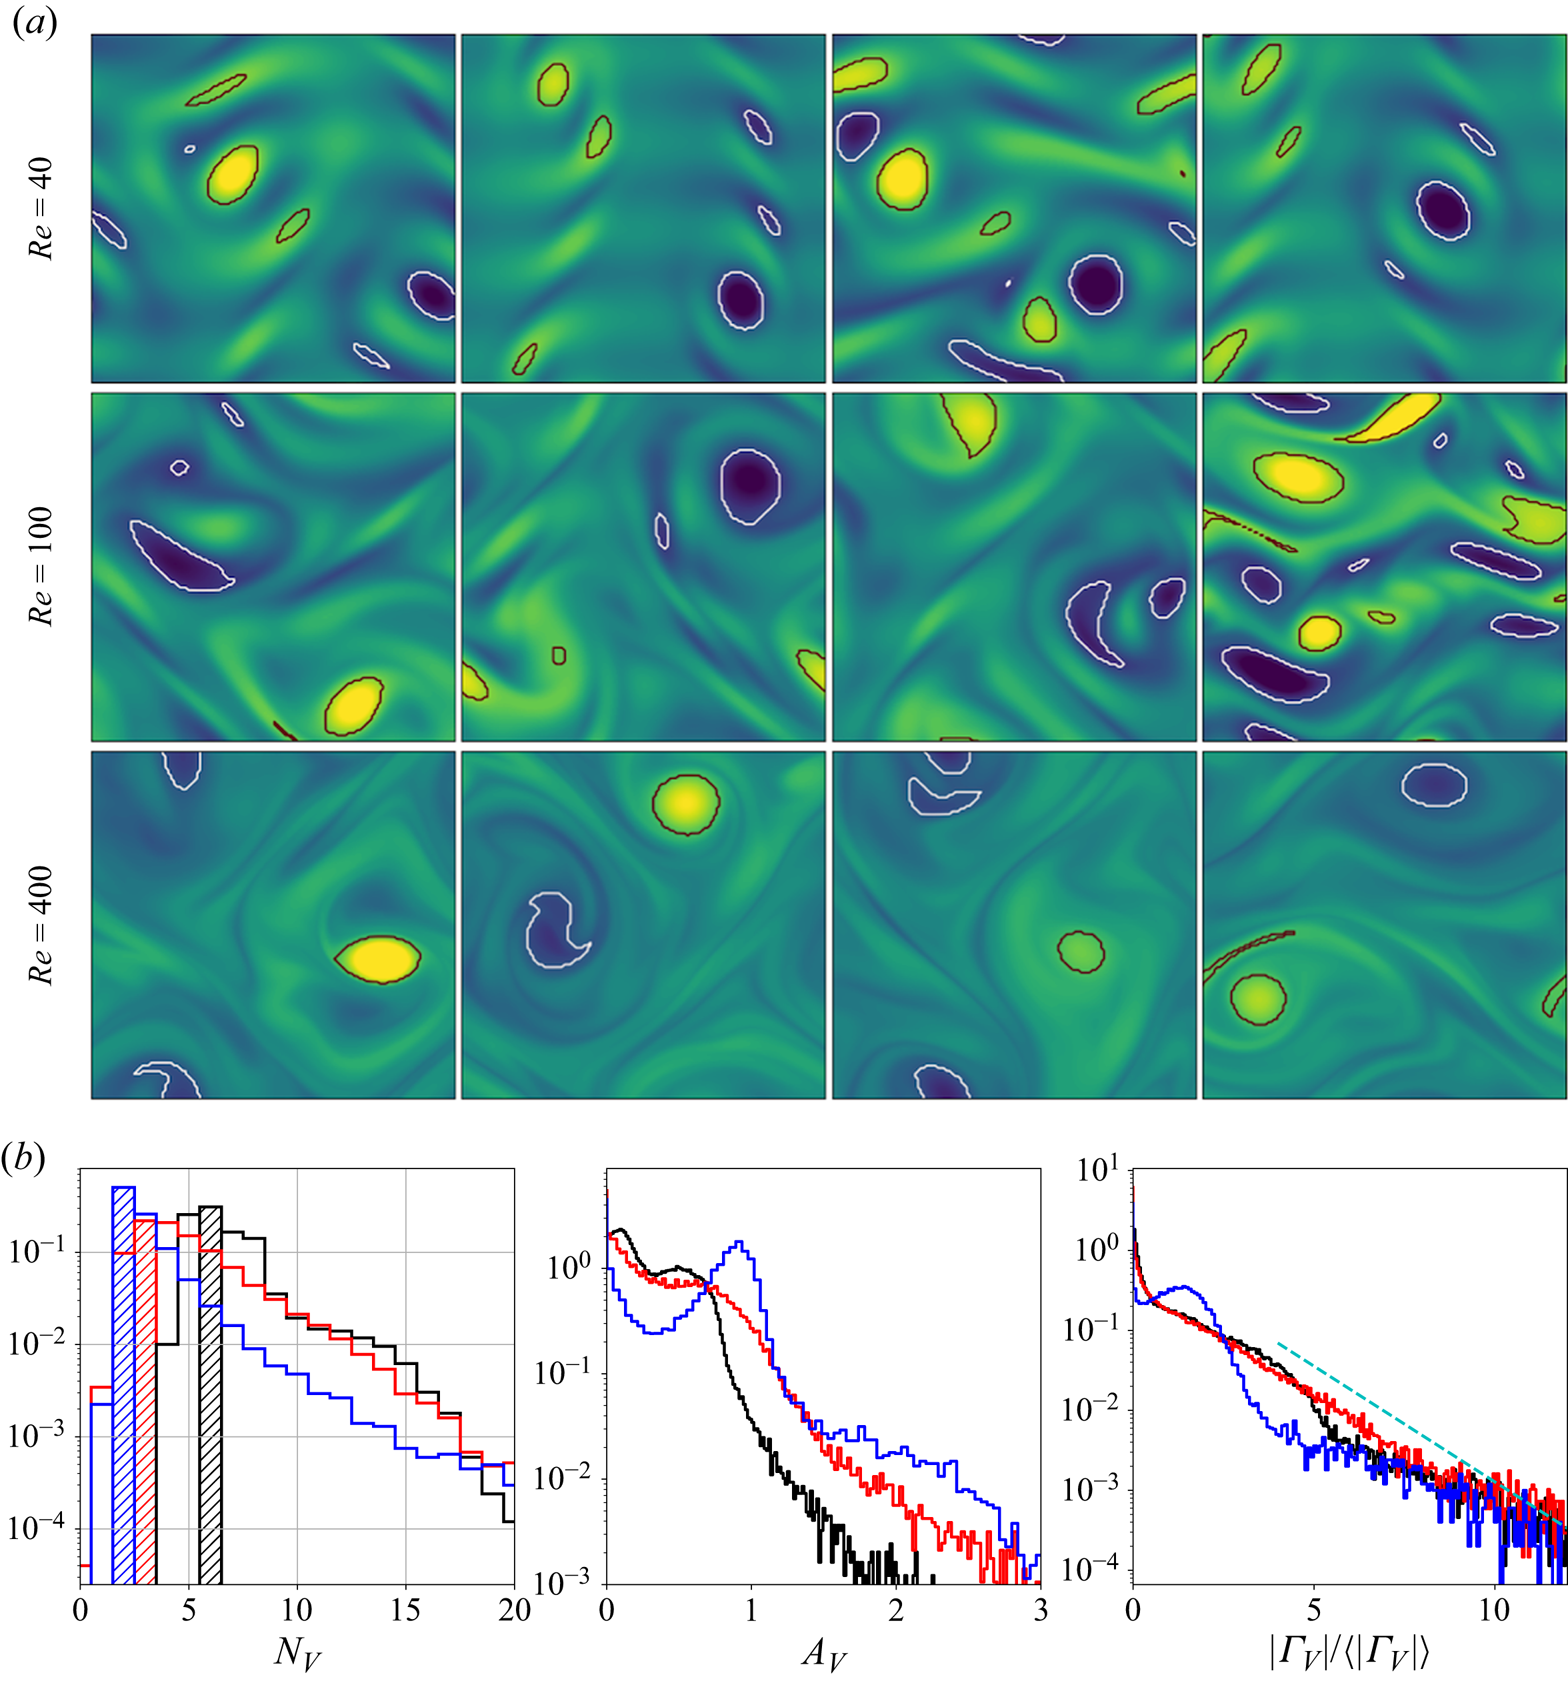
The vortex statistics shown in figure 1 indicate the persistence of a large-scale flow structure at  $Re=400$: at this point the flow spends 50 % of its time in a state where there are a pair of vortices, and often higher numbers of vortices,
 $N_V > 2$, actually indicates a state like that shown in the third and fourth snapshots at
 $Re=400$ where a small-scale region of high shear qualifies as a ‘vortex’ under our selection criteria. These observations are clearly supported by a peak in both the vortex area and circulation probability density functions (PDFs) at
 $Re=400$. In contrast, the statistics at
 $Re=40$ and
 $Re=100$ do not indicate the dominance of a single large-scale coherent state, but instead the vortex statistics are qualitatively similar to those reported in the early stages of decaying two-dimensional turbulence reported by Jiménez (Reference Jiménez2020); see the dashed line in the circulation statistics shown in figure 1.
As observed in earlier studies (Chandler & Kerswell Reference Chandler and Kerswell2013; Farazmand & Sapsis Reference Farazmand and Sapsis2017, PBK21), the ‘turbulence’ at  $Re=40$ is only weakly chaotic and spends much of its time in a state which is qualitatively similar to the first non-trivial structure to bifurcate off the laminar solution at
 $Re \approx 10$, but with intermittent occurrences of more complex high-dissipation structures. In contrast, the dynamics at
 $Re=100$ are much richer and display an interplay between larger-scale structures and small-scale dynamics. The increasing dominance of large-scale structure as
 $Re$ increases can be tied to the emergence of new simple invariant solutions, which can presumably be connected to solutions of the Euler equations as
 $Re\to \infty$ (Zhigunov & Grigoriev Reference Zhigunov and Grigoriev2023). Similarly, the decreasing role of smaller scale vortical events in this limit can be associated with the movement of a set of small-scale UPOs away from the attractor. Our aim is to use learned embeddings within deep autoencoders to explore this process, mapping out the structure of the state space under increasing
 $Re$ and finding the associated UPOs.
2.2. DenseNet autoencoders
We construct low-dimensional representations of Kolmogorov flow by training a family of deep convolutional autoencoders,  $\{\mathscr A_m\}$, which seek to reconstruct their inputs
 \begin{equation} \mathscr A_m (\omega) \equiv [\mathscr D_m \circ \mathscr E_m](\omega) \approx \omega. \end{equation}
The autoencoder takes an input vorticity field and constructs a low-dimensional embedding via an encoder function,  $\mathscr E_m: \mathbb {R}^{N_x\times N_y} \to \mathbb {R}^m$, before a decoder converts the embedding back into a vorticity snapshot,
 $\mathscr D_m: \mathbb {R}^m \to \mathbb {R}^{N_x\times N_y}$. The scalar vorticity is input to the autoencoder as an
 $N_x\times N_y$ ‘image’ with a single channel representing the value of
 $\omega (x,y)$ at the grid points.
The architecture trained in PBK21 performed well at  $Re=40$, but we were unable to obtain satisfactory performance at higher
 $Re$ with the same network. Even the relatively strong performance at
 $Re=40$ in the PBK21 model was skewed towards low-dissipation snapshots, with the performance on the high-dissipation events being substantially weaker. To address this performance issue, we: (i) designed a new architecture with a more complex graph structure and feature map shapes motivated by discrete symmetries in the system; and (ii) trained the network with a modified loss function to encourage a good representation of the rarer, high-dissipation events.
The structure of the new autoencoder is a purely convolutional network, with dimensionality reduction performed via max pooling as in PBK21. However, we use so-called ‘dense blocks’ (Huang et al. Reference Huang, Liu, van der Maaten and Weinberger2017, Reference Huang, Liu, Pleiss, Van Der Maaten and Weinberger2019) in place of single convolutional layers, allowing for increasingly abstract features as the outputs of multiple previous convolutions are concatenated prior to the next convolution operation. Our dense blocks (described fully in Appendix A) are each made up of three individual convolutions, with the output feature maps of each convolution then concatenated with the input. This means that the feature maps at a given scale (before a pooling operation is applied) can be much richer than a single convolution operation. For instance, if the input to a particular dense block is an image with  $K$ channels, and each convolution adds 32 features, then the output of the block is an image with
 $K + 3 \times 32$ channels. For comparison, a standard convolution with 32 filters of size
 $N_x' \times N_y'$ on the same image would be specified by
 $O(32 \times N_x' \times N_y' \times K)$ parameters, whereas the dense block described here requires
 $O(32 \times N_x' \times N_y' \times (96 + 3K))$ parameters due to the repeated concatenation with the upstream input feature maps. We also made other minor modifications to the network that are detailed in Appendix A. At the innermost level, the network represents the input snapshot with a set of
 $M$ feature maps of shape
 $4 \times 8$, where the ‘8’ (corresponding to the physical
 $y$ direction) is fixed by the 8-fold shift-reflect symmetry,
 $\mathscr S^8 \omega \equiv \omega$, in the system. The restriction to purely convolutional layers and the smallest feature map size constrains the dimension of the latent space to be a multiple of 32. Overall our new model is roughly twice as complex as that outlined in PBK21, with
 ${\sim }2.15 \times 10^6$ trainable parameters for the largest models (
 $m=1024$): the increased cost of the dense blocks being offset somewhat by the absence of any fully connected layers. For context, training for 500 epochs on
 $10^5$ vorticity snapshots (see Appendix A) takes roughly 48 h on a single NVIDIA A100 GPU (80 GB memory).
We train the networks to minimise the following loss:
 \begin{equation} \mathscr L := \frac{\gamma}{N}\sum_j \| \mathscr A_m (\omega_j) - \omega_j \|^2 + \frac{(1-\gamma)}{N}\sum_j \| [\mathscr A_m (\omega_j)]^2 - \omega_j^2 \|^2, \end{equation}
over  $500$ epochs (batch size of
 $64$, constant learning rate in an Adam optimiser
 $\eta =5 \times 10^{-4}$, see Kingma & Ba Reference Kingma and Ba2015). An additional term has been added to the standard ‘mean squared error’ in the loss function (2.4). The new term is essentially a mean squared error on the square of the vorticity field: high-dissipation events are associated with large values of the enstrophy
 $\iint \omega ^2 \,{\rm d}^2 \boldsymbol x$, and the new term in (2.4) makes the strongest contribution to the overall loss in these cases, whereas quiescent, low-dissipation snapshots are dominated by the standard mean-squared-error term. The rationale here is to encourage the network to learn a reasonable representation of high-dissipation events, particularly as we increase
 $Re$. Treatment via a modified loss is required as these events make up only a small fraction of the training dataset: a similar effect could perhaps be anticipated if the training data were drawn from a modified distribution skewed to high-dissipation events rather than sampled from the invariant measure. Intriguingly, we found that the addition of this term lead to better overall mean squared error than a network trained to minimise the mean squared error alone. We trained independent networks at
 $Re=40$ with various
 $\gamma$ and found
 $\gamma =1/2$ to be most effective. We fix
 $\gamma$ to this value for all networks and
 $Re$.
The networks were trained by normalising the inputs  $\omega \to \omega / \omega _{{norm}}$, where
 $\omega _{{norm}} = 25$ for
 $Re \in \{40, 80, 100\}$ and
 $\omega _{{norm}} = 60$ for
 $Re=400$. For a consistent analysis of the performance across the architectures and
 $Re$, we do not report the loss (2.4) directly, but instead compute the relative error for each snapshot
 \begin{equation} \varepsilon_j := \frac{\| \omega_j - \mathscr A_m(\omega_j) \|}{\| \omega_j \|}, \end{equation}
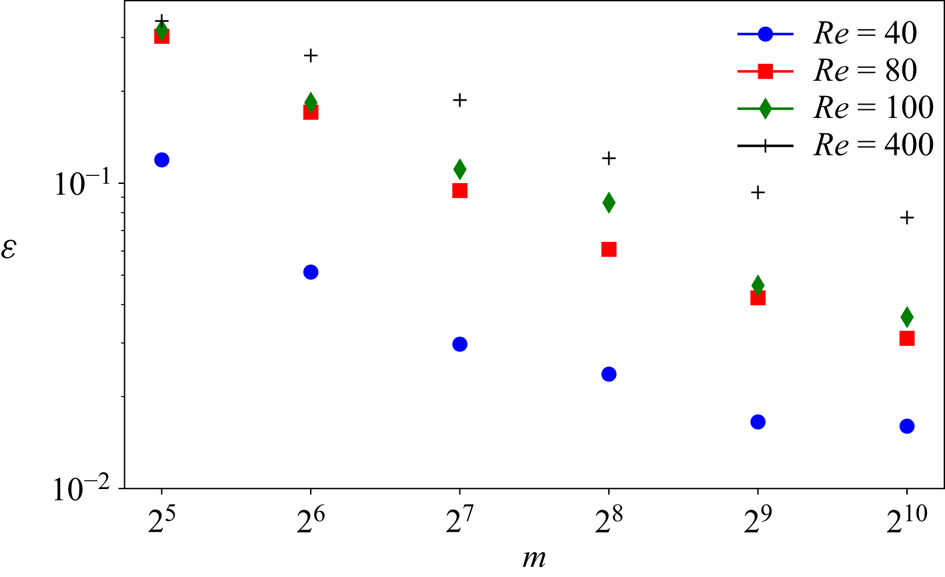
where the norm  $\| \omega \| := \sqrt {(1/4{\rm \pi} ^2) \iint \omega ^2 \,{\rm d}^2 \boldsymbol x }$. The average error over the test set for our new architecture is reported for a range of embedding dimensions
 $m \in \{32, 64,\ldots, 1024\}$ and all
 $Re$ in figure 2. Unsurprisingly, there is monotonic reduction in the error with increasing network dimensionality
 $m$ at fixed
 $Re$, and monotonic increase in the error with increasing
 $Re$ at fixed
 $m$. The best performing network at
 $Re=40$ shows an average relative error of
 $\sim$1 % (exact test-set mean error
 $0.016$, and standard deviation
 $0.0076$), whereas the performance at
 $Re=400$ has dropped to
 $\sim$8 % (mean test-set error of
 $0.077$ and standard deviation
 $0.017$). Visually, snapshots from all networks are very hard to distinguish from the ground truth once
 $\varepsilon _j \lesssim 0.1$: some examples for two specific networks and
 $Re$ pairs are reported in figure 3 with a ‘good’ and ‘bad’ snapshot included (in terms of relative error (2.5)). For comparison, the same error measure evaluated on the induced velocity fields computed from
 $\omega$ and
 $\mathscr A_m(\omega )$ is
 $\sim$2 % for snapshots where the vorticity error is
 $\varepsilon _j \approx 10\,\%$ at
 $Re=400$, and can be as much as a full order of magnitude better.
Average relative error (2.5) over the test set(s) as a function of embedding dimension for the best examples of all models trained in this work (recall the latent space dimension has a multiple of  $32$ by design).
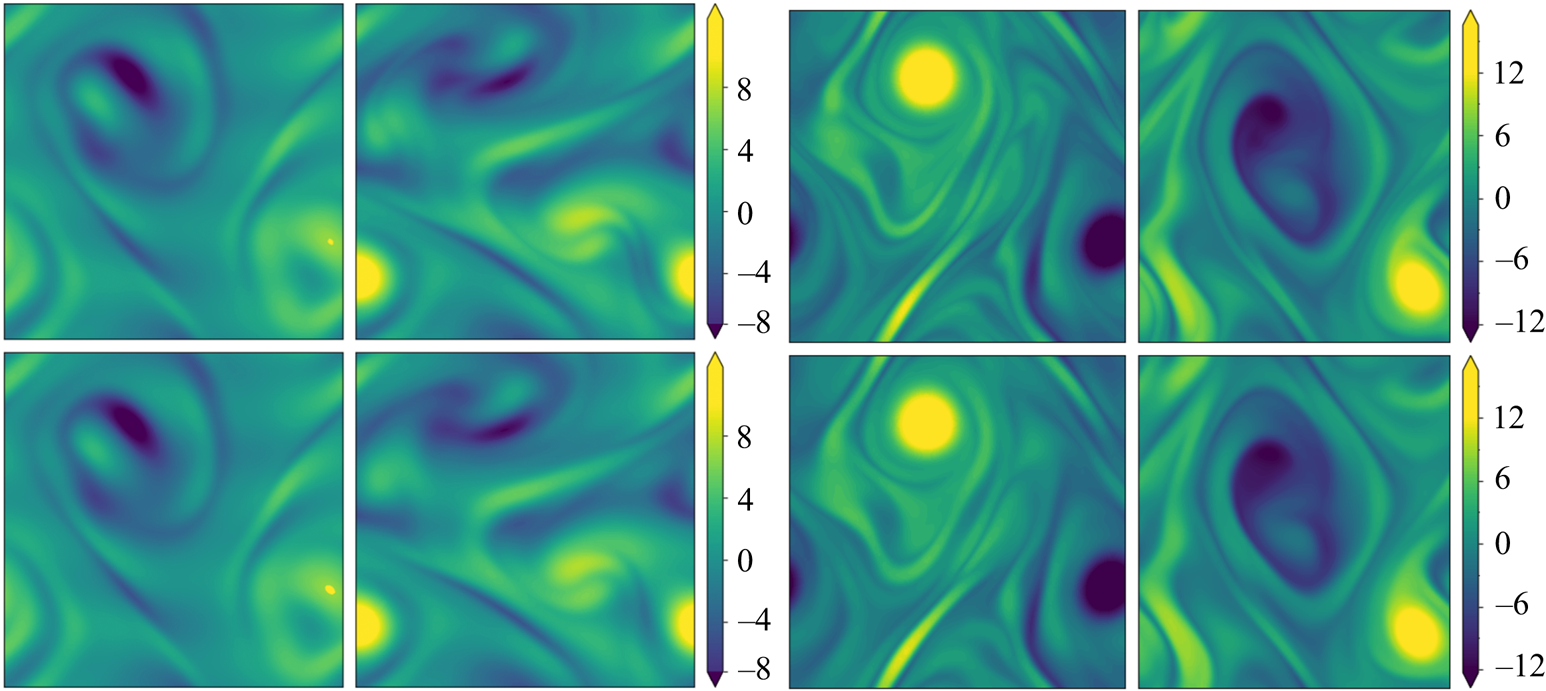
Snapshots of vorticity (top) at  $Re=100$ (left) and
 $Re=400$ (right). Below is the output of the autoencoder,
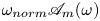 $\omega _{{norm}}\mathscr A_m(\omega )$. The network at
 $Re=100$ has minimum dimension
 $m=512$, whereas at
 $Re=400$ we use the
 $m=1024$ network. Relative errors (2.5) from left to right are
 $\varepsilon = 0.036$,
 $\varepsilon = 0.065$
 $\varepsilon = 0.102$ and
 $\varepsilon = 0.085$.
The distribution of errors over the test dataset is explored in more detail for the  $m=256$ networks at all four Reynolds numbers in figure 4, where we examine the dependence of reconstruction error on the dissipation of the snapshot. Notably, there is no significant loss of performance on the rarer, high-dissipation events. This is to be contrasted with the sequential autoencoders considered in PBK21 and was achieved using the dual loss function (2.4) which encourages a robust embedding of snapshots with stronger enstrophy. We exploit the quality of the high-dissipation embeddings here to explore the nature of high-dissipation events as
 $Re$ increases. We note that the errors reported in figures 2 and 4 are unaffected by the application of discrete symmetry transforms to the vorticity fields due to the data augmentation which was applied during training, and which was described earlier in § 2. For example, using a relative error which includes discrete symmetries (e.g.
 $\|\mathscr S^k \mathscr R \omega _j - \mathscr A_m(\mathscr S^k \mathscr R \omega _j) \| / \| \omega _j \|$, with
 $k\in \{1, 3, 5,7\}$) yields results which are essentially indistinguishable from those discussed previously (not shown).
Histograms of the test datasets for all  $Re \in \{40, 80, 100, 400\}$ (
 $Re$ increasing left to right in the figure), visualised in terms of the relative error (2.5) computed using the
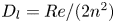
 $m=256$ networks and the snapshot dissipation value normalised by the laminar value,
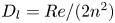 $D_l = Re/ (2 n^2)$. The form of the loss function used in training (2.4) ensures that the rarer high-dissipation events are embedded to a similar standard to the low-dissipation data which make up a much larger proportion of the observations. Colours represent the number of snapshots in each bin, with a logarithmic colourmap.

For the remainder of this paper we consider three networks,  $(Re, m) = (40, 128)$,
 $(100, 512)$ and
 $(400, 1024)$. This covers the full range of
 $Re$ for which we have trained models (excluding
 $Re=80$ which is qualitatively very similar to
 $Re=100$), with embedding dimensions
 $\{m\}$ selected to balance model performance against interpretability. Each of the three networks yields average relative errors
 $\varepsilon$ of between roughly 2 % and 8 %.
3. Latent Fourier analysis
3.1. Methodology
PBK21 introduced ‘latent Fourier analysis’ as a method to interpret the latent representations within neural networks for systems exhibiting a continuous symmetry. We will use the same approach here to understand how the state space of Kolmogorov flow complexifies under increasing  $Re$, with a particular focus on the high-dissipation ‘bursting’ events. We briefly outline the numerical procedure for performing a latent Fourier decomposition of an encoded vorticity field,
 $\mathscr E_m(\omega )$.
To perform a latent Fourier analysis we seek a linear operator that can perform a continuous streamwise shift in the latent space
 \begin{equation} \boldsymbol T_{\alpha} \mathscr E_m (\omega) := \mathscr E_m (\mathscr T_{\alpha} \omega), \end{equation}
where  $\alpha$ is a chosen shift in the
 $x$-direction. An approximate latent-shift operator
 $\hat {\boldsymbol T}_{\alpha }$ is found via a least-squares minimisation (i.e. dynamic mode decomposition; Rowley et al. Reference Rowley, Mezić, Bagheri, Schlatter and Henningson2009; Schmid Reference Schmid2010) over the test set of embedding vectors and their
 $x$-shifted counterparts:
 \begin{equation} \hat{\boldsymbol T}_{\alpha} = \boldsymbol E_m(\{\mathscr T_{\alpha} \omega\}) \boldsymbol E_m(\{\omega\})^+\in {\mathbb{R}}^{m \times m}, \end{equation}
where the  $+$ indicates a Moore–Penrose pseudo-inverse and
 \begin{equation} \boldsymbol E_m(\{\omega\}) := [\mathscr E_m(\omega_1) \quad \cdots \quad \mathscr E_m(\omega_N)] \in {\mathbb{R}}^{m \times N}, \end{equation}
with  $N \gg m$ (
 $N = O(10^5)$). As in PBK21, we consider a shift
 $\alpha = 2{\rm \pi} / p$, with
 $p\in \mathbb {N}$, and given that
 $\boldsymbol T^p_{\alpha }\mathscr E_m(\omega ) = \mathscr E_m(\omega )$ due to streamwise periodicity, the eigenvalues of the discrete latent-shift operator are
 $\varLambda = \exp (2{\rm \pi} {\rm i} l/p)$, where
 $l \in \mathbb {Z}$ is a latent wavenumber.
The parameter  $p$ is incrementally increased (i.e. reducing
 $\alpha$) until we stop recovering new latent wavenumbers. Across our networks, we find that only a handful of latent wavenumbers are required: substantially fewer than the number of wavenumbers required to accurately resolve the flow. For example,
 $l_{{max}}=3$ for the
 $m=128$ network at
 $Re=40$, whereas the much higher-dimensional network
 $m=1024$ at
 $Re=400$ uses wavenumbers as high as
 $l_{{max}}=8$. This compression comes about because each latent wavenumber
 $l$ is associated with vorticity fields which are periodic over
 $2{\rm \pi} /l$. This means Fourier wavenumbers
 $k^f=ml$ for integer
 $m \in {\mathbb {Z}}$ can all be mapped onto
 $l$ resulting in a dramatically reduced maximum wavenumber
 $l_{{max}}$.
In practice streamwise-translation invariance is not embedded perfectly in any of our networks, and we use only the subset of the latent space which does exhibit equivariance under streamwise shifts by only retaining modes for which  $|\varLambda _j|>0.9$. With the non-zero latent wavenumbers determined we can now write down an expression for an embedding of a snapshot subject to an arbitrary shift,
 $s\in \mathbb {R}$, in the streamwise direction:
 \begin{equation} \mathscr E_m(\mathscr T_s \omega) = \sum_{l ={-}l_{{max}}}^{l_{{max}}} \left(\sum_{k=1}^{d(l)} \mathscr P^l_k(\mathscr E_m(\omega))\right){\rm e}^{{\rm i}ls}, \end{equation}
where
 \begin{equation} \mathscr P^l_k(\mathscr E_m(\omega)):= [(\boldsymbol \xi_k^{(l){{\dagger}}})^H \mathscr E_m (\omega) ]\boldsymbol \xi^{(l)}_k, \end{equation}
with  $\boldsymbol \xi ^{(l)}_k$ the
 $k$th eigenvector of the shift operator
 $\hat {\boldsymbol T}_{\alpha }$,
 \begin{equation} \hat{\boldsymbol T}_{\alpha}\boldsymbol{\xi}^{(l)}_k = \exp(2{\rm \pi} {\rm i} l /p) \boldsymbol{\xi}^{(l)}_k, \end{equation}
in the subspace  $l$ and
 $\boldsymbol \xi ^{(l){{\dagger}} }_k$ is the corresponding adjoint eigenfunction so
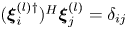 $(\boldsymbol \xi _i^{(l){{\dagger}} })^H\boldsymbol \xi ^{(l)}_j = \delta _{ij}$ with superscript
 $H$ indicating the conjugate-transpose. Equation (3.4) makes the connection with a Fourier transform clear. The small number of non-zero latent wavenumbers means that each must encode a wide variety of different patterns in the flow: each latent wavenumber is (potentially highly) degenerate with geometric multiplicity
 $d(l)$ whereas a given Fourier mode is not (ignoring the same degeneracy both possess in
 $y$). In (3.4) the quantity
 $\mathscr P^l_k(\mathscr E_m(\omega ))$ is the projection of the embedding vector onto direction
 $k$ within the eigenspace of latent wavenumber
 $l$. We obtain these projectors via a singular value decomposition (SVD) within a given eigenspace, which is described in § 3.2. We refer to the decode of a projection onto individual latent wavenumbers as a ‘recurrent pattern’.
At the innermost representation in the autoencoders the turbulent flow is represented with a set of feature maps of shape  $4 \times 8$, where the convolutional operations mean that the four horizontal cells each correspond to a quarter of the original domain, i.e. the network has constructed some highly abstract feature that was originally located in one-quarter of the physical domain in
 $x$. The correspondence of components of the innermost feature maps to specific regions of physical space is ensured by: (i) restricting the architecture to purely convolutional layers; (ii) periodic padding of the image at each layer of the network so that the output of the discrete convolution operation retains the same shape as the input; and (iii) shrinking of the convolutional filters as pooling operations are applied to retain a consistent size relative to the physical domain. Full architectural details are provided in Appendix A. This physical-space correspondence can be verified by shifting the input vorticity field by an exact quarter of the domain in
 $x$, after which the innermost feature maps are unchanged apart from a permutation of rows to match the shifting operation. Similarly, the eight vertical cells isolate some feature located in one of eight vertical bands in the original image: the Kolmogorov forcing fits eight half-wavelengths in the domain, and the ‘shift’ in the shift-reflect symmetry is one half-wavelength. The convolutions are invariant to arbitrary translations in
 $y$, but the shift-reflect by a half-wavelength must be ‘learned’, which we accomplish via the data augmentation discussed in § 2. This is also the case for the rotational symmetry, which we account for in the augmentation during network training.
The choice of a particular feature map size for the encoder can be used to encourage the network to learn recurrent patterns at a particular scale. This architectural choice is at the root of the relatively low values of  $l_{{max}}$ observed for the networks. For example, consider the case of a single feature map for the encoder: this would correspond to the
 $m=32$ networks trained here. In this case, we are effectively coarse-graining the original vorticity snapshot to a single
 $4\times 8$ image, where, as discussed previously, each of the four rows corresponds to one-quarter domain in
 $x$. Therefore, by the Nyquist sampling criterion that the minimum length scale that can be resolved is twice the grid spacing (i.e.
 $L_x/2$), the maximum wavenumber obtained in the horizontal direction is
 $l_{{max}} = 2$: the network has to learn to couple smaller-scale features to large scales in the most efficient way. By expanding the number of feature maps at the innermost level, as is done for the
 $m > 32$ networks (note that the
 $m=1024$ network has 32 feature maps), in principle we allow for higher latent wavenumbers, but it is seemingly inefficient for the network to embed features in this way, and instead most of the energy is contained in relatively low
 $l$. This is a benefit from an interpretability point of view, since individual recurrent patterns have a physical significance; each features a large number of physical wavenumbers with a base periodicity set by the value of
 $l$.
We report eigenvalue spectra for the latent wavenumbers in figure 5 for each of the three networks considered here. These figures were generated by first selecting a shift  $\alpha = 2{\rm \pi} /p$, computing the spectra of
 $\hat {\boldsymbol T}_{\alpha }$ and inverting
 $\varLambda = \exp (2 {\rm \pi}{\rm i} l/p)$. As described previously, we incrementally decreased the shift until we stopped recovering new
 $l$, i.e. the spectra reported in figure 5 are independent of
 $\alpha$. This independence is also true of decodes of projections onto eigenvectors of
 $\hat {\boldsymbol T}_{\alpha }$ which we discuss in subsequent sections.
Eigenvalues of the latent shift operator,  $\hat {\boldsymbol T}_{\alpha }$, visualised in terms of latent wavenumbers
 $l = l_r + {\rm i} l_i$ (in a perfect approximation
 $l_i=0$). (a) Network
 $(Re,m) = (40, 128)$, with shift
 $\alpha = 2{\rm \pi} / 11$. (b) Network
 $(Re,m) = (100, 512)$, with shift
 $\alpha = 2{\rm \pi} / 17$. (c) Network
 $(Re, m) = (400, 1024)$, with shift
 $\alpha = 2{\rm \pi} / 23$. Latent wavenumbers are determined by writing the eigenvalues of the shift operator as
 $\varLambda = \exp (2{\rm \pi} {\rm i} l/p)$, where
 $\alpha \equiv 2{\rm \pi} / p$. Horizontal dotted lines indicate the threshold
 $|\varLambda | = 0.9$ or, equivalently,
 $l_i = -p\log (0.9)/2{\rm \pi}$, below which eigenvalues are discarded when doing latent projections. Dotted vertical lines indicate integer values of
 $l_r$.
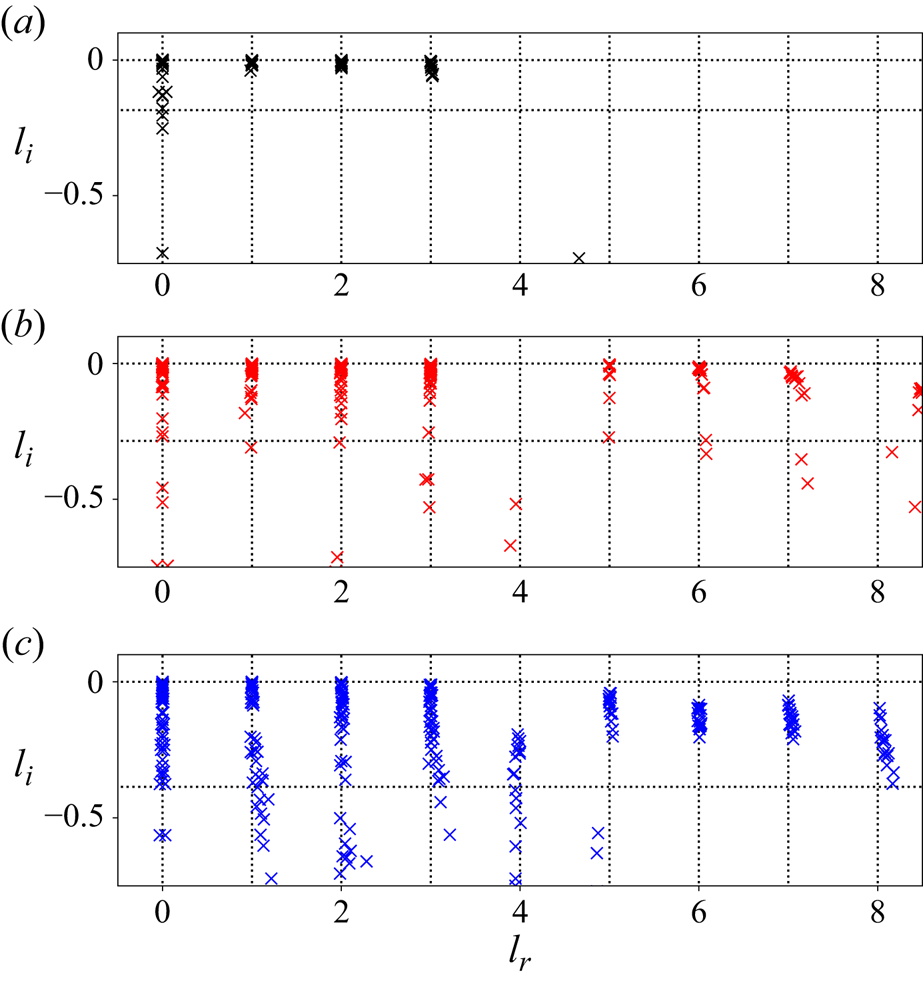
The clustering of points in figure 5 around the integer values of  $l$ shows that the eigenvalues of the shift operator are highly degenerate. The maximum latent wavenumber found (and the size of each eigenspaces) expands with increasing
 $Re$, and consequently a smaller value of
 $\alpha$ is needed to construct the shift operator (3.1). There are large numbers of points clustered on integer values of
 $l$ in figure 5, though we also find that some structure in the network can not be accurately shifted with a linear operator, and we also observe ‘decaying’ eigenvalues with negative imaginary part. This behaviour is more apparent as
 $Re$ increases and represents the imperfect embedding of continuous translations in the network (recall that the innermost representation coarse-grains the input image to a spatial ‘resolution’ of
 $4\times 8$); we consider only a subset of the latent space where translation is robust by thresholding
 $|\varLambda | > 0.9$.
Despite the expanding  $l_{{max}}$ with increasing
 $Re$ and the increasing inaccuracy of the shift operator, all networks can produce a fairly robust representation of the flow with just three non-zero
 $l$. The reconstruction accuracy of a truncated set of recurrent patterns is examined in figure 6, where we report the average reconstruction error as the number of latent wavenumbers used is incrementally increased. This error is defined per snapshot as
 \begin{equation} \widehat{\varepsilon}_j(l') := \frac{\| \omega_j - [\mathscr D \circ \hat{\mathscr{E}}^{l'}](\omega_j)\|}{\|\omega_j\|}, \end{equation}
where
 \begin{equation} \widehat{\mathscr E}^{l'}(\omega) := \sum_{l ={-}l'}^{l'} \left(\sum_{k=1}^{d(l)} \mathscr P^l_k(\mathscr E(\omega))\right), \end{equation}
is the projection onto the first  $l' > 0$ latent wavenumbers. Note that now
 $d(l)$ is computed as the number of modes with
 $(l_r)_k \equiv l$ for which
 $|\varLambda | > 0.9$.
Test-set average error in reconstruction (3.7) as a function of increasing  $l$. Dashed blue line is the error using the full latent representation as reported in figure 2, dashed red line is the error when reconstruction is performed using all eigenvectors of
 $\hat {\boldsymbol T}_{\alpha }$ with eigenvalues
 $|\varLambda | > 0.9$. From left to right:
 $(Re,m) = (40, 128)$,
 $(100, 512)$ and
 $(400, 1024)$. Note that there are no patterns within
 $l=4$ subspace at
 $Re=100$ (see figure 5).

The error reported in figure 6 ((3.7) averaged over the test set) monotonically drops as the maximum latent wavenumber is increased, although note the loss in representation from discarding wavenumbers with eigenvalues  $|\varLambda | < 0.9$. For the flow configuration considered here, it is really the first three non-zero latent subspaces that do most of the ‘heavy lifting’, and they encode a huge variety of dynamical processes. The error with
 $l' = 3$ at
 $Re=400$ is
 $O(0.2)$, which still produces snapshots which are visually hard to distinguish from the input (see earlier discussion of the error in § 2.2). It is also noteworthy that in all cases the
 $l=4$ contribution is either extremely weak or absent entirely. This is consistent with the poor resolution of
 $l=4$ eigenvalues observed in the eigenvalue spectra of figure 5. Although it is challenging to pin down the mechanism behind this observation, we note that linear instability of the basic flow is upper bounded by streamwise wavenumber
 $k=4$ (see, e.g. Chandler & Kerswell Reference Chandler and Kerswell2013) and we have been unable to find any simple invariant solutions which are contained in a quarter domain.
3.2. Recurrent patterns
To probe the influence of a particular latent wavenumber, we decode projections of snapshots onto individual, or combinations of latent vectors within that  $l$-subspace. Despite the nonlinearity of the architecture, this linear analysis of the embeddings sheds some insight into how vorticity fields are efficiently embedded and, as we show, forms the basis for new methods to detect UPOs. Here we follow the methodology outlined in PBK21 and perform an SVD within each eigenspace to obtain a set of mutually orthornormal modes, which are ordered by their contribution to the total variance within that particular value of
 $l$ over the test dataset, and which can be decoded in isolation to reveal an associated flow pattern.
To perform the SVD within a particular latent subspace, we first project down the latent space to the  $l$-subspace as follows
 \begin{equation} \mathscr P^l (\mathscr E (\omega)) = \sum_{k=1}^{d(l)} \mathscr P^l_k (\mathscr E (\omega)) + \text{c.c.} \end{equation}
Adding the complex conjugate is required when  $l \neq 0$. We then construct the projected embedded data matrix and perform an SVD within that subspace:
 \begin{equation} \boldsymbol E^l := [\mathscr P^l(\mathscr E(\omega_1)) \quad \cdots \quad \mathscr P^l(\mathscr E(\omega_N))] = \boldsymbol U_l \boldsymbol \varSigma_l \boldsymbol W_l^H, \end{equation}
where  $N$ is the number of snapshots in the dataset. The results of decoding various combinations of latent projections within different subspaces are reported in figure 7. Here we take a pair of snapshots at each
 $Re \in \{40, 100, 400\}$, compute the embedding
 $\mathscr E(\omega )$, project onto the individual eigenspaces with
 $\mathscr P^l$ before decoding some combination of projections, in some cases using only a subset of the left-singular vectors
 $\{\boldsymbol u_l^k\}_{k=1}^{d(l)}$ to decode the dominant components. The net result of all this is to replace the original basis
 $\{ \boldsymbol \xi ^{(l)}_k\}_{k=1}^{d(l)}$ on the
 $l$-latent subspace with a better-designed basis
 $\{\boldsymbol u_l^k\}_{k=1}^{d(l)}$ based on variance within the latent (sub)space. Plots of the singular value distributions within each subspace are included in Appendix B, from which the dimension
 $d(l)$ of each eigenspace can also be estimated.
Top: two sample vorticity snapshots each at  $Re=40$ (left),
 $100$ (centre) and
 $400$ (right). The remaining rows show respectively: the decode of the most energetic modes within the
 $l=0$ and
 $l=1$ subspace (3.11, the
 $(k=1)$ indicating that only the leading principal component is included in the
 $l=1$ subspace) followed by the full decodes of the
 $l=1$,
 $l=2$ and
 $l=3$ projections (3.12) along with the projections onto the first three physical Fourier modes
 $k_f\in \{1,2,3\}$ highlighted in blue boxes (note the zero Fourier mode is always included). At
 $Re=40$ the right snapshot is an example of a higher-dissipation event; the right snapshot at
 $Re=100$ is also high dissipation. Red box highlights a feature discussed in the text.

For physically realistic outputs we always include the streamwise-invariant projection onto  $l=0$ (see the discussion in PBK21), and in figure 7 we consider the combinations
 \begin{equation} \tilde{\omega} = \mathscr D ([(\boldsymbol u_{l=0}^1)^H \mathscr P^{l=0}(\mathscr E(\omega))\boldsymbol u_{l=0}^1] + [(\boldsymbol u_{l=1}^1)^H \mathscr P^{l=1}(\mathscr E(\omega))\boldsymbol u_{l=1}^1 + \text{c.c.}]), \end{equation}
along with decodes of full eigenspaces
 \begin{equation} \tilde{\omega} = \mathscr D (\mathscr P^{0}(\mathscr E(\omega)) + [\mathscr P^{l}(\mathscr E(\omega)) + \text{c.c.}]), \end{equation}
for  $l=1, 2, 3$. In the former case (3.11) we project onto only the most energetic directions within
 $l=0$ and
 $l=1$ before decoding. The most energetic
 $l=0$ mode decodes by itself to something resembling the basic laminar solution (not shown: eight bands of vorticity, invariant under all symmetries). The addition of the most energetic
 $l=1$ mode results in something that at
 $Re=40$ closely resembles the first non-trivial equilibrium to bifurcate from the laminar solution at
 $Re \approx 10$ (see, e.g. Chandler & Kerswell Reference Chandler and Kerswell2013, PBK21). This is visible in the second row of snapshots in figure 7. Notably a similar structure is found at both
 $Re=100$ and
 $Re=400$, though it is much less clear (particularly note the high-wavenumber contamination at
 $Re=100$). This coincides with a relative increase in the energy of other singular vectors across the
 $l=1$ subspace as
 $Re$ increases (not shown).
Decodes of full subspaces obtained via (3.12) are also reported below the snapshots in figure 7. The project-and-decode operation (3.12) produces vorticity fields with a fundamental horizontal length scale  $2{\rm \pi} / l$. These projections should be contrasted to projections onto individual Fourier modes (see the blue boxes in figure 7). As discussed in § 3 they include a wide range of physical wavenumbers and as such retain coherent structures from the original snapshot. This can be seen clearly the
 $l=2$ projections at both
 $Re=40$ and
 $Re=100$ in figure 7. When the flow is dominated by a pair of opposite-signed vortices, the full
 $l=1$ decode looks visually similar to the input snapshot at the lower
 $Re=40$, whereas for the higher values of
 $Re=100$ and
 $Re=400$ the result appear similar to a low-pass filter applied in Fourier space. Notably the higher-dissipation events (leftmost snapshot at
 $Re=40$; right snapshot at
 $Re=100$) do not exhibit this behaviour. In these cases, the
 $l=1$ pattern extracts some of the features in the input image, though there is a much stronger response in
 $l=1$ at
 $Re=100$ compared with
 $Re=40$ (discussed further in § 3.3).
The  $l=2$ and
 $l=3$ decodes of the higher-dissipation events at
 $Re=40$ and
 $Re=100$ are particularly interesting, since they highlight local vortical features that make up part of larger, doubly or triply periodic pattern within the autoencoder; for example, note the structure identified with the red box at
 $Re=40$ which then forms the basis for the
 $l=2$ recurrent pattern. The dynamical relevance of these patterns will be explored later when we use them to find new, high-dissipation UPOs, which are visually very similar to the
 $l=2$ (and, at
 $Re=40$,
 $l=3$ too) decodes shown here.
3.3. High-dissipation events under increasing  $Re$

The structure of the state space of vorticity fields can be explored further by dimensionality reduction on latent Fourier projections. We first define a streamwise-shift invariant observable using the latent wavenumbers  $0 \leq l \leq 3$,
 \begin{equation} \boldsymbol \psi(\omega) := \begin{pmatrix} (\boldsymbol u_{l=0}^1)^H \mathscr P^{0}(\mathscr E(\omega)) \\ (\boldsymbol u_{0}^2)^H \mathscr P^{0}(\mathscr E(\omega)) \\ \vdots \\ |(\boldsymbol u_{1}^1)^H \mathscr P^{1}(\mathscr E(\omega))| \\ \vdots \\ |(\boldsymbol u_{3}^{d(3)})^H \mathscr P^{3}(\mathscr E(\omega))| \end{pmatrix}, \end{equation}
where the absolute value for wavenumbers  $l>0$ removes any
 $x$-location dependence of the features and
 $\boldsymbol u_l^j$ is the
 $j$th left-singular vector from the matrix
 $\boldsymbol U_l$ (defined in (3.10)). We then input the streamwise-shift-independent latent observable (3.13) into the ‘UMAP’ algorithm (McInnes et al. Reference McInnes, Healy and Melville2018), which seeks a two-dimensional representation of the data by (i) assuming there is some manifold on which the data are uniformly distributed and (ii) attempting to preserve geodesic distances on the manifold in the Euclidean distances between points in the mapped representation. Note we obtain similar results (not shown) with the t-SNE algorithm (van der Maaten & Hinton Reference van der Maaten and Hinton2008).
Low-dimensional visualisations produced by the combination of (3.13) and the UMAP algorithm are reported in figure 8 for all three networks examined in detail. The data represented in figure 8 are the full test dataset at each  $Re\in \{40, 100, 400\}$, with an embedding vector
 $\mathscr E(\omega )$ computed for each vorticity field using the appropriate encoder before the shift-invariant observable (3.13) is calculated. In each case there is a clear octagonal shape in the data cloud, which is due to the shift-reflect symmetry present in the full equations (2.1), i.e. each of the eight sectors of the octagon is, to a good approximation, a shift-reflected copy of the others. This indicates that the flow still feels the signature of the forcing even at the highest
 $Re$ considered here, though the clarity of the octagon perhaps decreases at higher
 $Re$. The imprint of the forcing on the dynamics should be contrasted with the behaviour of the flow as
 $Re\to \infty$ where the structures found are independent of the specifics of the forcing term; see, e.g. the unimodal solutions considered in Kim & Okamoto (Reference Kim and Okamoto2015), Kim, Miyaji & Okamoto (Reference Kim, Miyaji and Okamoto2017) and the Euler solutions described by Zhigunov & Grigoriev (Reference Zhigunov and Grigoriev2023). Increasing the Reynolds number fundamentally alters the latent representations, which allows us to infer something about the nature of the inertial manifold of the governing equations. At the lowest value of
 $Re=40$, there is a small detached high-dissipation octagon clearly visible in figure 8 (a similar structure was observed in PBK21 at
 $Re=40$, but without the clean shift-reflect embedding due to the poor performance of that autoencoder model). This detachment suggests that high dissipation events at
 $Re=40$ are distinct from the low-dissipation dynamics, where snapshots tend to feature a large contribution from the latent Fourier mode resembling the first non-trivial equilibrium which was discussed around figure 7 above.
Two-dimensional visualisations of the continuous-shift invariant observable (3.13) obtained using the UMAP algorithm (McInnes, Healy & Melville Reference McInnes, Healy and Melville2018). The  $x$- and
 $y$-axes here represent coordinates in the reduced two-dimensional representation produced by UMAP, which are determined such that the mapped data approximately preserves ‘closeness’ between nearby points in the original variables. From left to right are the results for
 $Re=40$ (
 $m=128$ network),
 $Re=100$ (
 $m=512$ network) and
 $Re=400$ (
 $m=1024$ network). Note the octagonal shape visible in all three examples represents the networks’ internal representation of the discrete shift-reflect symmetry in the system. Data points are coloured by their dissipation values running from the lowest (dark blue) to highest (yellow).

In contrast, the low-dimensional visualisation at  $Re=100$ in figure 8 shows no detached bursting structure, but rather the high-dissipation events are included in the single embedding ‘octagon’. The embeddings still contain the structure resembling the non-trivial first equilibrium (although now much more weakly; see figure 7) and there is then a continuous latent connection to any vorticity field regardless of the strength of the dissipation. More concretely, consider the embedding of a vorticity field and an equivalent, shift-reflected version,
 $\mathscr E(\omega )$ and
 $\mathscr E(\mathscr S^m \omega )$ (
 $1 \leq m \leq 7$): it is possible to reach the embedding
 $\mathscr E(\mathscr S^m \omega )$ from
 $\mathscr E(\omega )$ without having to go through intermediate shift-reflects, i.e. any shift-reflected copy can be smoothly reached by passing through the middle of the octagon.
The lower- $Re$ embeddings should be contrasted with the results at
 $Re=400$, which indicate an entirely different latent representation. The octagonal shape remains in figure 8, but now with a large, central hole. It is now only possible to reach a shift-reflected copy of the embedding of a vorticity field by traversing around the octagonal ring, moving incrementally through shift-reflects. This reflects the fact that the representations are now built around the continued presence of a large domain-filling vortex pair, and coincides with the weakened appearance of the
 $l=1$ structure resembling the non-trivial equilibrium in the embeddings.
To further explore the changing nature of ‘high-dissipation’ events as  $Re$ increases, we compute the following observable for individual trajectories in our test set:
 \begin{equation} \beta_l(\omega) := \sum_{k=1}^{d(l)}|(\boldsymbol u_{l}^{k})^H \mathscr P^{l}(\mathscr E(\omega))|, \end{equation}
which is a measure of the total contribution of the latent subspace  $l$ and as before
 $d(l)$ is computed from the number of modes with
 $|\varLambda |>0.9$ in each eigenspace. The size of
 $d(l)$ increases with
 $Re$, with
 $d\sim 10\unicode{x2013}20$ at
 $Re=40$, whereas
 $d \sim 30 \unicode{x2013} 40$ at both
 $Re=100$ and
 $Re=400$. Plots of singular values within each eigenspace are reported in Appendix B and allow for precise determination of
 $d(l)$ at each
 $Re$. We compare the evolution of (3.14) to the instantaneous dissipation rate in figure 9 for wavenumbers
 $l\in \{1,2,3\}$, where we also indicate the mean value of each quantity over the entire test set for a meaningful comparison.
Visualisation of individual trajectories at (a)  $Re=40$, (b)
 $Re=100$ and (c)
 $Re=400$. Top panels show dissipation rate normalised by the laminar value, whereas the lower panels show the quantity
 $\beta _l$ (3.14) for
 $l=1$ (black),
 $l=2$ (red) and
 $l=3$ (green). In all cases the dashed horizontal lines are the mean value of the quantity (sample mean over the test set), whereas the shading identifies
 $\pm$1.5 standard deviations.
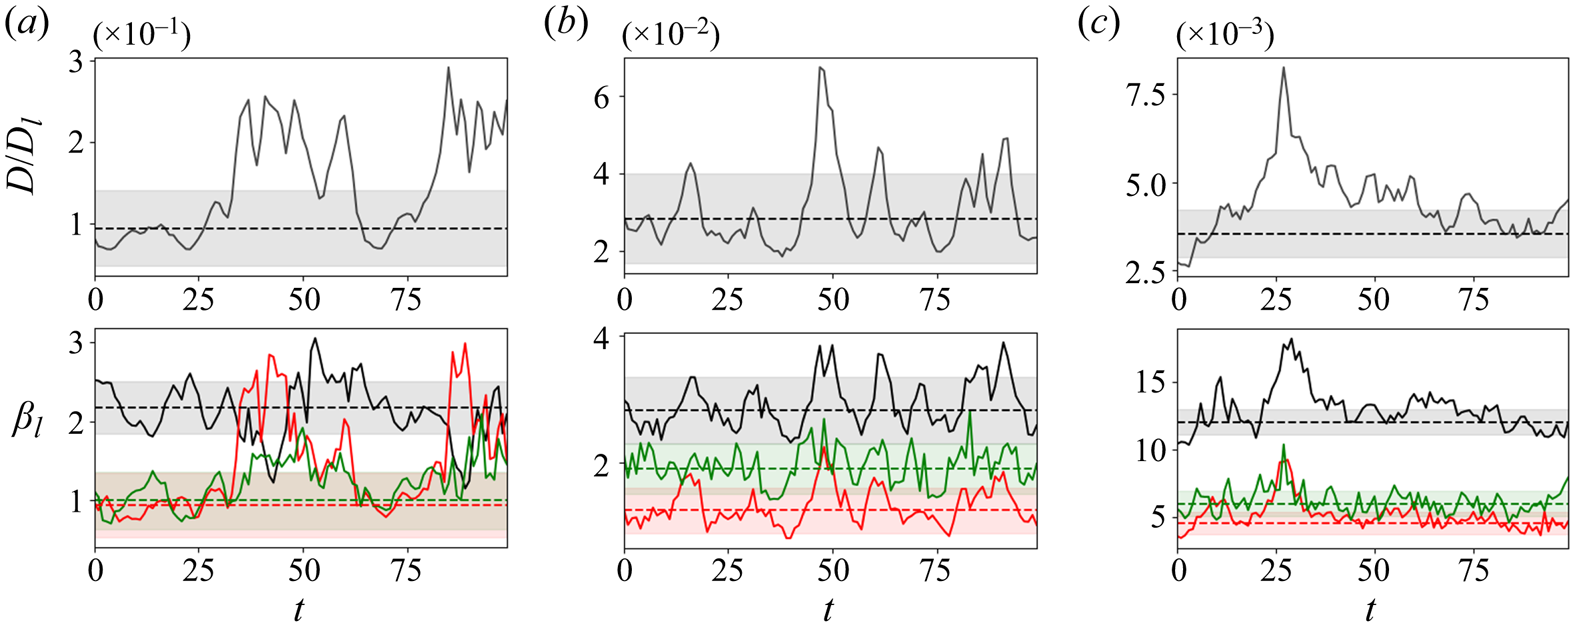
For the trajectory at  $Re=40$ in figure 9 two high-dissipation events are observed (both are substantially longer than typical excursions from the low-dissipation dynamics). In both cases, the burst is associated with extreme values in latent wavenumbers
 $l=2$ and
 $l=3$ which are 2–3 standard deviations above the mean, as measured by (3.14). Note also that this amplification coincides with a relatively low value of the amplitude in
 $l=1$. This indicates that, at
 $Re=40$ at least, ‘high dissipation’ is nearly synonymous with an increased amplitude of
 $l=2$ and
 $l=3$ latent Fourier modes, with a significant drop in
 $l=1$. This explains the detached high-dissipation octagon observed at
 $Re=40$ in the UMAP projections (figure 8) where the dimensionality reduction was performed on the vector
 $\boldsymbol \psi (\omega )$ defined in (3.13), whose components are projections onto individual latent Fourier modes.
Similarly, the high-dissipation event observed at  $t \sim 50$ for the
 $Re=100$ trajectory in figure 9 is also associated with a local spike in the
 $l=2$ contribution, and a smaller jump in
 $l=3$. However, the burst also features larger-than-usual amplitude in
 $\beta _1$. Bursting events feature small-scale vortices (corresponding to
 $l=2$ and
 $l=3$ patterns), but locally, and large-scale
 $l=1$ structure continues to play a role. This effect is amplified further at
 $Re=400$, where the high-dissipation values recorded at
 $t\sim 25$ in figure 9 are now associated with extreme values in the largest-scale patterns at
 $l=1$.
The merging and subsequent disappearance of distinct high-dissipation events described in figure 8 can be connected to small-scale UPOs and their movement away from the attractor as  $Re$ increases. To explore these effects, we now use our embeddings to generate UPO guesses in two ways, both by modifying the classical approach (Kawahara & Kida Reference Kawahara and Kida2001; Viswanath Reference Viswanath2007; Cvitanovic & Gibson Reference Cvitanovic and Gibson2010; Chandler & Kerswell Reference Chandler and Kerswell2013) and by using individual latent wavenumbers to look for high-dissipation solutions.
4. Unstable periodic orbits
4.1. Recurrent flow analysis with latent variables at $Re=40$

The classical method for searching for UPOs in a turbulent flow is to measure similarity between vorticity fields on the same orbit, separated by  $T$ in time. If the vorticity field is ‘similar’ now to a point
 $T$ in the past, this is taken to indicate that the flow has shadowed a UPO for a full period
 ${\sim } T$. To find the UPO, the starting (past) vorticity field is input into a Newton–Raphson algorithm, along with the guess for the period,
 $T$. This is ‘recurrent flow analysis’ (Kawahara & Kida Reference Kawahara and Kida2001; Viswanath Reference Viswanath2007; Cvitanovic & Gibson Reference Cvitanovic and Gibson2010; Chandler & Kerswell Reference Chandler and Kerswell2013), and the ‘similarity’ between snapshots is measured via a Euclidean norm:
 \begin{equation} R(\omega, T) := \min_{s}\frac{\| \mathscr T^{s} f^T(\omega) - \omega \|}{\|\omega\|}, \end{equation}
where  $f^T$ is the time-forward map of (2.1) and we perform a search over the continuous symmetry (note we could also search over the discrete symmetries, but we do not consider this here). Local minima in
 $R(\omega,T) \leq R_{{thresh}}$ which fall below some threshold are selected as viable guesses for UPOs which take the form of a triple
 $(\omega, T, s)$ (which includes a guess for the shift
 $s$ that minimises the right-hand side of (4.1)). In Kolmogorov flow a relatively large threshold value is required to flag guesses (e.g. typically a value
 $R_{{thresh}}=0.3$ has been selected by previous authors, though higher values have also been considered, see Lucas & Kerswell Reference Lucas and Kerswell2014, Reference Lucas and Kerswell2015).
If a near-recurrence does occur, a major shortcoming of the approach outlined above is that there is no a priori reason to assume that a Euclidean distance in vorticity is the best metric to measure distance between flow states in phase space which are not particularly close on the inertial manifold, but which may still be observed in a shadowing event (see the interesting discussion around it's suitability to detect UPO shadowing in Krygier et al. Reference Krygier, Pughe-Sanford and Grigoriev2021). At  $Re=40$ recurrent flow analysis can still be somewhat effective, and we show here how the autoencoders can improve this UPO-guess generation method.
The central idea is that the features recorded in our autoencoders are likely to be a much more effective observable for flagging similarity between snapshots than the computational vector of the vorticity field itself. We therefore keep the main mechanics of a recurrent flow analysis in place, but instead measure similarity in the shift-independent observable  $\boldsymbol {\psi }(\omega )$ defined in (3.13). Our modified near-recurrence function reads
 \begin{equation} R_{{\mathscr E}}(\omega, T) := \frac{\| \boldsymbol \psi(f^T(\omega)) - \boldsymbol \psi(\omega) \|}{\|\boldsymbol\psi(\omega)\|}. \end{equation}
Now no search over the continuous symmetry is required. The guess for the shift is determined from the phase difference in the projection onto the dominant  $l=1$ mode between the ‘start’ and ‘end’ snapshots via
 \begin{equation} s = \text{Real}\left[-{\rm i} \log\left(\frac{(\boldsymbol u_{l=1}^{1})^H \mathscr P^{l=1}(\mathscr E(f^T(\omega)))}{(\boldsymbol u_{l=1}^{1})^H \mathscr P^{l=1}(\mathscr E(\omega))}\right) \right]. \end{equation}
To select an appropriate threshold on the latent near-recurrence measure (4.2) we computed  $R_{{\mathscr E}}(\omega _j, T_j)$ for a large number of snapshot–period pairs
 $\{(\omega _j, T_j)\}$ for which the physical near-recurrence (4.1) was just below the threshold
 $R(\omega _j, T_j) \lesssim 0.3$. We found that selecting a threshold value
 $R_{{\mathscr E}}=0.015$ captured
 $\sim$80 % of the physical-space guesses and fix this value throughout our analysis. The utility of the approach is that when applied to turbulent data,
 $R_{{\mathscr E}}$ then flags many more viable guesses that are missed altogether using the standard approach.
The performance of the new latent observable is compared with the standard approach in figure 10, where we report contours of the regular recurrence measure  $R$ and
 $R_{\mathscr {E}}$ over
 $500$ advective time units. Following the protocol defined in Chandler & Kerswell (Reference Chandler and Kerswell2013), initial conditions
 $\omega (t)$ for which
 $R(\omega (t), T) < 0.3$ are supplied as guesses to a Newton–Krylov–Hookstep solver in an attempt to converge an exact UPO. Similarly, guesses for which
 $R_{{\mathscr E}}(\omega (t), T) < 0.015$ are also supplied to the same (physical space) Newton solver.
Recurrent flow analysis comparison between the full vorticity field (4.1) and the latent observable (4.2), for the same example time series. (a) Contours of recurrence measure  $R=0.3$ (blue)
 $R=0.45$ (orange) and
 $R=0.6$ (black). Points where
 $R\leq 0.3$ were supplied as initial guesses to a Newton solver. (b) Contours of latent recurrence measure
 $R_{{\mathscr E}} = 0.015$ (blue),
 $R_{{\mathscr E}} = 0.03$ (orange) and
 $R_{{\mathscr E}} = 0.045$ (black). Points where
 $R_{{\mathscr E}} \leq 0.015$ were supplied as initial guesses to a Newton solver (selection of this threshold is discussed in the text). In both cases red dots indicate a failed convergence, green dots a success. This plot shows that the search using the latent observable (4.2) is much more successful than using the full vorticity field.

The contour plots reported in figure 10 indicate that the flagging of near-recurrences is often qualitatively similar between the two approaches. As expected, the latent observable flags many of the same guesses as the standard approach, but it also identifies near-recurrences which are not observed at all in the original vorticity-based approach, even when the recurrence threshold is relaxed. In figure 10 we have also included contours of  $R(\omega, T)$ significantly above the threshold (as high as a relative error of 60 %). We can see that the latent observable does indeed identify some UPOs that were missed because they were just above the standard vorticity threshold, for example note the convergences around
 $t\sim 2200$, but also identifies near-recurrences which would not have been identified at all with the previous approach (note the success with
 $T \sim 20$ at
 $t \sim 2230$).
We applied both standard and ‘latent’ recurrent flow analysis over a single trajectory of length  $0 \leq t \leq 8000$, with a maximum period in the search of
 $T_{{max}}=50$. The standard approach resulted in 232 guesses, of which 73 UPOs were converged, with 20 unique solutions: a success rate of
 $\sim$26 % in terms of raw convergences. In contrast, the latent Fourier approach produced a much larger number of 1340 guesses, of which 543 converged to UPOs, with 67 unique solutions. In the latter case, there is a much higher convergence rate of
 $\sim$40 %, which indicates that the threshold on
 $R_{{\mathscr E}}$ could perhaps be relaxed further. What is striking is that the number of unique solutions far exceeds what has been found by the previous approach; note that the 67 unique UPOs far exceeds the
 $\sim$50 solutions found in recurrent flow analysis of
 $10^5$ time units of data by Chandler & Kerswell (Reference Chandler and Kerswell2013), despite our relatively short interval of 8000 advective time units.
The periodic orbits found using the latent recurrent flow analysis are shown in figure 11 in the form of two-dimensional projections onto a production-dissipation-rate diagram which also includes the turbulent PDF. Similar to the majority of structures found previously via recurrent flow analysis (see, in particular, Chandler & Kerswell Reference Chandler and Kerswell2013; Lucas & Kerswell Reference Lucas and Kerswell2014), all the UPOs found are relatively low dissipation. Thus, although latent recurrent flow analysis does provide access to large numbers of new solutions that a standard recurrent flow analysis has not been able to return, it is still constrained by the fact that the more unstable structures are not flagged in this approach at all. We now discuss a new method to use latent Fourier analysis to isolate smaller-scale solutions which play a substantial role in the high-dissipation dynamics, and which is effective at both  $Re=40$ and
 $Re=100$.
Top: all periodic orbits found via latent Fourier-based recurrent flow analysis at  $Re=40$, visualised in terms of their production and dissipation rates (red lines). The laminar dissipation value
 $D_l = Re/ (2 n^2)$. Background grey contours are the turbulent PDF (contour levels spaced logarithmically with a minimum value
 $10^{-6}$), whereas the blue line identifies the longest UPO found with
 $T=49.091$, for which we show four snapshots of spanwise vorticity equally spaced every
 $T/5$ in the lower four panels of the figure. The starting point for the visualisation of the vorticity is identified with a white square in the production/dissipation plot, whereas contour levels for the vorticity run from
 $-10 \leq \omega \leq 10$.

4.2. Bursting periodic orbits
In PBK21 we used projections onto the  $l=2$ latent Fourier modes to find large numbers of equilibria and travelling waves which bore some resemblance to snapshots of high-dissipation events at
 $Re=40$. The quality of the networks constructed here allows us to go much further and find large numbers of high-dissipation UPOs. Our method is also effective at
 $Re=100$, though the structures we isolate there play a slightly different role in the dynamics.
We have seen that the latent observable (3.13) can substantially improve the performance of recurrent flow analysis, though as described previously the new UPOs identified in this way are largely ‘low dissipation’ (all have roughly 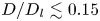 $D/D_l \lesssim 0.15$). An alternative approach is motivated by the time series in figure 9 which show a correlation of high-dissipation events with projections onto
 $l=2$ and
 $l=3$ latent recurrent patterns. These projections indicate the role of smaller-scale structure in the bursts and we therefore search for UPOs with a smaller fundamental horizontal length scale by generating guesses from latent Fourier projections onto modes with
 $l\geq 2$. Although the guesses may often be symmetric under half- or third-domain horizontal shifts, the same is often not true for the converged UPOs we find (i.e. the analysis could not have been performed in full in a smaller horizontal domain).
We first generate guesses for these small-scale, high-dissipation UPOs by decoding the projection onto either  $l=2$ or
 $l=3$ only (inclusion of the
 $l=0$ subspace is always required for a physically realistic output; see the discussion in PBK21):
 \begin{equation} \omega_g = \mathscr D(\mathscr P^{0}(\mathscr E(\omega)) + [\mathscr P^{l}(\mathscr E(\omega)) + \text{c.c.}] ). \end{equation}
We create UPO guesses by evaluating (4.4) on snapshots  $\omega$ for which the quantity (3.14) was greater than two standard deviations above the mean. We uniformly set the initial guess for the period to
 $T=5$ at
 $Re=40$ and
 $T=2.5$ at
 $Re=100$, values motivated by the typical duration of a ‘bursting’ event: recurrent flow analysis does not yield guesses in this regime, hence the lack of high-dissipation solutions documented in the literature. The initial guess for the shift was set to zero throughout,
 $s=0$. Although more systematic approaches to generating guesses for
 $T$ and
 $s$ may be possible, we found that these choices resulted in a significant success rate without optimisation (e.g.
 $l=2$ guesses at
 $Re=40$ converged
 $25$ % of the time, with an 11 % success rate for
 $l=3$).
The results of the bursting search at  $Re=40$ with
 $l=2$ are summarised in figure 12, where we display all UPOs identified using (4.4) in a production-dissipation plot. We find 61 unique UPOs, all of which are ‘high dissipation’ and have not been returned by any previous search method (for context, the search using recurrent flow analysis by Chandler & Kerswell Reference Chandler and Kerswell2013, over
 $10^5$ time units resulted in 51 unique low dissipation UPOs).
(a) Production/dissipation PDF of a long turbulent trajectory (contour levels spaced logarithmically with a minimum value  $10^{-6}$), with all 61 bursting periodic orbits found from
 $l=2$ projections at
 $Re=40$ (dotted lines). Four periodic orbits are highlighted in colour. Blue:
 $T=3.962$ (note the very small loop can't be seen clearly in the visualisation on the left); green:
 $T=2.606$; orange:
 $T=2.895$ and red:
 $T=7.452$. (b) Spanwise vorticity at points equispaced in time for the four highlighted UPOs, with
 $\Delta t = T/4$ and starting at the point indicated by the relevant marker in the left panel.
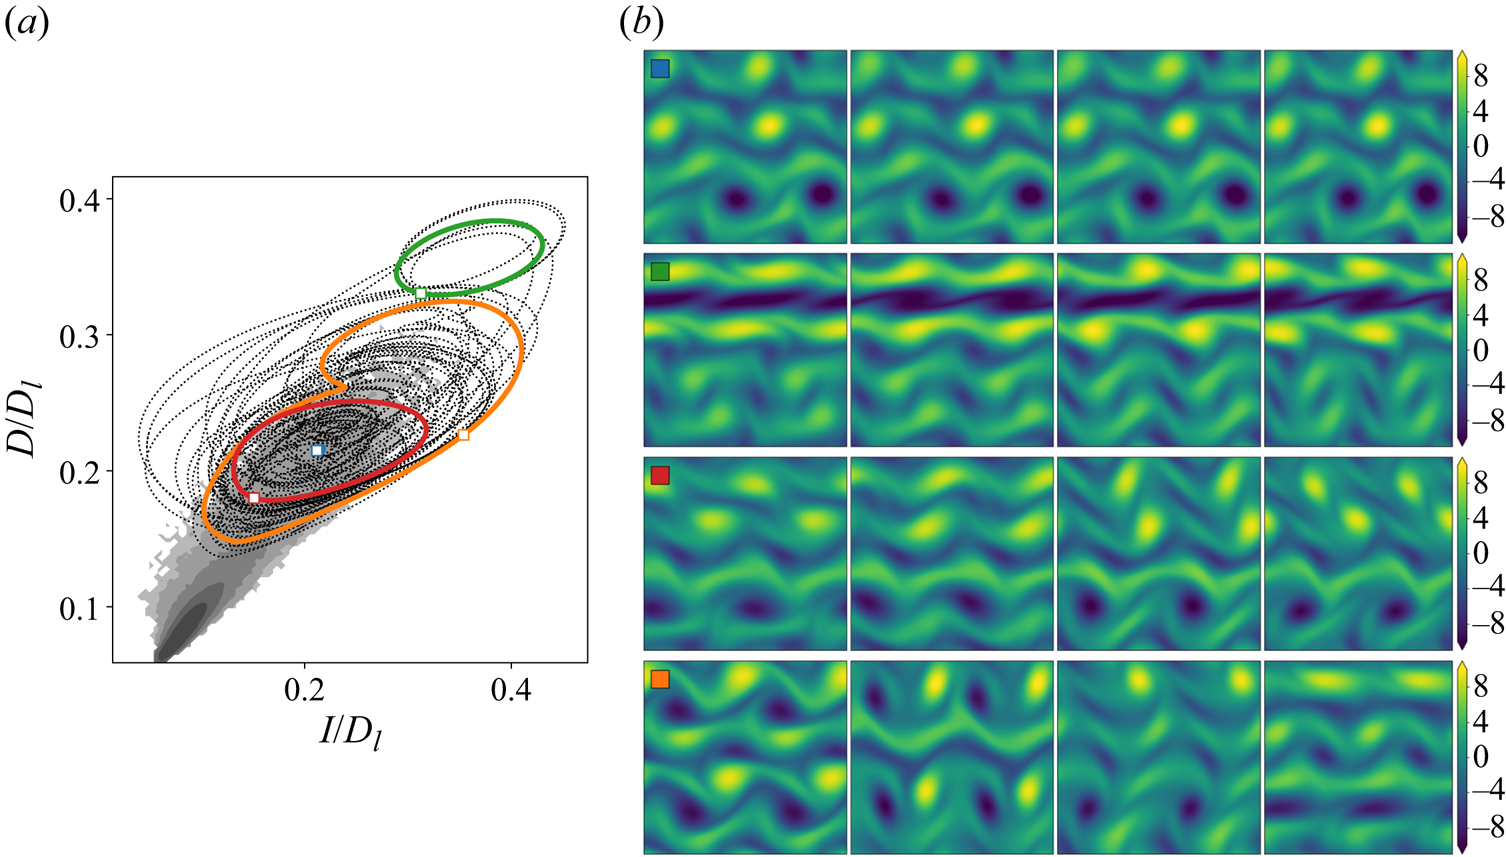
The 61  $l=2$ UPOs found at
 $Re=40$ involve various flow structures and can be split into groups with common vortex dynamics – some of these are highlighted in the panels on the right of figure 12. The examples shown in the figure include near-static vortex crystals with small motion of an isolated vortex, a strong band of negative vorticity that rapidly advects the weaker structures around it, co-rotating pairs of vortices and also the emergence of opposite-signed, co-travelling vortex pairs or dipole structures (see first panel in the final example in figure 12). We note that while the initial guesses are, to a good approximation, symmetric under half-domain shifts, the same is not true for most of the converged UPOs. Of the 61 solutions reported in figure 12, 45 are not two copies of a solution in an
 $L_x/2$ domain, though their variation over lengthscales
 $> L_x/2$ tends to be weak. This highlights the role of small-scale vortical structures in the burst and the relevance of smaller-scale UPOs in describing these events.
The search using projections onto  $l=3$ was almost as prolific, and resulted in
 $43$ high-dissipation periodic orbits, of which 20 were not symmetric under shifts by
 $L_x/3$, which are summarised in figure 13. Although these smaller-scale vortical structures play a role in the high-dissipation events, as evidenced by the strong
 $l=3$ projections in figure 9, they tend to occur alongside other larger-scale features, typically associated with patterns dominated by
 $l=2$. The production/dissipation rate projections of the
 $l=3$ UPOs reported in figure 13 are consistent with this: they almost all sit at much higher-dissipation values than those ever observed in a turbulent simulation, simply because they tend to feature very large numbers of high-amplitude vortices. These UPOs are clearly not visited regularly in our simulations but nevertheless might play a role in rare extreme dissipation events. In larger domains, they may also appear locally alongside lower dissipation states in the rest of the domain but this cannot be confirmed without doing simulations there, which is beyond the scope of this paper.
(a) Production/dissipation PDF of a long turbulent trajectory (contour levels spaced logarithmically with a minimum value  $10^{-6}$), with all 43 bursting periodic orbits found from
 $l=3$ projections at
 $Re=40$ (dotted lines). The laminar dissipation value
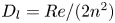 $D_l = Re/ (2 n^2)$. Four periodic orbits are highlighted in colour: blue
 $T=5.521$; orange
 $T=5.548$; red
 $T=2.636$ (note the very small loop cannot be seen clearly in the visualisation on the left); and green
 $T=3.456$. (b) Spanwise vorticity at points equispaced in time for the four highlighted UPOs, with
 $\Delta t = T/4$ and starting at the point indicated by the relevant marker in the left panel.

This multiscale, spatiotemporal ‘tiling’ of turbulence by smaller-scale UPOs hinted at here has been explored recently by Gudorf & Cvitanovic (Reference Gudorf and Cvitanovic2019) and Gudorf (Reference Gudorf2020) in the context of simpler dynamical systems (the Kuramoto–Sivashinsky equation), and further support for this picture is provided within the  $l=3$ solutions explicitly shown in figure 13 themselves. In particular, the third solution (highlighted by the red square) is itself multiscale: in the top half of the domain there is large
 $l=1$ dipole structure, whereas the lower half of the domain is made up of a triply periodic (three copies of the same pattern) train of vortices. The
 $l=1$ dipole propagates from the right to left, whereas the train of vortices moves in the other direction, the advection being driven primarily by a pair of opposite-signed, high-amplitude vortex sheets. Visually, the result looks like the superposition of a pair of counter-propagating travelling waves, with some small time-dependent motion in the vortex sheets.
The time series examined in figure 9 indicated that bursts at  $Re=40$ tend to be associated with both
 $l=2$ and
 $l=3$ together. We therefore performed an additional search using a combination of both subspaces together, with guesses generated via
 \begin{equation} \omega_g = \mathscr D(\mathscr P^{0}(\mathscr E(\omega)) + [\mathscr P^{2}(\mathscr E(\omega)) + \mathscr P^{3}(\mathscr E(\omega)) + \text{c.c.}]), \end{equation}
when both  $\beta _2(\omega )$ and
 $\beta _3(\omega )$ (3.14) were more than two standard deviations above the mean. This further search revealed another 45 solutions (of which only three were symmetric under half-domain shifts). These solutions are summarised in figure 14, and tend to overlap the high-dissipation region of the turbulent PDF more than the
 $l=2$ and
 $l=3$ guesses alone. Altogether, the combination of latent recurrent flow analysis and the hunt for bursting solutions has produced >200 unique UPOs.
(a) Production/dissipation PDF of a long turbulent trajectory (contour levels spaced logarithmically with a minimum value  $10^{-6}$), with all 45 bursting periodic orbits found from combined
 $l=2$,
 $l=3$ projections at
 $Re=40$ (dotted lines). The laminar dissipation value
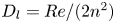 $D_l = Re/ (2 n^2)$. Four periodic orbits are highlighted in colour: blue
 $T=5.571$; orange
 $T=7.642$; red
 $T=4.216$; and green
 $T=7.231$. (b) Spanwise vorticity at points equispaced in time for the four highlighted UPOs, with
 $\Delta t = T/4$ and starting at the point indicated by the relevant marker in the left panel.

A similar search was conducted at  $Re=100$, resulting in 12 unique high-dissipation UPOs from latent wavenumber
 $l=2$ and one from an
 $l=2$ and
 $l=3$ combination (no solutions were found using the
 $l=3$ projections). Two-dimensional projections of all 13 of these UPOs are shown in figure 15 overlayed on the turbulent PDF. A larger proportion of these solutions (9 of the 13) retain symmetry under half-domain shifts. The most striking departure from the equivalent results at
 $Re=40$ is that all the converged UPOs have moved away from the (projection of) the attractor: the dissipation values for the UPOs are much higher than those typically observed on a turbulent orbit; the same behaviour as observed with
 $l=3$ at
 $Re=40$. The reason for is also the same: we rarely observe dominant
 $l=2$ structure in realistic turbulent snapshots at
 $Re=100$; for instance, note in figure 9 the continuing importance of the
 $l=1$ structures in the high-dissipation events. Instead, the increased importance of
 $l=2$ modes coincides with the appearance of smaller-scale, spatially localised flow structures.
(a) Production/dissipation PDF of a long turbulent trajectory (contour levels spaced logarithmically with a minimum value  $10^{-6}$), with all 13 bursting periodic orbits found from
 $l=2$ projections at
 $Re=100$ (dotted lines). The laminar dissipation value
 $D_l = Re/ (2 n^2)$. Four periodic orbits are highlighted in colour: blue
 $T=1.062$; green
 $T=1.684$; orange
 $T=2.901$; and red
 $T=4.499$. (b) Spanwise vorticity at points equispaced in time for the four highlighted UPOs, with
 $\Delta t = T/5$ and starting at the point indicated by the relevant marker in the left panel.

The snapshots from some of the  $Re=100$ UPOs shown in figure 15(a) all feature structures that are observed locally in turbulent snapshots, but all have a fundamental streamwise wavelength (or at least nearly) of
 $\lambda = {\rm \pi}$. In contrast to the
 $Re=40$ structures reported in figure 12, the vortices in the
 $Re=100$ UPOs tend to be larger in scale, some occupying
 $\sim$1/4 of the full domain, whereas the lower-
 $Re$ solutions still show the signature of the forcing in the vorticity equations. The dipoles seen at
 $Re=40$ are also largely absent in the
 $Re=100$ UPOs, which tend to be quasi-static crystals, or feature co-rotating pairs of vortices. The highest-dissipation state features a large band of vorticity which advects the other structures and is visually similar to the highest-dissipation structure seen at
 $Re=40$ in figure 12, though whether these are states from the same solution branch has not been explored.
4.3. Condensate UPO at $Re=400$

At the highest Reynolds number,  $Re=400$, even the high-dissipation events are dominated by
 $l=1$ patterns (see figure 9), consistent with the flow spending much of its time in a state dominated by a pair of opposite signed, large-scale vortices. We therefore do not attempt to find small-scale UPOs here, but instead take random snapshots and project onto
 $l=1$ (as described in 4.4) as initial guesses in the Newton solver. As expected, the success rate of this approach is very low, though we do find one UPO many times. This structure is shown in figure 16 and consists of a large, near-stationary pair of vortices with an undulating vortex sheet between them. This structure is reminiscent of the ‘unimodal’ state discussed in Kim & Okamoto (Reference Kim and Okamoto2010) who speculated that regardless of the forcing, such a universal solution always exists at high enough
 $Re$ in two dimensions. It is also, of course, consistent with the inverse cascade theory of two-dimensional turbulence (e.g. Kraichnan & Montgomery Reference Kraichnan and Montgomery1980). The universal nature of the flow state suggests that it is converging to an Euler solution as
 $Re \rightarrow \infty$. This would mean, for example, that the single-vortex-pair state becomes unpinned to the discrete translational symmetry in
 $y$ of the forcing function and so could drift around in both directions, i.e. there could be travelling wave states. This type of solution has been seen recently in Zhigunov & Grigoriev (Reference Zhigunov and Grigoriev2023) albeit at much higher
 $Re$ (
 $=10^5$) and a smaller-wavelength forcing which oscillates in both spatial directions.
Snapshots of vorticity spaced every  $T/5$ for the
 $l=1$ UPO found at
 $Re=400$. The period is
 $T=0.4826$, and there is a small shift
 $s=0.0174$.

5. Conclusion
In this study we have built deep convolutional autoencoders to construct low-dimensional representations of Kolmogorov flow for a range of Reynolds numbers,  $40 \leq Re \leq 400$. Our architecture and training protocol were motivated by both (i) a continuous symmetry in the flow and (ii) a desire to maintain accuracy in the embedding even at high-dissipation values. The resulting models were able to accurately reconstruct the original vorticity fields over all dissipation rates, even at the highest
 $Re=400$. We then applied latent Fourier analysis to our trained networks to demonstrate that the learned embeddings are based on a set of patterns associated with a small number of latent wavenumbers.
The latent representations of the turbulence were examined with dimensionality reduction techniques to reveal a single class of high-dissipation event at  $Re=40$, which is sufficiently different from the low-dissipation dynamics such that it appears ‘detached’ in low-dimensional visualisations. The
 $Re=40$ bursts coincide with a much-weakened projection onto the latent wavenumber
 $l=1$ and the emergence of small-scale vortices associated with
 $l=2$ and
 $l=3$. At
 $Re=100$, the same approach revealed that the high- and low-dissipation dynamics are no longer distinct and can be smoothly interpolated between in the latent space. High-dissipation bursts have a length scale commensurate with the domain size and show amplification in projections onto all
 $l \in \{1, 2, 3\}$. Finally, the highest
 $Re=400$ is completely dominated by a domain filling vortex pair, even during high dissipation bursts.
We then used the latent representations of turbulent trajectories to generate guesses for UPOs, initially by improving on a traditional recurrent flow analysis as  $Re=40$, but also by using individual latent wavenumbers to generate guesses for high-dissipation solutions. We found very large numbers of high-dissipation periodic orbits at
 $Re=40$ using both
 $l=2$ and
 $l=3$ (and their combination together) patterns as starting guesses. With the inclusion of
 $l=2$ the solutions appear to be close to high dissipation events in the full turbulence, whereas
 $l=3$ alone produced UPOs which are clearly off-attractor. This was also found with the high-dissipation, doubly periodic UPOs converged at
 $Re=100$, and is consistent with the bursting events there showing evidence of large-scale structure (
 $l=1$) in the latent projections. The outstanding question for future work is whether these UPOs still play some role in the dynamics, either as extremely rare excursions or perhaps realised locally in the flow in larger domains alongside other structures.
The results emphasise the utility of low-order representations learned using large neural networks in understanding complex spatiotemporal dynamics. A decomposition into latent Fourier modes is not only a useful interpretability tool for exactly what the learnt basis represents, but is also a powerful technique for isolating small-scale exact solutions which capture dynamical events observed locally in the full turbulence. With this picture, the challenge now is to find solutions which are themselves multiscale, or to understand the ‘rules’ by which smaller-scale UPOs can coexist alongside larger-scale events.
Acknowledgements
J.P. acknowledges support from a UKRI Frontier Guarantee Grant EP/Y004094/1. J.H. acknowledges the support of Cantab Capital Institute for the Mathematics of Information. M.P.B. acknowledges support from the Office of Naval Research (ONR N00014-17-1-3029) and the NSF AI Institute of Dynamic Systems (#2112085). We are grateful to all three referees for their very detailed reports which have substantially improved the manuscript.
Declaration of interests
The authors report no conflict of interest.
Appendix A. Network architecture and training
The changes in architecture relative to the simple feed-forward networks constructed in Page et al. (Reference Page, Brenner and Kerswell2021) can be summarised as follows.
(i) Replacing single convolutional layers with ‘dense blocks’ (Huang et al. Reference Huang, Liu, van der Maaten and Weinberger2017).
(ii) Placing batch normalisation layers between convolutions (Ioffe & Szegedy Reference Ioffe, Szegedy, Bach and Blei2015).
(iii) Using pure convolutions throughout without switching to fully connected blocks.
(iv) Using ‘GELU’ activation functions throughout the network (Hendrycks & Gimpel Reference Hendrycks and Gimpel2016), apart from the final (output) layer where
$\tanh$ is preferred.

Dense blocks (Huang et al. Reference Huang, Liu, van der Maaten and Weinberger2017, Reference Huang, Liu, Pleiss, Van Der Maaten and Weinberger2019) are groups of convolutional layers where the output of each convolution operation is concatenated with its input, so the number of feature maps after the convolution and concatenation is the sum of the feature maps in the input upstream and those of the convolutional layer. Thus, if the input to the convolution is an ‘image’  $\boldsymbol u$, which has shape
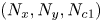 $(N_x, N_y, N_{c1})$, where
 $N_{c1}$ is the number of channels, and the convolution operation produces an ‘image’
 $\boldsymbol v$ with shape
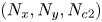 $(N_x, N_y, N_{c2})$, then after concatenation we have an image of shape
 $(N_x, N_y, N_{c1} + N_{c2})$. We apply ‘periodic’ padding to our images so that the discrete convolutions produce output with the same shape as the input. Our dense blocks always consist of three convolutional layers, where each convolutional layer adds 32 channels to the output. Thus, if the input to the dense block has shape
 $(N_x, N_y, N_c)$, the output has shape
 $(N_x, N_y, N_c + 3 \times 32)$. After the dense block we apply another convolutional operation to reduce the number of channels, typically to 32 (exact architecture is summarised below).
The ‘GELU’ activation function (Hendrycks & Gimpel Reference Hendrycks and Gimpel2016) was designed to overcome some known problems with the more widely used ‘ReLU’ activation function, particularly the occurrence of dead neurons within an architecture which are common in deep networks. This is done by removing the hard zero for negative inputs to the activation. The GELU activation is defined as
 \begin{equation} \text{GELU}(x) := x \varPhi(x), \end{equation}
where  $\varPhi (x) = \mathbb {P}(X \leq x)$, with
 $X \sim N(0,1)$ is the cumulative distribution function for the standard normal distribution. The alternative activation
 $\tanh (x)$ is used at the final output layer for a symmetric output that can match the normalised input to the network
 $\omega (x,y) / \omega _{{norm}} \in [-1, 1]$.
Our encoding architecture then consists of a repeated sequence of (i) convolution, (ii) dense block, (iii) max pooling, until the final encoding layer where an additional convolution is used to produce an ‘image’ of shape  $(4, 8, M)$, where
 $1 \leq M \leq 32$ is a specified number of feature maps. The final streamwise dimension (4) is selected in an attempt to minimise the maximum latent wavenumber required (i.e. to compress the input into large-scale patterns), whereas we retain eight cells in the vertical to match the shift-reflect symmetry in the system.
Overall, the network operations in the encoder can be summarised as follows:
 \begin{align} \omega &\to \text{PC}(8\times 8, 64) \to \text{DB}(8 \times 8) \to \text{MP}(2,2) \nonumber\\ &\to\text{PC}(4\times 4, 32) \to \text{DB}(4 \times 4) \to \text{MP}(2,2) \nonumber\\ &\to \text{PC}(4\times 4, 32) \to \text{DB}(4 \times 4) \to \text{MP}(2,2) \nonumber\\ &\to \text{PC}(2\times 2, 32) \to \text{DB}(2 \times 2) \to \text{MP}(2,2) \nonumber\\ &\to \text{PC}(2\times 2, 32) \to \text{DB}(2 \times 2) \to \text{MP}(2,1) \nonumber\\ &\to \text{PC}(2\times 2, 32) \to \text{DB}(2\times 2) \to \text{PC}(2\times 2, M ) \equiv \mathscr E(\omega), \end{align}
where the terms in brackets represent the size of the convolutional filters, followed by the number of feature maps, ‘PC’ standards for a ‘periodic convolution’ (periodic padding on the image), ‘DB’ for the dense block described above and ‘MP’ stands for ‘max pooling’ with the cell size given in brackets. The input vorticity is a single-channel image of size  $128\times 128$. The structure of the decoder is essentially the encoder described previously, reversed (upsampling layers replace max pooling, and the final output layer has a single feature map).
We tried many iterations of the architecture, including using fully connected layers near the encoding  $\mathscr E$ and using pure feed-forward networks. Generally dropping either the pure fully convolutional aspects or removing the dense blocks reduced performance, with an increase of roughly an order of magnitude in the loss function.
When training we found the results to be highly sensitive to the learning rate in the Adam optimiser (Kingma & Ba Reference Kingma and Ba2015). Values of  $\eta \in \{10^{-5}, 10^{-4}, 3\times 10^{-4}, 5\times 10^{-4}, 10^{-3} \}$ were tried and
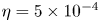 $\eta = 5\times 10^{-4}$ was universally the best performing choice across all values of
 $Re$ and encoding dimensions.
We trained each network for 500 epochs, training three identical architectures for most  $Re$ and
 $m$ and selecting the best performing (in terms of training loss). A batch size of 64 was used throughout. Overfitting was observed in around
 $1/3$ of cases, and we used early stopping based on the validation loss to extract the ‘best’ weights from within the training process.
Appendix B. Singular values within latent subspaces
We include here in figure 17 the singular values within each latent eigenspace  $0\leq l \leq 3$ for the network–
 $Re$ pairs considered in detail in this paper. These figures also indicate the approximate size of each degenerate eigenspace via the maximum value of the index
 $n$ on each horizontal axis.
Singular values associated with each latent wavenumber  $0\leq l \leq 3$ (left to right) for each network–
 $Re$ pair considered in detail. From top to bottom:
 $(Re, m)= (40,128)$;
 $(Re, m)= (100,512)$,
 $(Re, m)= (400,1024)$.


 Open access

