I. INTRODUCTION
Silicene is a two-dimensional (2D) one-atom-thick crystalline form of silicon, one of the most abundantly and widely used materials in the electronics industry. Reference Sadeghi, Sangtarash and Lambert1 Silicene is being studied with an effort to understand its thermoelectric properties and enhance the thermoelectric performance with an intention of designing silicon compatible electronic devices to utilize thermoelectric energy. Silicon in bulk has high thermal conductance which is less desirable for thermoelectric conversion. One promising route is to take advantage of reduced phonon thermal conductance in low dimensional materials which can be obtained by nanostructuring it to create nanoribbons. Reference Sadeghi, Sangtarash and Lambert1–Reference Nika and Balandin5 Thermal conductance reduction could be further engineered in porous silicene nanoribbons (SiNRs) since phonon thermal conductance is reduced in nanoporous semiconductors. Reference Sadeghi, Sangtarash and Lambert1,Reference Mingo and Broido6,Reference Lee, Gall and Grossman7 Additionally, its slightly buckled structure Reference Nakano, Mitsuoka, Harada, Horibuchi, Nozaki, Takahashi, Nonaka, Seno and Nakamura8–Reference Sadeghi15 opens up the possibility of a tunable bandgap Reference Ni, Zhong, Jiang, Quhe, Wang, Yang, Shi and Lu16 which is essential for a better value of Seebeck coefficient. The efficiency of a thermoelectric material is evaluated by the dimensionless figure of merit ZT which is expressed as ZT = S 2 GT/k, where S is the Seebeck coefficient, G is electrical conductance, T is temperature, and k is thermal conductance. Here, k is the summation of electron thermal conductance k e and phonon thermal conductance k ph. The quantity S 2 G is called the power factor (PF) which is a measure of output voltage and current. Thus, a large ZT requires high S, high G, and low k. However, these factors are correlated and thus require a delicate optimization to yield higher ZT values. Reference Qi, Wang, Zhang, Yang and Wang17
Researchers have theoretically investigated many different methods for modulating the geometry of one-dimensional (1D) nanostructures, including rough surface, Reference Liu and Chen18,Reference Sandhu, Seong and Sinha19 heterostructures, Reference Zhang, Yu, Wang and Li20 helical nanoconfiguration. Reference Varshney, Roy, Dudis, Lee and Farmer21 and double bend NWs. Reference Zhou and Yang22 Sadeghi et al. Reference Sadeghi, Sangtarash and Lambert1 have proposed the structure of nanoporous SiNRs with varying edge termination and concluded that the proper tuning of the Fermi energy can significantly improve the electronic thermoelectric figure of merit up to 160. [The electronic thermoelectric figure of merit is denoted by ZT e and is given by the equation ZT e = S 2 GT/k e.] Hochbaum et al. Reference Hochbaum, Chen, Delgado, Liang, Garnett, Najarian, Majumdar and Yang23 have experimentally proposed that by introducing roughened nanowires and reducing their diameter to an optimized value of 50 nm, the thermal conductance can be reduced to a certain extent which in turn yields a ZT of 0.6 at room temperature. Boukai et al. Reference Boukai, Bunimovich, Kheli, Yu, Goddard and Heath24 have studied the thermoelectric properties of pristine Silicon Nanowires (SiNWs) and showed that variation of the nanowire size and impurity doping levels could yield 100-fold improvement in ZT over bulk Si approaching a value of 1 at a temperature of 200 K. Pan et al. Reference Pan, Liu, Tan, Lv, Shi, Tang and Zheng25 have theoretically studied the thermoelectric performance of pristine armchair and zigzag SiNRs and predicted that by optimizing the doping level, width, and applied temperature, the ZT value of SiNRs could be enhanced to 4.9. Also, armchair SiNRs exhibit higher ZT values than zigzag SiNRs at room and higher temperatures. Reference Pan, Liu, Tan, Lv, Shi, Tang and Zheng25 Hossain et al. reported the successful introduction of rectangular pores of different dimensions in the armchair graphene nanoribbons. Their thermoelectric properties were studied for different pore dimensions characterized by the pore length and the pore width (which is basically a measure of adjacent channel width). This was done by varying the pore width for a particular pore length and then varying the pore length corresponding to the pore width at which maximum ZT was achieved. Thus, they were able to tune the pore to its optimal dimension which resulted in superior ZT which is six times higher than pristine GNRs. Reference Hossain, Dirini, Hossain and Skafidas2
As per literature, SiNRs have been synthesized on silver (111), Reference Vogt, Padova, Quaresima, Avila, Frantzeskakis, Asensio, Resta, Ealet and Lay10 gold (110), Reference Tchalal, Enriquez, Mayne, Kara, Roth, Silly, Bendounan, Sirotti, Greber, Aufray, Dujardin, Ali and Oughaddou26 iridium (111), Reference Meng, Wang, Zhang, Du, Wu, Li, Zhang, Li, Zhou, Hofer and Gao27 and zirconium diboride (0001). Reference Fleurence, Friedlein, Ozaki, Kawai, Wang and Takamura28,Reference Friedlein, Fleurence, Sadowski and Takamura29 The advancements in low energy electron diffraction, Reference Tchalala, Enriquez, Mayne, Kara, Dujardin, Ali and Oughaddou30 scanning tunneling microscopy, Reference Kara, Lalmi, Oughaddou, Enriquez, Vizzini, Ealet and Aufray31 and vapor liquid solid growth Reference Yang, Yuan and Tuan32 and the use of electroless etching Reference Hu, Peng, Qiao, Huang, Zhang, Sun, Meng and Lee33 have facilitated precise fabrication of SiNRs. In addition, some techniques like focused ion beam using high energy electron radiation Reference Li, Stein, McMullan, Branton, Aziz and Golovchenko34,Reference Lo, Aref and Bezryadin35 can be used to drill pores with precise atomic control.
II. THEORETICAL MODEL AND COMPUTATIONAL DETAILS
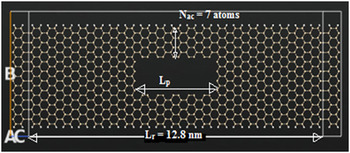
In the present work, enhancement of thermoelectric performance of SiNRs with introduction, dimensional tuning, and passivation of nanopores (NPs) has been studied. Nanoporous armchair SiNR with optimized lattice constant and buckling Reference Sadeghi, Sangtarash and Lambert1 of 3.6 and 0.53 Å, respectively, is shown in Fig. 1. The width W r and length L r of the ribbon are 3.8 nm (21 atoms wide) and 12.8 nm, respectively, while the pore dimensions are varied to achieve superior performance. By varying the number of atoms in the adjacent edges, which in turn is a measure of pore width, electrical conductivity could be improved with a significant reduction in the thermal conductance. These parameters in turn enhance the thermoelectric performance.
Atomistic model of silicene nanopore thermoelectric device.

We consider electrons transferring ballistically through the system assuming that electron-phonon scattering is reduced. The Hamiltonian H and overlap S ov matrices calculated from extended Huckel technique Reference Hossain, Dirini, Hossain and Skafidas2,Reference Kienle, Cerda and Ghosh36,Reference Landauer37 with Hoffman basis Reference Ni, Zhong, Jiang, Quhe, Wang, Yang, Shi and Lu16 are then solved using non-equilibrium Green function (NEGF) to yield the transmission co-efficient T(E) for electrons of energy E passing from the source to the drain via the relation Reference Sadeghi, Sangtarash and Lambert1,Reference Hossain, Dirini, Hossain and Skafidas2 :
 $$T\left( E \right) = {\rm{Trace}}\left[ {{\Gamma _{\rm{R}}}\left( E \right){G^{\rm{R}}}\left( E \right){\Gamma _{\rm{L}}}\left( E \right){G^{{\rm{R}}\dag }}\left( E \right)} \right]\quad .$$
In this expression, ΓL,R(E) = i(ΣL,R(E) − ΣL,R†(E)) describes the level broadening due to the coupling between the left and right electrodes and the central scattering region, where ΣL,R(E) denotes the retarded self-energies associated with this coupling and G R = (ES − H − ΣL − ΣR)−1 is the retarded Green function.
Once it is known, Seebeck coefficient S, electrical conductance G, and electronic contribution to thermal conductance k e can be calculated from the Taylor expansions of the following electrical and thermal current equations Reference Hossain, Dirini, Hossain and Skafidas2 :
 $${I_{\rm{E}}} = {{2e} \over h}\int {{\rm{d}}ET\left( E \right)\left[ \,{{f_{\rm{L}}}\left( E \right) - {f_{\rm{R}}}\left( R \right)} \right]} \quad ,$$
 $${I_{\rm{Q}}} = {{2e} \over h}\int {{\rm{d}}ET\left( E \right)\left[ {{f_{\rm{L}}}\left( E \right) - {f_{\rm{R}}}\left( E \right)} \right]\left( {E - \mu } \right)\quad ,}$$
where e is the electric charge of carriers and f L and f R are the distribution function of left and right reservoirs with chemical potentials μL and μR with μ, respectively, being the average chemical potential Reference Hossain, Dirini, Hossain and Skafidas2,Reference Esfarjani, Zebarjadi and Kawazoe38 :
 $$G = {\left. {{I \over {\Delta V}}} \right|_{\Delta T = 0}} = {q^2}{L_0}\quad ,$$
 $$S = {\left. { - {{\Delta V} \over {\Delta T}}} \right|_{I = 0}} = {{{L_1}} \over {qT{L_0}}}\quad ,$$
 $${k_{\rm{e}}} = {\left. {{{{I_Q}} \over {\Delta T}}} \right|_{IE = 0}} = {{{L_2} - {{L_1^2} \mathord{\left/ {\vphantom {{L_1^2} {{L_0}}}} \right. \kern-\nulldelimiterspace} {{L_0}}}} \over T}\quad ,$$
Here, L n , defined in the linear response from T(E), is as follows:
 $${L_n} = {2 \over h}\int {{\rm{d}}ET\left( E \right)\left( { - {{\partial f\left( E \right)} \over {\partial E}}} \right){{\left( {E - \mu } \right)}^n}} \quad .$$
In this equation, f(E) is Fermi–Dirac probability distribution function (f = 1 + exp((E − μ)/k B T)−1). Reference Sadeghi, Sangtarash and Lambert39
The Green’s function and transmission T ph(ω) can be calculated similarly for phonon transport just by substituting H by a force constant matrix K and S ov by a diagonal matrix of atomic mass M. The term ∂n/∂ω is the derivative of the Bose–Einstein distribution for phonons. Reference Hossain, Dirini, Hossain and Skafidas2 To calculate the force constant matrix for phonons, empirical Brenner potential was used. The phononic contribution to the thermal conductance is given by the following equation Reference Landauer37 :
 $${k_{{\rm{ph}}}} = {{{h^2}} \over {2\pi {k_{\rm{B}}}{T^2}}}\int {{\rm{d}}\omega {\omega ^2}{T_{{\rm{ph}}}}\left( \omega \right)\left( {{{\partial n} \over {\partial \omega }}} \right)} \quad .$$
Before transport calculations, each structure is optimized and its atom coordinates are relaxed, so that the forces on individual atoms are minimized to be smaller than 0.01 eV/Å. For all the calculations, the temperature was set at 300 K.
III. RESULTS AND DISCUSSIONS
As shown in Fig. 1, the pore has two important parameters that can be optimized for superior thermoelectric performance; its length (L p) and its width which in turn decide the number of atoms across the width of the upward and downward symmetric adjacent channels (N ac) formed due to the pore.
The first part of the paper deals with tuning for an optimal pore size which results in enhancement of ZT for unpassivated pore edges, and in the second part, we will study the effect of pore passivation on these structures.
A. Pore width dependence
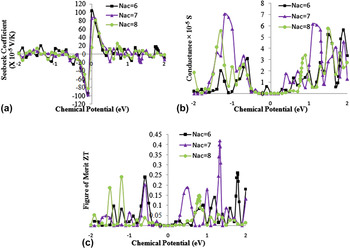
Three cases of silicene device with different adjacent channel widths—6 atoms, 7 atoms, and 8 atoms corresponding to 3p, 3p + 1, and 3p + 2 series of AGNRs, respectively—are being considered, where p is an integer. We first calculate the transmission function T(E) and then determine the thermoelectric transport coefficients, i.e., electrical conductivity and Seebeck coefficient based on Eqs. (4) and (5). We then plot these coefficients as a function of chemical potential shown in Fig. 2.
Chemical potential-dependent (a) Seebeck coefficient, (b) electronic conductance, and (c) thermoelectric figure of merit.

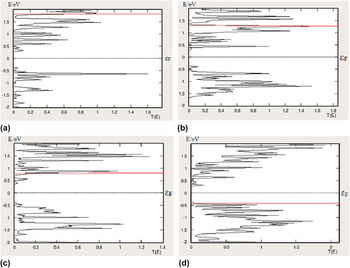
The transmission spectra of the SiNR–NP devices with N ac values of 3p, 3p + 1, 3p + 2, and no-pore with energies of [−2.0, 2.0] eV are shown in Fig. 3. Conductance depends on the overlap of the Fermi window and the transmission spectra, while for Seebeck coefficient, transmission spectrum is weighted by the difference between the energy of conducting electron and chemical potential. Reference Hossain, Dirini, Hossain and Skafidas2 As there is a sharp compromise between the two, the shape of the transmission spectra needs to be optimally controlled. By using the optimal pore dimensions, the shape of the transmission spectra can be controlled to get the best performance. The overlap region in case of 3p + 1 series [Fig. 3(b)] is the maximum implying in maximum conductance followed by 3p + 2 and 3p, while (E − μ) term is dominating in 3p series [Fig. 3(a)] with the maximum Seebeck coefficient followed by 3p + 1 and 3p + 2 series. The highest Seebeck coefficient obtained is 103.7 × 10⁻⁵ V/K for N ac = 6, while the highest conductance is 7.06 × 10⁻⁵ S for N ac = 7.
Transmission spectra for SiNR–NP devices with a N ac value of (a) 3p, (b) 3p + 1, and (c) 3p + 2 and for a (d) SiNR with no pore. Here, the solid line shows the chemical potential at which maximum ZT is achieved. It is at 1.79 eV, 1.33 eV, 0.80 eV, and −0.42 eV, respectively.

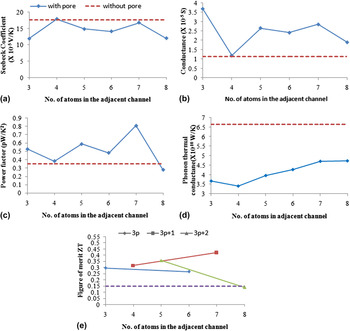
Figure 4 plots the thermoelectric coefficients as a function of the number of atoms in the adjacent channels. In Figs. 4(a) and 4(b), the straight dotted line denotes the value of S and G for a SiNR without any pore. For S, it lies above than that of a pore, while it is always below than that of the pore in case of G. Thus, when we plot the power factor (S 2 G), we achieve better performance than that of SiNRs without a pore for all the adjacent channel width values being maximum when N ac is 7 atoms, as shown in Fig. 4(c). In addition to this, SiNR–NP also exhibits significantly lower thermal conductance than SiNR without a pore [Fig. 4(d)]. Also, it increases with the increase in N ac. The fact behind this is to increase the number of paths for the phonons to flow through.
(a) Seebeck coefficient, (b) conductance, (c) power factor, (d) phonon thermal conductance, and (e) figure of merit ZT for SiNR–NP devices plotted against the number of atoms in their adjacent channels.

This improvement in power factor and the reduction in thermal conductance contribute to enhancement in ZT than conventional SiNRs of the same dimension. The improvement of ZT for the three series of N ac (3p, 3p + 1, and 3p + 2) is shown in Fig. 4(e). Two points joined by a straight line is showing each series, while the straight dotted line denotes its value for a SiNR without any pore. It is clear from the figure that ZT exhibits a peak value when N ac is 3p + 1 and a minimum value when N ac is 3p + 2.
B. Pore length dependence
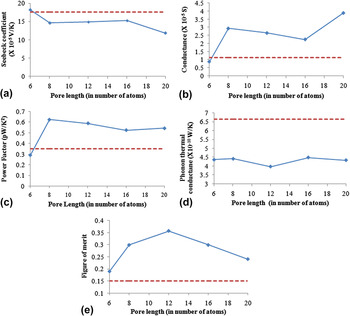
The length of the pore is varied keeping the width of the pore fixed at N ac = 7, as maximum ZT was achieved for this case. For different pore lengths, the values of S and G are calculated for the position of μ which results in maximum ZT, as shown in Fig. 5. Here, the dotted line represents SiNR without any pore. As clear from Fig. 5(c), SiNR–NP has significantly better power factor due to higher G [Fig. 5(b)] values in comparison to no pore. On the other hand, k ph has a very little dependence on pore length [Fig. 5(d)] verifying the ballistic model of phonon transport. This combination of improvement in power factor and the reduction in thermal conductance enhances ZT as compared to pristine SiNRs of the same specification, as shown in Fig. 5(e).
(a) Seebeck coefficient, (b) conductance, (c) power factor, (d) phonon thermal conductance k ph, and (e) figure of merit ZT for various pore lengths of SiNR–NP with a fixed optimal width (N ac = 7).

C. Effect of pore edge passivation
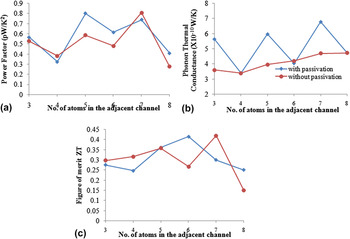
The surface edges of the incorporated pores of the above studied structures are passivated with hydrogen to study their influence. Hydrogen has been chosen for passivation because of its ability to increase the structural stability. Reference Pan, Liu, Tan, Lv, Shi, Tang and Zheng25 Although the power factor and ZT do not show any particular trend with passivation, the interesting point is that the thermal conductance is exhibiting an oscillating behavior, as shown in Fig. 6(b). For N ac = 3, 5, and 7, the k ph with passivated pores is higher as compared to the unpassivated ones, while for N ac = 4, 6, and 8, there is weak dependence on k ph. This observation is varied from that of nanoporous crystalline silicon, whose k ph is significantly reduced upon pore edge passivation due to enhanced phonon scattering. Reference Jin and Laurent40 But it is in accordance with the k ph dependence on edge passivation, which significantly improves the k ph from 5.3 × 10⁻¹⁰ W/K to 6.87 × 10⁻¹⁰ W/K in case of pristine SiNRs, as calculated in our work. The increase in k ph with pore edge passivation can be attributed to the fact that the phonon-edge scattering becomes the dominant scattering mechanism suppressing the phonon–phonon scattering Reference Hu and Maroudas41 as already observed for alternate odd-membered rings. Reference Lehmann, Ryndyk and Cuniberti42
(a) Power factor, (b) phonon thermal conductance, and (c) figure of merit plotted against the number of atoms in the adjacent channel for without (circles) and with (squares) hydrogen passivation.

D. Temperature dependence
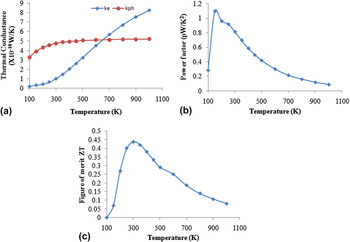
The effect of temperature on our model device has also been studied assuming that electron–phonon and electron–electron interactions are neglected. The phonon thermal conductance is increased marginally with temperature [Fig. 7(a)]. It is observed that there is a rise in value of electrical thermal conductance with rise in temperature, while the power factor shows a decreasing trend with rise in temperature after 150 K [Fig. 7(b)]. Due to the temperature term in the numerator of ZT, it increases with temperature at low temperature levels till 250 K and then begins to decrease sharply at higher temperature levels, as shown in Fig. 7(c).
Effect of temperature on (a) thermal conductance due to electrons (k e) and phonons (k ph), (b) power factor, and (c) thermoelectric figure of merit ZT.

E. Ribbon length dependence
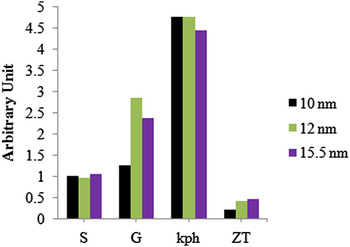
In this section, we keep the size of the pore fixed at an optimal value, for which the maximum ZT was achieved, and vary the length of the ribbon and conduct the similar analysis to evaluate performance. Three different lengths of 10, 12, and 15.5 nm are considered here. The values of S, G, k ph, and ZT for that position of μ which results in maximum ZT are then compared, as shown in Fig. 8. The consistent values of S (16.8–18.5 × 10⁻⁵ V/K) and k ph (4.45–4.78 × 10⁻¹⁰ W/K) suggest an appealing application for overcoming variation in length defects. Also, it is hereby observed that the figure of merit is increasing with the increase in length of the ribbon.
Effect of variation in length of ribbon on the thermoelectric coefficients. Value of Seebeck coefficient for 10 nm is normalized to 1, while for other lengths, it is normalized relatively to 10 nm. G, k ph, and ZT are the actual values.

The present theoretical calculations demonstrate that for SiNRs, the 3p + 1 series exhibits the best thermoelectric performance, while the 3p + 2 series shows the lowest performance. Thus, the order of thermoelectric performance of these series is:
 $$3p + 1 > 3p > 3p + 2\quad ,$$
which is in accordance with their bandgap order. Reference Pan, Liu, Tan, Lv, Shi, Tang and Zheng25 For GNRs, the order of the performance of these series is different, which is
 $$3p + 1 > 3p + 2 > 3p\quad ,$$
as was observed by Hossain et al. Reference Hossain, Dirini, Hossain and Skafidas2 Another difference between the thermoelectric performance of SiNRs and GNRs is the temperature range in which these materials can be utilized. Although graphene is a better option over silicene in terms of higher values of ZT and over a wider temperature range, our study shows that silicene could be an ideal substitute material for thermoelectric sensors and other applications at smaller temperature range extending till 250 K.
IV. CONCLUSION
In this paper, we have analyzed the effect of various pore dimensions on the thermoelectric performance of SiNR–NP devices. Our study exhibits that the thermoelectric performance of the nanostructure is dependent on the width of the adjacent channels and the pore length. This implies that the transmission spectra can be tuned by varying the number of atoms across the width of the adjacent channel and length of the pore which in turn controls the Seebeck coefficient and conductance to achieve better thermoelectric performance. By using the optimal values for the pore dimensions, we could attain a ZT value that is approximately 3 times higher than that of a SiNR without a pore. It can be concluded from the study that thermoelectric performance of SiNRs can be improved by engineering the dimensions and their passivation. The study also indicates that SiNR is a suitable material for appealing thermoelectric applications.