Introduction
Pure Mg has the characteristics of low density (1.74 g/cm3), high hydrogen storage capacity (7.6 wt%), and low cost. Although pure Mg is a highly anticipated hydrogen storage material, its hydrogen absorption and desorption conditions are more stringent. This is because reaction temperature and the pressure of H2 must be 300–400 °C and 20 atm above, respectively, to generate MgH2 hydride [Reference Seiler, Schlapbach, Waldkirch, Shaltiel and Stucki1]. Mg2Ni alloy can react with hydrogen to produce Mg2NiH4 at 200 °C and pressure of 14 atm. The stability of Mg2NiH4 is lower than that of MgH2, but the reaction rate of the former is faster. The hydrogen storage kinetics of Mg2Ni is better than that of pure Mg. However, maximum hydrogen storage capacity of Mg2Ni is only 3.6 wt% [Reference Reilly and Wiswall2]. Mg2Ni phase combined with Mg has the characteristics of decomposing hydrogen molecules, which can easily diffuse hydrogen atoms into pure Mg and improve the hydrogen absorption and desorption kinetics of pure Mg. Due to the high hydrogen storage capacity of Mg, the Mg in eutectic Mg–Ni alloy can be fully hydrogenated, which increases the hydrogen storage capacity of the alloy [Reference Yim, You, Na and Bae3]. The hydrogen storage capacity of fully activated Mg85Ni15 and Mg75Ni25 alloys prepared by ball milling can reach 4.7 wt% under 12 atm H2 at 300 °C and the hydrogenation time is about 60 s. At 150 °C and 12 atm H2, the hydrogen storage capacity of Mg85Ni15 alloy still has about 4.3 wt% [Reference Liang, Boily, Huot, Neste and Schulz4]. Although hydrogen storage capacity of Mg85Ni15 is better than that of pure Mg, this capacity is still less than the hydrogen storage targets of U.S. Department of Energy (DOE) [Reference Satyapal, Petrovic, Read, Thomas and Ordaz5].
Due to their excellent hydrogen storage characteristics, in the past years, the third and fourth elements such as Cr, Mn, Al, and Cu have been added to Mg–Ni alloys to improve the hydrogen absorption and desorption kinetics [Reference Yang, Yuan, Ji, Sun, Zhou and Zhang6, Reference Song, Kwon, Bae and Hong7]. Although Li has high volatility [Reference Chuntonov, Setina, Ivanov and Permikin8], its hydride is very stable and the enthalpy is as high as 180 kJ/mol H2. The decomposition temperature is 550 °C [Reference Gupta and Gupta9], lowering its practicability. However, high hydrogen storage capacity (about 12.68 wt%) and low density (0.534 g/cm3) make it an attractive candidate for being added to Mg–Ni alloys [Reference Liang10, Reference Nachman and Rohy11]. The hydrogen storage capacity of Mg0.8Ni0.1Li0.1 alloy at 310 °C and 41 atm H2 is only 2.04 wt%. The reason for low hydrogen storage capacity of this alloy has not be studied in-depth [Reference Nachman and Rohy11].
As mentioned above, Ni and Mg2Ni have the ability to decompose hydrogen molecules, so that the hydrogen atoms easily diffuse into pure Mg and enhance catalytic activity to improve the hydrogen storage kinetics of the pure Mg. In the present work, the as-cast hypereutectic Mg–Ni alloy was added with Li to investigate the hydrogen storage properties of Mg–Ni alloy through the fully activation and pressure–composition isotherm (PCI) measurement and microstructure examination.
Results and discussion
Structural analysis
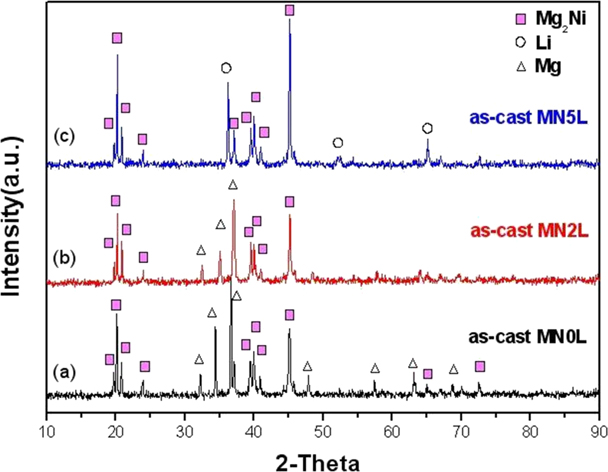
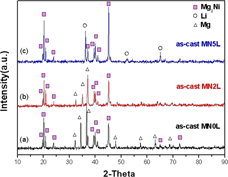
It is inferred from the Mg–Ni binary phase diagram [Reference Nayeb-Hashemi and Clark12] that the as-cast structure of the alloy MN0L consists of the primary Mg2Ni and eutectic Mg2Ni–Mg. Figure 1 shows the X-ray diffraction (XRD) analysis of the as-cast alloys MN0L, MN2L, and MN5L. The diffraction peak of as-cast alloy MN0L is completely consistent with the structure of Mg2Ni and Mg, as presented in Fig. 1(a). Figure 1(b) shows that the structure of Mg2Ni and Mg are still present in the as-cast alloy MN2L, but a shift of diffraction peak of Mg to higher angle occurred. This is because of the presence of few Li atoms in Mg matrices and form Mg(Li) solid solution. The atomic radii of Mg and Li are 0.16 nm and 0.152 nm, respectively. The difference in atomic radius led to a decrease in lattice parameters. The lattice parameters a = 3.21 Å and c = 5.21 Å were reduced to 3.17 Å and 5.12 Å, respectively. On the other hand, variation in lattice parameters could not be found in the Mg2Ni phase. It could be inferred that Li atoms were absent in the Mg2Ni phase.
The XRD patterns for as-cast alloys (a) MN0L, (b) MN2L, and (c) MN5L.
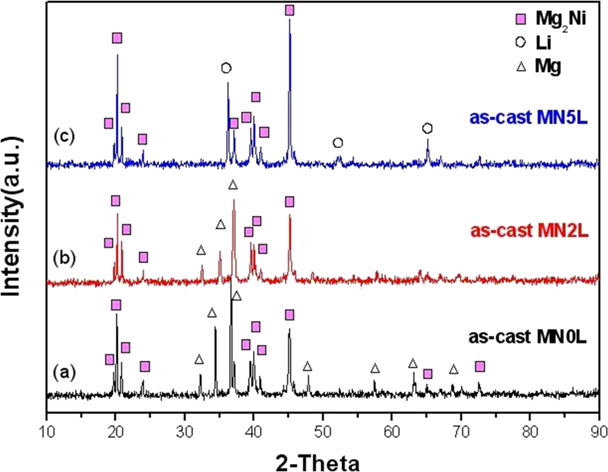
Due to a large amount of Li in the alloy MN5L, Mg(Li) solid solution may be converted to Li(Mg) solid solution, as inferred from Mg–Li binary phase diagram [Reference Massalski, Murray, Benett and Baker13]. Figure 1(c) shows that diffraction angle of Mg2Ni phase and Li phase in the alloy MN5L was almost consistent with that of pure Mg2Ni phase and Li phase. The lattice parameters of Mg2Ni and Li was still a = 5.21 Å, c = 13.24 Å and a = 3.51 Å, respectively. That is, Li and Mg2Ni have no significant solid solution phenomenon.
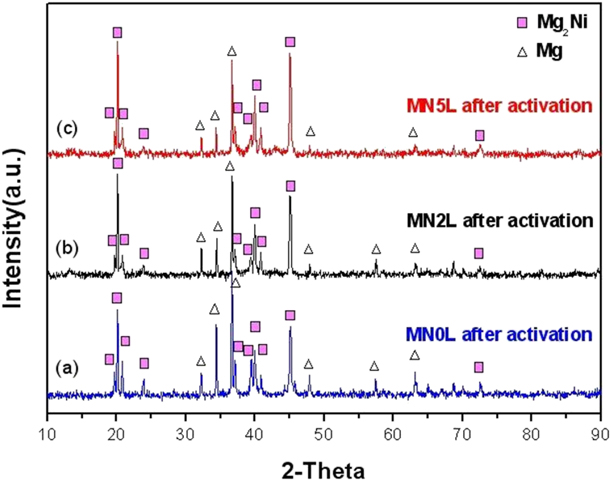
Figure 2 shows the XRD pattern of the as-cast alloys MN0L, MN2L, and MN5L after full activation (300 °C, 40 atm H2, 12 cycles). Figure 2(a) shows that the diffraction peaks of Mg and Mg2Ni phases in fully activated alloy MN0L are still consistent with those in alloy MN0L before full activation. Figure 2(b) shows that the diffraction peaks of Mg(Li) solid solution in as-cast alloy MN2L shifted to higher angle were back to the diffraction peak positions of pure Mg after full activation. The lattice parameters of Mg(Li) from 3.17 Å of the a-axis and 5.12 Å of the c-axis backed to 3.21 Å of the a-axis and 5.21 Å of c-axis of pure Mg. In addition, lattice parameters were not changed in the Mg2Ni phase, indicating that the Li atom was no longer present in the Mg lattice. Figure 2(c) shows that fully activated alloy MN5L also shows similar results as fully activated alloy MN2L.
The XRD patterns of alloys (a) MN0L, (b) MN2L, and (c) MN5L after full activation.

As discussed above, Mg(Li) and Li(Mg) solid solutions were converted into pure Mg crystal structure in alloys MN2L and MN5L after fully activated. Lithium was fully volatilized after full activation.
Hydrogen absorption and desorption characteristics of fully activated alloys
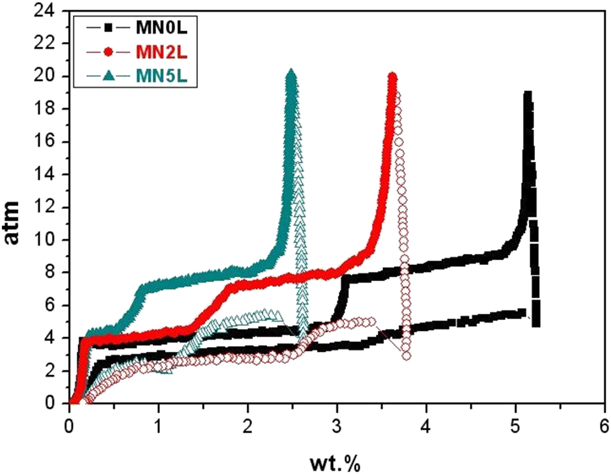
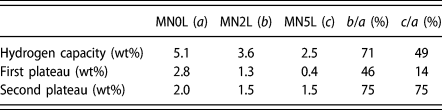
Figure 3 shows PCI curves for the fully activated alloys MN0L, MN2L, and MN5L tested at 300 °C and 20 atm H2. The hydrogen absorption capacity, the first hydrogen absorption plateau, and the second hydrogen absorption plateau are listed in Table I. The hydrogen storage capacity of the alloy MN0L was 5 wt%, as shown in Table I. Unfortunately, the hydrogen storage capacities of alloys MN2L and MN5L were only 3.6 wt% and 2.5 wt%, respectively. As discussed in structural analysis, the lattice structure of alloys MN2L and MN5L was similar to that of alloy MN0L after full activation. However, the full activated alloys MN2L and MN5L had lower hydrogen storage capacities.
PCI curves of fully activated alloys at 300 °C and 20 atm H2.
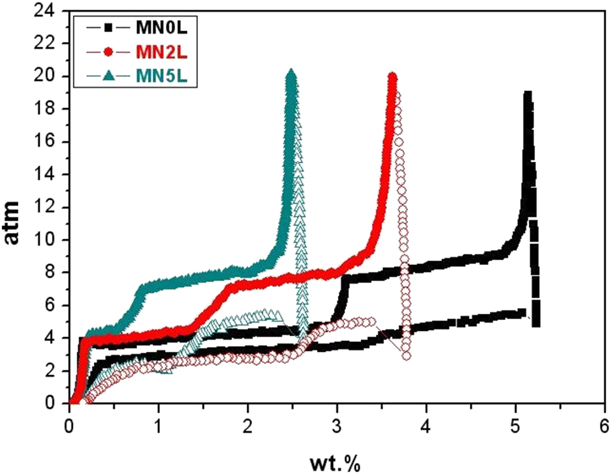
Hydrogen plateau length of fully activated alloys at 300 °C, 20 atm H2.

Figure 3 shows that the full activated alloys MN0L, MN2L, and MN5L produced a bi-plateau region during the hydrogen absorption process, indicating that at least two or more hydrogenated phases in the alloys. Liang [Reference Liang10] pointed out that in the eutectic Mg–Ni alloy, the first plateau is hydrogen absorption reaction of Mg and the second plateau is hydrogen absorption reaction of Mg2Ni. The hydrogenation of Li was not observed in Fig. 3 because the Li had almost completely volatilized in the fully activated alloy, as discussed in structural analysis.
Table I shows that the length of the first plateau of fully activated alloy MN2L (1.3 wt%) was much lower than that of fully activated alloy MN0L (2.8 wt%), indicating that the hydrogen absorption capacity of Mg of the former was only 46% of the latter. The length of the second plateau of fully activated alloy MN2L (1.5 wt%) was also lower than that of fully activated alloy MN0L (2.0 wt%), indicating that the hydrogen absorption capacity of Mg2Ni of the former was only 75% of the latter. When the content of Li in Mg82Ni18 alloy increased to 5 wt%, the length of first plateau was reduced to 0.4 wt%, only 14% of alloy MN0L, and the length of the second plateau was 75% of the alloy MN0L. It is noted that a reduction in hydrogen absorption capacity of Mg was more serious than that of Mg2Ni. However, the addition of Li to Mg82Ni18 alloy led to a decrease in the hydrogen absorption capacity. Further XRD analysis of fully activated alloys MN0L, MN2L, and MN5L was carried out to investigate this phenomenon.
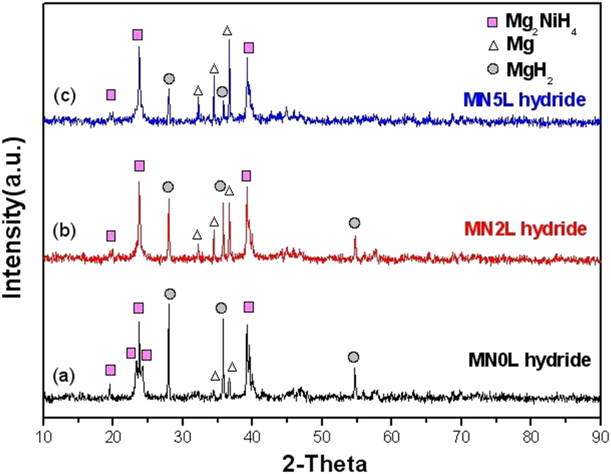
The alloys MN0L, MN2L, and MN5L were fully activated at 300 °C under 40 atm H2 and then were placed at 40 atm H2 and 300 °C for 2 h. The vacuum (10−2 torr) was executed after cooling down to room temperature and then took out the powder for XRD analysis. Figure 4 shows that fully activated alloy MN0L was fully hydrogenated to form MgH2, Mg2NiH4, and Mg after 40 atm H2 and 300 °C for 2 h. The remaining Mg implied that some of the eutectic Mg could not be catalyzed by Mg2Ni to absorb hydrogen.
The XRD patterns of fully activated alloys (a) MN0L, (b) MN2L, and (c) MN5L under 40 atm H2 and 300 °C for 2 h.
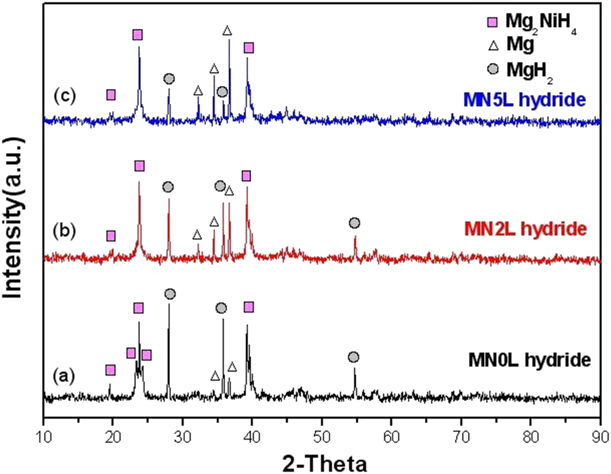
When the content of Li in Mg82Ni18 alloy increased, the diffraction peak intensity of MgH2 phase decreased and the diffraction peak intensity of Mg phase increased, as shown in Fig. 4. The diffraction peak of this Mg phase was consistent with that of pure Mg. In addition, Li hydride could not be found in Fig. 4. It is clear that Li had been fully volatilized during the full activation, and the Mg2Ni phase could not effectively catalyze eutectic Mg to generate hydride at 300 °C. The volatilization of Li led to an increase of remaining eutectic Mg. However, after volatilization of Li, more eutectic Mg could not be catalyzed by Mg2Ni, lowering hydrogen absorption capacity. That is why the length of the first plateau of the fully activated alloys MN2L and MN5L was shorter than that of fully activated alloy MN0L, as presented in Fig. 3.
Eutectic Mg–Mg2Ni catalytic model
The structure of Li-containing Mg82Ni18 alloy had been converted to that of Li-free Mg82Ni18 alloy after full activation. Although alloys MN0L, MN2L, and MN5L after full activation had the same composition, the hydrogen storage capacity of the former was superior to that of the latter two. Increasing Li content to Mg82Ni18 alloy increased the intensity of diffraction peak of Mg and decreased that of MgH2.
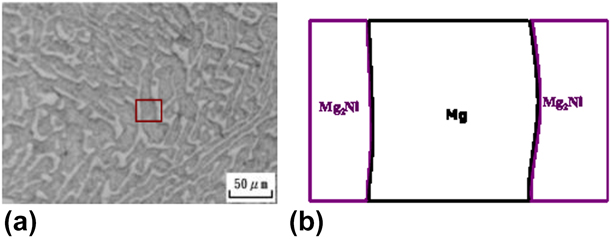
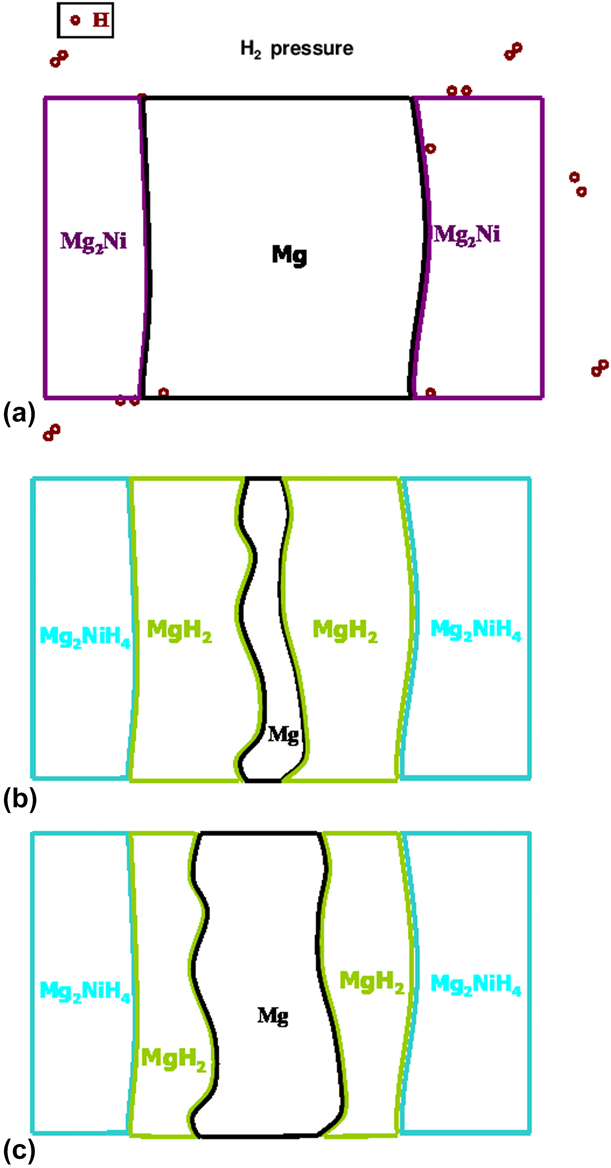
In the present work, eutectic Mg–Mg2Ni catalytic model was proposed to explain this phenomenon. Figure 5(a) shows the eutectic microstructure of alloy MN0L: the white areas are eutectic Mg2Ni, and the dark gray areas are eutectic Mg. Figure 5(b) presents the schematic representation of the magnification of the red frame area in Fig. 5(a). Based on Fig. 5(b), we drew Fig. 6 to demonstrate eutectic Mg–Mg2Ni catalytic model of the experimental alloys.
(a) Microstructural images and (b) schematic representation of alloy MN0L.

Schematic representation of (a) eutectic Mg–Mg2Ni alloy after full activation, (b) fully activated alloy MN0L after hydrogenation, and (c) fully activated alloy MN5L after hydrogenation.
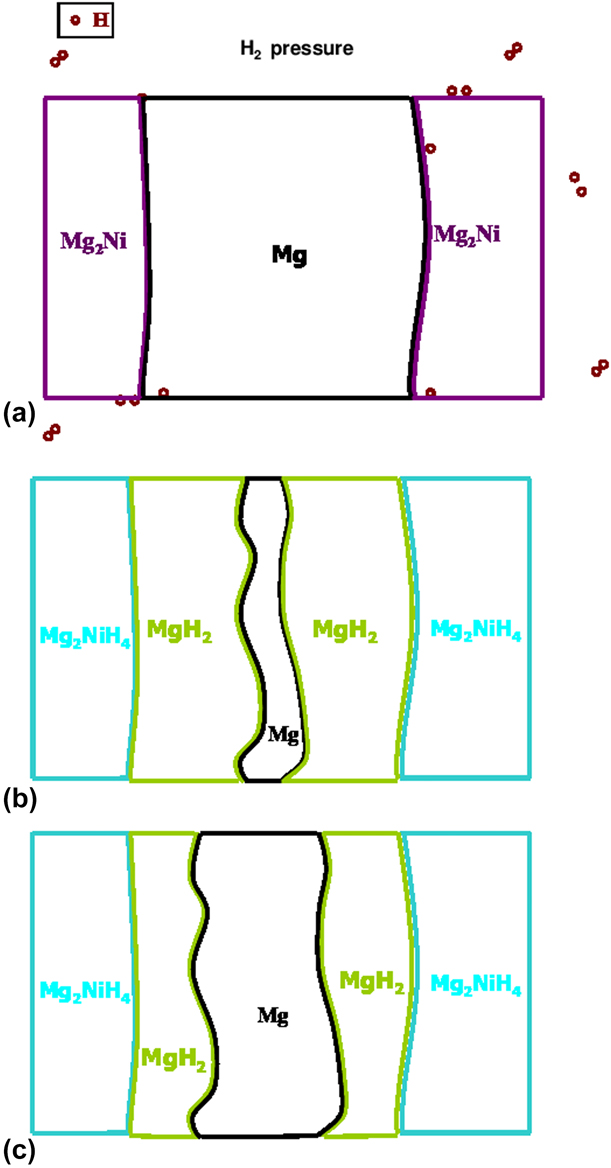
Yim [Reference Yim, You, Na and Bae3] pointed out that when Mg2Ni combined with Mg, Mg2Ni phase have the catalytic effect on decomposition of hydrogen molecules. These hydrogen atoms converted from hydrogen molecules easily diffused into pure magnesium. Figure 6(a) shows that the hydrogen molecules decomposed into hydrogen atoms by Mg2Ni phase during full activation. The area of eutectic Mg in fully activated alloy MN0L was smaller than that in fully activated alloy MN5L after hydrogenation, as shown in Figs. 6(b) and 6(c). This is because the volatilization of Li weakened the bonding between eutectic Mg and Mg2Ni, lowering the catalytic effect of Mg2Ni on Mg. The distance of eutectic Mg catalyzed by Mg2Ni decreased. Therefore, the area of remaining Mg in full activated alloy MN5L was larger than that in full activated alloy MN0L after hydrogenation. Eutectic Mg–Mg2Ni catalytic model could be used to explain why the length of the first plateau of alloy MN5L was shorter than that of alloy MN0L after full activation.
Volatilization of Li
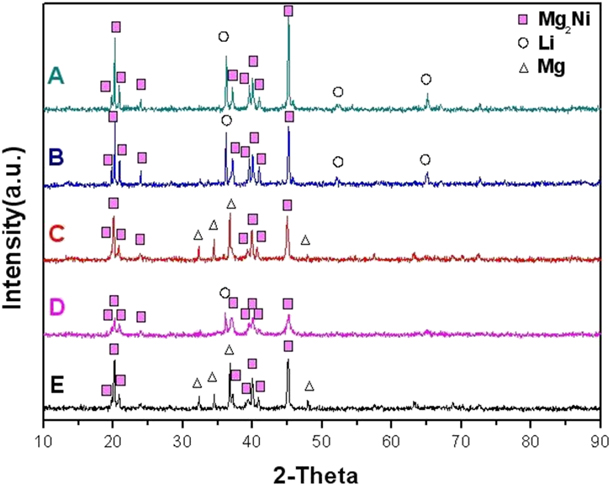
The XRD analysis of the as-cast alloy MN5L before and after ball milling was carried out to investigate the volatilization of Li. The time for grinding in ball mills was 3 h. The as-cast alloy MN5L was composed of Li and Mg2Ni, as shown in Fig. 7(a). Figure 7(b) shows that the alloy MN5L still contained Li and Mg2Ni phase under vacuum condition (10−2 torr) and 300 °C for 24 h. When the alloy powder was placed at 300 °C and 40 atm H2 for 24 h, the diffraction peaks were shifted to Mg and Mg2Ni phases, as shown in Fig. 7(c). It is clear that after hydrogenation, the structure of alloy MN5L was converted to that of Mg82Ni18 alloy without Li. Figure 7(d) presents that alloy MN5L after ball milling for 3 h still contained Li and Mg2Ni. Figure 7(e) shows that the structure of alloy MN5L powder was converted to that of Li-free alloy Mg82Ni18 under vacuum condition (10−2 torr) and 300 °C for 24 h.
The XRD patterns of alloy MN5L (a) in as-cast condition, (b) at 300 °C and 10−2 torr, (c) at 300 °C and 40 atm H2, (d) ball milled for 3 h, and (e) ball milled for 3 h at 300 °C and 10−2 torr.

As observed above, the structure of both as-cast alloy MN5L and alloy MN5L in powder form under vacuum condition (10−2 torr) and 300 °C for 24 h was converted to that of Li-free Mg82Ni18 alloy. Under vacuum condition (10−2 torr) and 300 °C for 24 h, the as-cast alloy MN5L contained Li and Mg2Ni, and alloy MN5L powder contained Mg and Mg2Ni. The absence of Li in the alloy power indicated that the powder form with larger surface area caused Li to volatilize at 300 °C.
Conclusions
Effects of volatilization of lithium on hydrogen storage characteristics of Mg–Ni–Li alloy were investigated. The following conclusions are summarized from the experimental results:
(1) Mg82Ni18 alloy is composed of Mg2Ni and Mg. Adding Li to Mg82Ni18 alloy can form Mg2Ni and Mg(Li) or Li(Mg) solid solution.
(2) Due to the volatilization of Li, the structure of Li-containing Mg82Ni18 alloy is converted to that of Li-free Mg82Ni18 alloy after full activation.
(3) Although the structure of Li-containing Mg82Ni18 alloy is converted to that of Li-free Mg82Ni18 alloy after full activation, its hydrogen absorption capacity significantly decreases.
(4) The reduction in hydrogen absorption capacity of Mg is more serious than that of Mg2Ni during PCI measurements.
(5) Alloys are ground into powder, which can increase their surface area, causing Li to volatilize at 300 °C.
Experimental procedures
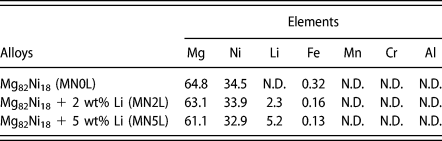
Three kinds of Mg82Ni18 alloy were prepared, which were Li-free, containing 2 wt% Li, and 5 wt% Li, designated as alloys MN0L, MN2L, and MN5L, respectively. Magnesium block (purity > 99.5%), nickel powder (purity > 99.9%), and Mg–9Li alloy were used as raw materials and placed in a stainless steel crucible heated by resistance furnace under argon atmosphere at a constant flow rate of 100 cm3/min. The temperature rose to 800 °C until the magnesium block melted and then stirred the molten alloy evenly for 2 h. The experimental alloys were removed after the temperature dropped to room temperature. The chemical compositions of three experimental alloys determined by inductively coupled plasma-atomic emission spectrometry (ICP-AES) analysis are listed in Table II.
Chemical compositions of three experimental alloys.
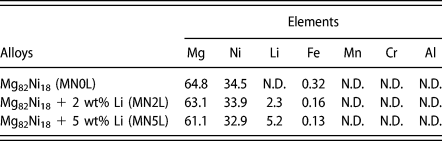
N.D. not detectable.
The crystal structure analysis was carried out by using XRD (Bruker D8A, Ettlingen, Germany) measurements. The experimental alloy was ground into a powder by stainless steel mortar and pestle before ball milling. The ball mill was executed by using SPEX 8000 ball miller machine (Metuchen, New Jersey). The diameter and height of the stainless steel container were 5 cm and 7 cm, respectively. The ball to powder ratio was 5:1.
The alloy was placed in a stainless steel reaction container of 2 cm3. The initial pressure was set at 40 atm H2 and the temperature was 300 °C. The process of activation was hydrogenation for 60 min before vacuum (10−2 torr) for 30 min. After 12 cycles (full activation), the PCI curves were measured at 300 °C and 20 atm H2. The activation and PCI curve measurements were made using gas reaction controller (Advanced Materials Corporation, Pittsburgh, Pennsylvania). In addition, the as-cast alloy MN5L and alloy MN5L in powder form were placed at 300 °C and in a vacuum (10−2 torr) to investigate the volatilization of Li using XRD.