INTRODUCTION
There are 60 inhabited tropical island countries covering c. 3.54 million km2 of land. Tropical islands are disproportionately rich in endemic plants, birds, molluscs and other invertebrates (Whittaker & Fernandez-Palaxios Reference Whittaker and Fernandez-Palacios2007) relative to similar mainland habitats (see for example Kier et al. Reference Kier, Kreft, Lee, Jetz, Ibisch, Nowicki, Mutke and Barthlott2009). The majority of global coral and seagrass diversity is located in the reefs, shoals and lagoons of tropical islands (Spalding et al. Reference Spalding, Blasco and Field1997, Reference Spalding, Green and Ravilious2001), the islands accounting for 2.4% of the global land area, but housing a much greater swathe of the Earth's biological uniqueness (Kreft et al. Reference Kreft, Jetz, Mutke, Kier and Barthlott2008). At the same time, the topography of most tropical islands is relatively steep, compressing their high terrestrial and coastal marine biological value into relatively small areas. This compression also reduces the average size of watersheds and shortens river main stems, in particular relative to the hydrological space of continental systems (Milliman et al. Reference Milliman, Farnsworth and Albertin1999). Consequently, island nations rely heavily on groundwater extraction and river impoundments to provide clean water to urban areas, particularly during periods of low rainfall.
Urban demand for land and water in the tropics is growing. By 2009, the global urban population outnumbered rural inhabitants for the first time, almost entirely due to the growth in tropical cities and towns (WHO [World Health Organization] 2012). With an average density of 222 persons km−2, tropical island nations as a class are some of the most heavily populated countries in the world, accounting in 2012 for more than half of the 50 most densely-populated nations (World Bank 2012). With an average rate of urban population growth exceeding 1% per annum, many tropical islands are experiencing rapid expansion around their major towns and cities.
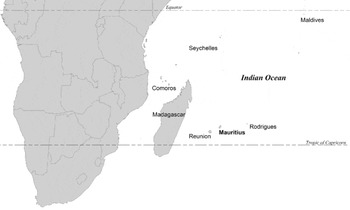
Mauritius is a tropical volcanic island located in the south Indian Ocean c. 180 km east of the island of La Réunion and some 850 km from Madagascar (Fig. 1). Like many other small tropical islands, it has experienced rapid growth over the past 50 years (World Bank 2012). The resident population of Mauritius rose from 659 000 to 1.28 million between 1960 and 2010. With a total land area of 1860 km2 (excluding Rodrigues and other islands), Mauritius is the fourth most densely populated country in the tropics, and sixth densest on the planet (based on data in World Bank 2012). Added to this growth has been an explosion of tourist arrivals from 422 000 in 1995 to just under 1 million in 2012 (Statistics Mauritius 2012), a common feature of many tropical island economies. The combination of these growth features has led to a substantial expansion of the peri-urban residential and industrial built-up area (BUA) in the country. By 2010, nearly 9% of Mauritius’ land area was occupied by man-made structures and surfaces, compared to 0.25–0.5% on a worldwide basis (see Schneider et al. Reference Schneider, Friedl and Potere2009). The area identified for urban settlement in Mauritius’ national development strategy expands this current allocation to 14% of national land area.
Location of Mauritius in relation to its neighbouring islands and southern Africa.

While this type of rapid rise in population, tourism and urban infrastructure reflects economic growth and coincides with a desirable rise in the standard-of-living, it also invariably places significant pressure on the natural environment. It also risks further degrading important ecosystem services that natural habitat affords many small island nations, where land and fresh water can quickly become limiting, and vulnerability to natural disasters can be much greater than larger countries (see for example Pelling & Uitto Reference Pelling and Uitto2001). The inevitable consequence of peri-urban expansion on tropical islands is that many natural features are consumed by expanding infrastructural conurbations, often without regard to the important environmental functions that they perform. Marine and terrestrial habitats in close proximity to urban areas are often contaminated by liquid and solid waste disposal, or degraded by extractive use for fuel and building materials. Mauritius has a long history of landscape modification dating back to the 16th century transformation of the island for sugar cane production. The extent of the consequent losses to its native biota is legendary (Cheke & Hume Reference Cheke and Hume2008; Florens Reference Florens, Sodhi, Gibson and Raven2013 a), but modern expansion of urban settlements and infrastructure are increasingly posing an important threat to the integrity of the remaining environmentally sensitive areas (ESAs) on the island. (for example, coastal wetlands; Laurance et al. Reference Laurance, Baider, Florens, Ramrekha, Sevathian and Hammond2012).
Identifying terrestrial and marine ESAs that are most vulnerable to degradation from peri-urban expansion can inform land-use decisions and act as a spring-board for integrating environmental and urban planning and management processes on tropical islands. Here we ask a series of questions related to current patterns of peri-urban expansion on Mauritius: (1) what ESAs are most immediately threatened by expansion due to their proximity to existing urban areas, (2) what areas are most exposed to policy and planning gaps due to current land-use designation, and (3) how do these twin risk factors intersect spatially to delimit priorities for conservation action?
METHODS
Study area
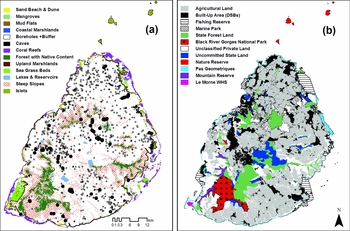
The main island has an area of approximately 1860 km2 with 156 smaller islets comprising an additional 1.3 km2 located offshore (Fig. 2 a). Most of the islets are located within an extensive shallow lagoon, formed by the breakwater action of a 233 km long fringing reef that surrounds all but the southern coast of the main island. The lagoon contains various patches of coral reef (163 coral species; Fenner et al. Reference Fenner, Clark, Turner and Chapman2004), seagrass beds (9 species) and, closer to the shore, mangroves (mainly Rhizophora mucronata) (Fig. 2 a). The 375 km coastline of the main island is dominated by rocky outcrops (69%) with intercalated sandy beach-dune systems (17% of coastline) and intertidal mudflats (14%) occupying inlets and bays (Fig. 2 a). In flat coastal regions, particularly in the north, a large number of Typha-dominated wetlands have developed where riparian drainage is sparse or occluded due to geology and historical land-use (Laurance et al. Reference Laurance, Baider, Florens, Ramrekha, Sevathian and Hammond2012).
(a) Environmentally sensitive areas (rivers not shown). (b) Built-up areas and land designation categories used in analyses.

The topography of Mauritius rises rapidly from the coast to 820 m altitude at its peak. A central upland is dominated by a massive dormant volcanic caldera that has variously weathered to form a chain of peaks interspersed along a north-south axis. A series of high mountain peaks and ridgelines formed during the earliest island-forming volcanic activity extend radially from this central highland area. The upland areas are dominated by steep variously forested slopes that collect the bulk of the rainfall available to the island. Average annual rainfall varies tremendously, from less than 600 mm yr−1 along the leeward east coast to 4000 mm yr−1 in the south-central uplands. Consequently, the main freshwater aquifer recharge zone and largest fraction of the island's total annual surface water discharge emanates from this central upland area and is dispersed through a 1483 km network of rivers and streams. Eleven impounding reservoirs with a combined freshwater storage capacity of nearly 91 Mm3 have been placed along the headwaters or main stems of seven of the largest rivers draining the uplands (WRU [Water Resources Unit] 2007). This surface storage capacity is augmented significantly by groundwater extraction through a series of more than 390 boreholes that meet just over half of the current potable water demand on the island, as well as other agricultural and industrial needs (WRU 2007) (Fig. 2 a).
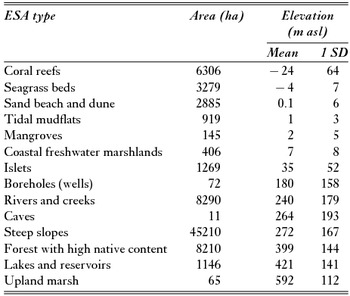
The forests of Mauritius are a vestige of their former cover, with a typical composition that is dominated by invasive alien species due to historical introductions and land-use practices (Vaughan & Wiehe Reference Vaughan and Wiehe1937). However, small enclaves of forests with high native content (> 50% native species, Grade 1–2; see Page & d’Argent Reference Page and d’Argent1997) still exist, mainly at higher elevations and on some offshore islets (Safford Reference Safford1997) (Table 1). The current total area of forest with high native content is believed to range between 90 and 100 km2 (Safford Reference Safford1997).
Environmentally sensitive area (ESA) type coverage arranged by ascending mean elevation (m above sea level [asl]). Area calculations for borehole and rivers and creek types include statutory buffer zones. Cave elevation was measured at entrance.

Data collection
ESA types and classes
We identified and delimited 14 ESA types, covering 782 km2 of land and lagoon (Fig. 2 a), using a range of landscape features. The choice of ESA types was strongly shaped by biological, geological and hydrological features, but we also aimed to build on pre-existing planning documents highlighting sensitive areas in need of additional consideration during urban development processes (MOHL [Ministry of Housing and Lands] 2003). We determined spatial coverage for each ESA using a broad range of existing spatial coverages (for example Willaime Reference Willaime1984; Borstad Associates Ltd 1999; MOHL 2003; Page & d’Argent Reference Page and d’Argent1997; Turner & Klaus Reference Turner and Klaus2005) combined with analyses of remotely-sensed imagery (SPOT [Satellite Pour l’Observation de la Terre] multispectral and QuickBird) and a series of field surveys we conducted in 2008–2009. Each ESA type consists of a series of classes that describe differences among features, such as coral density and types, relative contribution of native plants to forest cover, cave or islet geologies, domestic, industrial or agricultural use of lake, reservoir, river and well water, among others. Classes were useful in further discriminating degradation risk attached to peri-urban expansion, since not all features are functionally equal in importance to the long-term maintenance of the environmental services they provide to society. For example, rivers, reservoirs and wells that deliver drinking water are considered more sensitive to pollution than those used for agricultural or industrial purposes, since the cost of maintaining quality standards would be much greater.
BUAs
BUAs are spaces dominated by urban infrastructure, which in this study includes aggregations exceeding 10 ha with at least three-quarters of the area covered by human-formed non-natural surfaces. These include all buildings and other impervious surfaces, such as roads and runways. Urban expansion proceeds at varying rates and densities, depending on the underlying physical, socioeconomic and political forces driving the spatial location of new infrastructure (Angel et al. Reference Angel, Sheppard and Civco2005). These factors also create variation in the geometry of expanding BUAs, but most studies have found new building to occur on the perimeter of existing clusters (see for example del Mar López et al. Reference del Mar López, Aide and Thomlinson2001; Herold et al. Reference Herold, Goldstein and Clarke2003).
To characterize the BUA in Mauritius, we used a vector coverage derived from an aerial photographic campaign conducted in 2001 as the initial base. This base was subsequently updated using a supervised land-cover classification derived from a SPOT multi-spectral image of the island acquired in 2009. The spectral signature of bare earth in fallow agricultural fields and impervious surfaces can appear similar when remote imagery are classified using a single time window (see Schneider et al. Reference Schneider, Friedl and Potere2009). To differentiate between these areas, a QuickBird coverage (DigitalGlobe 2013) from the same year was used to discriminate urban surfaces from fallow agricultural fields and other bare earth features in instances where the SPOT coverage identified spatially-anomalous development clusters. Nearly 670 distinct BUAs covering a total of 160 km2 were identified from this analysis (Fig. 2 b). Almost 43% of this area was contained within the Port Louis-Quatres Bonnes-Curepipe conurbation (Fig. 2 b). Based on this coverage, the average size of a BUA in 2009 was 23.8 ha.
Land and lagoon designation categories
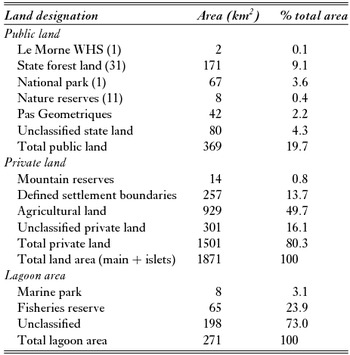
Land designation differentiates the legal basis of ownership (private or public), the statutory rules and responsibilities for land management and the types of permissible uses. Differences in land designation can fundamentally shape patterns of urban expansion by constraining how and where land use proceeds (Hayes Reference Hayes2006). To examine the spatial overlap between designation status and ESAs, land and lagoon was classified into nine broad categories (Table 2). This was accomplished through the integration of a series of digitized maps and existing GIS coverages depicting the various designations types (Table 2). The largest category, privately-owned agricultural land, occupied just over 50% of the national land area (Fig. 2 b). The bulk of land area assigned to this category was used for sugar production, reflecting the predominance of this crop in the economic history of the island. Around 20% of the land area fell within an unclassified designation, either as state (4.5%) or privately-owned (16%) land. Approximately 14% of land area on Mauritius was allocated for urban development. These areas, delimited by defined settlement boundaries (DSB), were a mix of private and public parcels that enveloped existing BUAs. The Pas Geometriques is a unique zone of state land at least 81 m wide that covers the entire coastline of Mauritius and accounts for c. 2.5% of the island. From a land-use standpoint, the Pas Geometriques would classify as a DSB, since the bulk of the zone is built-up through a programme of long-term leasing arrangements that allow private residents to construct homes on individual lease lots (‘campement’), while tenure remains with the government. The remaining 13% of land is distributed across various designations that should prohibit urban development and afford the highest level of protection to terrestrial ESAs. These include privately-owned mountain reserves, state forest lands (SFL), state-stewarded conservation areas (the Black River Gorge National Park [BRGNP] and Islets National Park, nature and mountain reserves and Le Morne World Heritage Site [LMWHS]), and river reserves. The lagoon area is largely undesignated, with fisheries reserves and marine parks occupying 27% of the surface area (Table 2).
Proportion of land and lagoon area under various public and private land designation categories. WHS = world heritage site.

Data analysis
A series of geospatial analyses were undertaken to assess degradation risk using the assembled ESA, BUA and designation topologies. All spatial layers were projected and geoprocessed using a Lambert conformal conic projection of a national grid datum (Le Pouce 1934) to ensure maximum accuracy in distance measurements. A digital elevation model (DEM) was constructed for Mauritius using ArcGIS 10 (3D Analyst). The orthorectified DEM used an existing vectorized coverage of a topographic contour set (10 m contour interval) derived from a UK land ordnance survey conducted in 1961 and digitized by the Mauritian Ministry of Housing and Lands. This DEM was used in the calculation of terrestrial surface distances. Distances to marine ESAs, such as coral reefs, were calculated planimetrically.
Proximity and designation effects
Each ESA type was initially analysed for its degradation risk from peri-urban expansion using a proximity analysis script produced within the ArcGIS 10 environment. Using the BUA coverage as a seed set, a series of merged concentric buffers were created in 100 m increments across the entire land area. The entire land and lagoon area fell within a distance of 7–8 km to the nearest BUA (not including the islets outside the lagoon). This distance coverage was then used as an overlay to the ESA coverage and geoprocessed for their spatial intersection. ESA proximity was variously expressed in area (in ha), length (km) and site (count) units, depending on type. Median ESA distance values were calculated as the distance from BUAs at which half of the total area (or length) for any given ESA type was closer, and half further away from BUAs. The total area of each ESA type falling within each 100 m buffer was calculated. The distribution of ESAs in relation to the land designation status was determined for each ESA type and each land designation category using a spatial intersection routine. Due to the large number of features, we used a G goodness-of-fit test to assess the significance of the relationship between the observed proportions of each ESA type in each land/marine designation category relative to their expected distributions based on the relative amount of total land/lagoon area attributable to each designation. The proportion of the G-statistic attributable to each designation assisted in the identification of land types that were significantly associated with each ESA type, if any. These were based on their respective likelihood ratios (L), being
 \begin{equation*}
G = 2\sum\limits^i f_i \,\,{\rm In}\left( \frac{f_i }{\skew8\hat{f}_i } \right)
\end{equation*}
where fi
and
 $\skew8\hat f_i$
are the observed and expected frequencies for each class i, respectively, and L = ln (
 $f_i /\skew8\hat f_i$
). The chi-squared (χ2) distribution is a good approximate for the distribution of G values when based on large sample sizes, and we used this to determine levels of significance (Sokal & Rolf Reference Sokal and Rohlf2011). In effect, examining L-values here is a form of gap analysis that emphasizes where degradation risk to ESAs is disproportionately dependent on certain designations due to their spatial overlap. All ESA types were evaluated in this way, except mangroves. Mangroves occupy space within the lagoon and on land, complicating their distribution in relation to land designation status. Only the fraction of mangroves situated in the intertidal zone (land) was considered here.
Degradation risk
Land designations are not distributed equally at all distances from the nearest BUA. Consequently, proximity and land designation approaches can assist individually in categorizing degradation risk, but the pattern of risk associated with each can be misleading if areal distributions are not spatially collinear. To further resolve a critical set of ESA types that are under the highest combined risk of degradation, a cross-analysis of spatial proximity and land designation was performed.
This analysis spatially intersected subsets of features classified by 100 m proximity intervals and land designation to resolve a larger two-factor ESA risk matrix. To identify the most appropriate size for the matrix, results from the proximity analysis were examined for modal peaks in the distribution of ESA area relative to distance from the nearest BUA. Modal peaks were then used to aggregate intervals into classes along the proximity axis.
To resolve the second, designation-based axis of the risk matrix, the 10 land designations (Table 2) were individually allocated to one of three risk levels. Levels were developed on the basis that ESAs are subject to different degrees of degradation risk from urban expansion based on the land management direction and legal restrictions put in place to regulate access. Areas categorized as high-pressure are thus more likely to be impacted by illegal or unregulated activities attached to infrastructure development and material use and disposal. A good example to illustrate this difference would be caves or marshes on unclassified land, which are more prone to solid waste dumping and thus under greater pressure than those found within the national parks, a designation that has restricted access and thus pressure from solid-waste contaminants. The main designation categories conforming to these conditions are the BUAs and unclassified areas (in either private or state lands, or lagoon; see Table 2). Conversely, areas categorized as low pressure describe designation categories that best conform to conditions that support ESA integrity. These include the LMWHS, the BRGNP and nature reserves, privately-held mountain reserves, marine parks, and fisheries reserves. The management objectives and conditions of access are well established for these areas and there are resources allocated specifically to regulate and monitor activities. In between these groups are those areas considered to be under moderate pressure, such as agricultural lands, SFLs, and the Pas Geometriques. These areas maintain some land-use objectives and access restrictions, but are often spatially intermixed with high-pressure areas at small spatial scales or more likely to experience a change in their designation altogether (such as use as campement versus hotel versus public beach versus marina). Changes in the land-use objectives attached to these areas are more likely to increase, not lessen, pressure on ESAs. This uncertainty increases the likelihood of impacts from adjoining sites, and heightens degradation risk in these areas.
RESULTS
Threats from proximity to urban areas
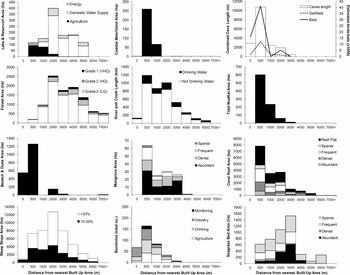
The distribution of ESAs as a function of distance from the nearest BUA clustered into two groups. The first group, which included eight of the 14 ESA types, was in a close proximity zone, and was characterized by ESA types with a modal peak in proximity of 0–500 m (Fig. 3). Of these eight, coastal marshland, beach and dune formations and caves were disproportionately located within this zone with 79%, 91%, and 76% of their total area located within this distance band, respectively. Approximately two-thirds of mudflat areas and functioning groundwater boreholes, and nearly half of coral reefs and mangroves also fell within this zone. Furthermore, between 15–28% of the beach and dune, cave, and groundwater borehole ESAs were intercalated within existing BUAs. In contrast, the second group was characterized by ESA types with modal peaks in their areal distribution at 2–3 km from BUAs; this group included high native content (HNC) forests, steep slopes, lakes and reservoirs, upland marsh and seagrass beds (Fig. 3). Most of these ESAs, with the exception of seagrass beds, tended to occur at the higher elevations on the island (see Table 1). In particular, HNC forests and steep slopes were strongly coincident at the highest elevations. Just over 83% of remaining HNC forests were located on relatively steep slopes (> 10% gradient).
Spatial proximity of environmentally sensitive area types on Mauritius in relation to the distribution of built-up area (BUA), where a distance of zero is within a BUA and values are maximum interval distances.

Threats attached to designation status
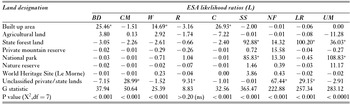
The observed distributions of all ESA types, except rivers and streams, were found to be significantly different (G statistic, p < 0.05) from that expected based on the underlying geography of land designation types (Table 3). Examining the variation in L-values pinpointed where the distribution of each ESA type was at odds with the underlying distribution of land/lagoon area across the various designations.
Results of statistical tests of spatial relationship between land/marine designation and environmentally sensitive area (ESA) occurrence. BD = beach & dune, CM = coastal marshland, W = wells, R = rivers, C = caves, SS = steep slopes, NF = native forest, LR = lakes & reservoirs, UM = upland marsh. L-values indicating severe distributional imbalances are noted by (*).

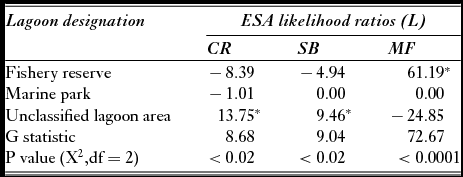
Results of statistical tests of spatial relationship between marine designation and environmentally sensitive area (ESA) occurrence. CR = coral reef, SB = seagrass beds, MF = mudflats. L-values indicating severe distributional imbalances are noted by (*).

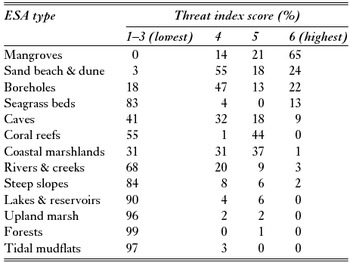
Distribution of each environmentally sensitive area (ESA) type across the six-point threat index (TI) resulting from the cross analysis of proximity and land designation. The lowest three scores are considered low threat zones and have been aggregated here.

BUA dependent
We found a significantly greater area than expected of three ESAs to be distributed in BUAs. These included sand beach and dune, wells (boreholes) and caves (Table 3). The result underlies the relative scarcity of these features in areas with other land management objectives, attributable to the scarcity of conservation-designated areas within or near to BUAs and a very high proportion of privately-held land. This latter category accounted for nearly 97% of all land within 500 m of existing BUAs.
State forest land dependent
Steep slope and lake and reservoir ESAs were strongly linked to the distribution of the roughly 9% of land area classified as SFL. Upland (mainly Carex spp.) marsh was, to a much lesser extent, aggregated in SFL (Table 3). SFL also contributes positively to the balance of HNC forests, but this was surprisingly not as high as some other land designations given the management objectives of this land unit. In part, this is attributable to a historical emphasis on plantation timber production rather than native forest conservation (Cheke & Hume Reference Cheke and Hume2008). The bulk of this ESA type found in SFL is expected to consist largely of forest containing 25–50% native plants, also referred to as Grade 3 HNC forest, the lowest of three categories (see Page & d’Argent Reference Page and d’Argent1997).
Conservation area dependent
National parks, nature reserves, and the LMWHS accounted for only 4% of the land area, but acted as important centres for a number of ESA types. Offshore islet ESAs were predominately classified as conservation areas, due to many of the largest among them having nature reserve status. Upland Pandanus and sedge marsh was overwhelmingly located in the BRGNP (Table 3). Steep slope areas, particularly those with a grade exceeding 20%, were also aggregated in the BRGNP.
In the lagoon, only mudflat ESAs appeared more often than expected in areas designated for conservation (Table 4). The fraction of total coral reef and seagrass bed ESAs in these areas was significantly lower than would be expected relative to the amount of lagoonal area allocated to these designation types (Table 4). Marine parks in particular appeared to play a very modest role in the protection of ESAs relative to the area allocated and in comparison to fisheries reserves. However, while the two marine parks and four fishery reserves (Fig. 2 b) have not strictly covered a proportional amount of these ESAs, they appeared to have covered some of the higher-quality formations. Marine parks accounted for c. 2% of the total coral reef around Mauritius, but covered nearly 9% of the ‘dense’ classification. Similarly, fisheries reserves accounted for 19% of the dense reef cover class, compared to 14% across all reef classes (see Fig. 3). In contrast, the highest-density seagrass beds were not well represented, <0.1% of total seagrass bed cover being found in marine parks and, of the 20% found in fisheries reserves, only 7% fell within the highest (‘abundant’ and ‘dense’) cover classes.
Unclassified land/lagoon dependent
A number of ESA types were found disproportionately more often than expected in this mixed-landscape designation. Coastal marshlands, lakes and reservoirs (all privately-owned in this instance), and HNC forests had large fractions of their total areas located in zones currently unclassified, uncommitted or under mixed land use (Table 3). The very high occurrence of coastal marshland and HNC forest is of particular concern, given the elevated risk of degradation where allowable land uses are unspecified. However, the overwhelming majority of HNC forests in these areas is expected to be of the lowest (Grade 3) condition (see Page & d’Argent Reference Page and d’Argent1997). The high fraction of coral reef and seagrass bed types that were found in unclassified expanses of the lagoon is further cause for concern since there are fewer controls on the type and intensity of use activities and less monitoring of their condition.
ESAs at risk
The results of the proximity analysis reveal a preponderance of ESA features at distances <500 m and at 2–3 km from BUAs. As a result, proximity effects were aggregated into three categories for the cross analysis: (1) within BUAs, (2) at 0–500 m from the nearest BUA, and (3) > 500m from the nearest BUA. These three categories were cross analysed with low-, moderate- and high-pressure designation classes to form a six-point threat index. A six-point scale was formed, since some designation classes were not found at all proximity classes (thus the matrix was unbalanced). Land in BUAs was exclusively unclassified or privately held, making assignment of a threat index point to SFL/agriculture or conservation classes at this distance merely hypothetical. Similarly, only marine conservation areas occurred within 500 m of the nearest BUA, so this point was aggregated with SFL and agriculture designations at this distance. The final six-point scale consisted of the following, in order of lowest risk (1) to highest risk (6): (1) conservation areas × proximity > 500 m, (2) SFL/agriculture × proximity > 500 m, (3) unclassified/privately-owned × proximity > 500 m, (4) conservation (marine only) + SFL/agriculture × proximity < 500m, (5) unclassified/privately-owned × proximity < 500 m, and (6) unclassified/privately-owned × proximity in BUAs.
We identified five ESAs with more than half of their cover within the high risk (4–6 score) categories of our matrix (Table 5). Mangroves, boreholes, sand beach & dune, caves, and coastal freshwater marshlands accumulated the highest fraction of their area in these categories, and consequently could be considered as the top priorities for conservation action based on the analyses presented here (Table 5). Conversely, a number of ESA types generally had low threat index values. These types are not considered to be under immediate pressure, although some individual features/sub-areas within each ESA type do fall within high pressure zones. The main types falling in this lower pressure group include reservoirs & lakes, rivers & creeks, HNC forests, sea grass beds, coral reefs, tidal mudflats, upland marsh, and offshore islets (Table 5).
DISCUSSION
Proximity effects
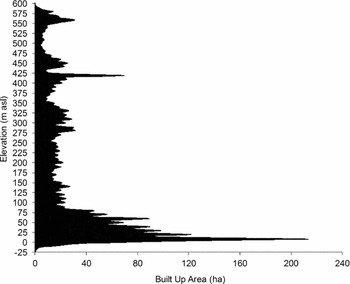
The strong bimodality in spatial proximity of ESAs to urban area could be due to the spatial convergence of socio-economic and environmental factors. One set of ESA types was in close proximity to BUAs due to a strong urban development preference for coastal locations in Mauritius, a preference shared worldwide (Seto et al. Reference Seto, Fragkias, Güneralp and Reilly2011). This preference is visible in the elevational profile of BUAs based on their overlap with the 10 m × 10 m DEM (Fig. 4). Urban environments have expanded along the coastline in recent decades at a much faster pace than inland in part due to the high amenity value placed on properties adjacent to the seashore. This value has steadily increased over the last several decades as the importance of the traditional island economy, inland sugar-cane production, has contracted. Urban expansion concentrated along the coastline, particularly in the north where the lagoon is narrow, has reduced the distance between urban BUAs and reef formations (Fig. 2 a, b). Much of the development in these areas is tourism-related, and the close proximity of reefs, as well as the beaches and dunes that are formed from reef (McIntire & Walker Reference McIntire and Walker1964) and lagoonal sediments (Karisiddaiah et al. Reference Karisiddaiah, Veerayya and Guptha1988) have been important catalysts in peri-urban expansion at these locations. The present proximity analysis indicates that more than half of the beach and dune area on Mauritius were located within 400 m of patch or fringing reef formations. Coastal marshlands were even more strongly coincident with beach-reef systems on Mauritius, with nearly 60% of their area located within 200 m of the nearest beach and dune ESA. Coastal marshlands consequently occupied most of the inland locations nearest to the beach-reef systems and continued to be a prime target for backfilling and peri-urban expansion (Laurance et al. Reference Laurance, Baider, Florens, Ramrekha, Sevathian and Hammond2012). Nearly one-third of the beach and dune area was already built upon, and 85% of the total area of this ESA type was located within 400 metres of the nearest BUA (Fig. 3). As available space along the coastal fringe declines, BUAs have begun to expand inland and upslope from these prime locations.
Distribution of the elevation above sea level of built-up areas on Mauritius.

At the same time, closely associated mudflats and mangroves occurred in relatively calm bays and inlets close to river mouths or intercalated between adjacent islets. These areas have traditionally proven the best locations for port facilities, including Port Louis, the capital, due to the relative protection they afford during severe weather and their historic military role in defence. The bulk of mudflats occupy the shoreline of the three expansive lagoonal areas in the south-east, along the north-east coast and north of the Le Morne peninsula in the south-west (Fig. 2 a), where the fringing reef is most distant from shore. These areas are deprived of offshore sands since storm waves, the main vehicle for coastline deposition, are dissipated over the broad reach of their enveloping lagoons and impeding islets, creating a sand shadow along these coastal reaches. Mudflats, along with adjoining and overlapping mangroves, have the highest productivity among littoral habitat types. Some features, such as the Rivulet Terre Rouge Bird Sanctuary, a RAMSAR site, are important sites for native and overwintering migratory bird species.
In contrast to ESA types attached to the coastal fringe, the unusually high proportion of caves within and close to BUAs is counterintuitive; all of these formations are segments of lava tubes that represent a formidable safety hazard to urban infrastructure and hold little amenity value. Yet, > 15% of the total surveyed cave length (see Middleton & Hauchler Reference Middleton and Hauchler1998) in the country was located within the BUAs, and 75% within 500 m of them. Caves are formed in clusters when segments of lava tube systems collapse, forming entrances (Middleton Reference Middleton1998). Tubes typically form in gently sloping valleys where relatively slow lava flow rates produce roofs and levees (see for example Calvari & Pinkerton Reference Calvari and Pinkerton1998). Consequently, the close spatial relationship between caves and urban areas in the island's valleys is likely an unfortunate consequence of this geologic history. These caves are under severe threat from backfilling and dumping of industrial solid wastes due to their close proximity to BUAs. The bulk of the remaining populations of the cave swiftlet (Aerodramus francicus), endemic to Mauritius and Reunion, and the Mascarene free-tailed bat (Mormopterus acetabulosus), endemic to Mauritius, are located in caves adjacent to BUAs, based on a field survey conducted as part of this study and guided by those previously undertaken by Middleton and Hauchler (Reference Middleton and Hauchler1998) (Fig. 3). This close proximity puts them at greater risk from future peri-urban expansion in the current absence of adequate planning and effective management for their protection during and after urban development (Middleton Reference Middleton1998; Jones Reference Jones, Cheke and Hume2008).
Proximity gives a good indication of the ESAs most likely to be degraded or modified by future urban expansion without consideration paid to past activities. HNC forests on Mauritius are typically very far removed from BUAs, have one of the greatest areal extents among ESA types, and are situated at some of the highest elevations on the island (Fig. 2 a; Table 1). The risk to this ESA type from future peri-urban expansion is very low, but this is largely due to the fact that the current distribution is an artefact of accessibility and significant past losses to agriculture and urban development (Vaughan & Wiehe Reference Vaughan and Wiehe1937). Similarly, seagrass beds show a lower risk of degradation from the impacts of future urban expansion since they are located at greater distances from BUAs, but this also reflects, in part, the effects of past expansion and the consequent removal of nearshore beds for tourism and ‘amenity’ purposes (Daby Reference Daby2003).
The proximity analysis examined the distance to the nearest BUA irrespective of other factors, such as population size or the type or level of economic activity that might further discriminate distance effects. As a result, some parts of the country with relatively little BUA, but high ESA cover, may be under greater threat than other areas with larger urban build-up, if these undeveloped blocks are prioritized for greater residential or commercial expansion. Classifying or weighting BUAs by demographic and economic variables could further assist in anticipating the effect of proximity in characterizing the threat from peri-urban expansion.
Designation effects
While the conservation effectiveness of protected areas (see Bruner et al. Reference Bruner, Gullison, Rice and da Fonseca2001) is by no means guaranteed and protection may not act as a barrier to urban expansion (see Güneralp et al. Reference Güneralp, McDonald, Fragkias, Goodness, Marcotullio, Seto, Elmqvist, Fragkias, Goodness, Güneralp, Marcotullio, McDonald, Parnell, Haase, Sendstad, Seto and Wilkinson2013), legal designation of conservation areas remains the primary tool in deflecting widespread habitat losses. While we found that some ESAs on Mauritius were significantly attached to protected areas, there was a surprisingly larger number of these represented in areas that were privately owned or without any current land-use designation (Table 5). ESAs that play an important role in watershed function, such as coastal marshlands and HNC forests, were significantly associated with these undesignated areas. The very high occurrence of these ESA types is of particular concern, given the elevated risk of degradation where allowable land uses are unspecified. However, the overwhelming majority of HNC forests in these areas is expected to be of the lowest (Grade 3) condition (Page & d’Argent Reference Page and d’Argent1997).
The high fraction of coral reef and seagrass bed types that were found in unclassified expanses of the lagoon is further cause for concern since there are fewer controls on the type and intensity of use activities and less monitoring of their condition. Coral reefs and seagrass beds provide numerous environmental benefits to island nations, such as fisheries habitat and storm surge mitigation (see for example Nagelkerken et al. Reference Nagelkerken, Roberts, van der Velde, Dorenbosch, van Riel, Cocheret de la Morinière and Nienhuis2002). Many small island developing states in particular are highly vulnerable to the impacts of natural disasters due to their size, large coastline-to-land area ratios, and relatively undiversified economies (Pelling & Uitto Reference Pelling and Uitto2001). The absence of protection for ESAs that can buffer against the worst impacts and lead to a greater resiliency risks much. The interlinking ecology of these two ESA types, along with mangroves, has been shown to sustain dynamic coastal fisheries in most tropical island countries (see for example Pinto & Punchihewa Reference Pinto and Punchihewa1996; Mumby et al. Reference Mumby, Edwards, Arias-Gonzalez, Lindeman, Blackwell, Gall, Gorczynska, Harborne, Pescod and Renken2004).
Other effects
Although some ESA types are categorized as being under low pressure from urban expansion they may still be at risk from other longer-term threats, such as invasive species or changes in climate, particularly where planning and management are inadequate or ineffective in combating these pervasive risks (Florens Reference Florens2013 b).
The risk analysis performed here also did not account for specific policy and legal provisions that may moderate threats to ESA type features falling within high pressure zones. For example, regulations already provide to some extent for the protection of mangroves by making it an offence to damage this type of ESA. This condition would ease pressure in areas that otherwise would experience a reduction in the representation of mangrove cover due to unregulated harvesting combined with little or no replanting. Similarly, a legal ban on mining of lagoon sand, previously used for urban construction, has reduced the likelihood of seagrass bed loss in unprotected lagoon in Mauritius (Walker Reference Walker1962). Proximity and land-designation analysis of threats to ESAs are important first steps in identifying critical gaps in the legislative and policy instruments underpinning environmental protection of areas identified as nationally important.
Other ESA types with a large fraction of their area or number of features found in high pressure zones may be subject to fewer impacts since they have been placed in these areas in order to facilitate service delivery. The distribution of boreholes (wells) used for drinking water (Fig. 3) clearly falls within this group since the delivery of residential and industrial water supply is conditioned by the distance between source and point of use. In this case, it is important to assess whether planned proximity to BUAs is impairing service delivery of clean water. The relatively low presence of groundwater data-logging sites (see boreholes-monitoring in Fig. 3) within BUAs would, in this instance, indicate that environmental risk from urban development may not be adequately monitored in these high pressure zones.
CONCLUSIONS
Our study indicates that many landscape and marinescape features in Mauritius are under threat of loss or degradation from urban expansion, particularly those that contain significant social value through their provisioning of, or proximity to, natural assets that underpin a burgeoning tourism industry. These threats are centred currently on the beach and dune, coral reef and coastal marshland ESA types.
The examination of offshore ESAs in this study also highlights the fact that urban growth on tropical islands can begin to spatially impinge upon important marine features as much as those on land, putting these too at greater risk of degradation, particularly where they are unprotected. The clearance of seagrass for tourist purposes (Daby Reference Daby2003) or placement of marine outfalls to handle urban sewerage waste are two clear examples of risks posed from urban growth in close proximity to ESAs. On islands in particular, both marine and terrestrial ecosystems need to be considered simultaneously within urban planning since both can be equally degraded from a lack of protection and close proximity to existing urban clusters.
The study also illustrates how the spatial scale of conservation on tropical islands requires alternative thinking if key environmental features are to avoid degradation and loss from urban growth. Creating large protected areas, that can effectively buffer the impacts of adjoining land uses (Peres Reference Peres2005), is not always a viable option for island nations that have little spare land capacity and long-standing legacies of habitat fragmentation. An ESA type in Mauritius covers, on average, just over 5500 ha (Table 1); this is very small in comparison to the 1.23 million ha average of a World Heritage Site (IUCN [International Union for the Conservation of Nature] 2012) or the 107 000 ha average area of an IUCN-listed protected area (IUCN & WCMC-UNEP [World Conservation Monitoring Centre-United Nations Environment Programme] 2012). ESAs provide some greater flexibility in where and how environmental features are considered in urban planning. Collectively maintaining the pool of ESA fragments, patches and features on Mauritius and other tropical islands represents a good baseline for conserving their localized endemic biota and the contribution these make to global biodiversity, while maintaining the flow of ecosystem services that these areas currently deliver.
Incorporating ESAs as a core consideration in national development planning would improve the likelihood that urban expansion proceeds in a manner that avoids and mitigates environmental losses by establishing a firm benchmark from the start of the process. Analysing the threats posed by peri-urban expansion from proximity and incompatible land-use designation can act as a first step in objectively prioritizing ESA conservation and identifying the most appropriate approaches, such as urban reserves (Niemelä Reference Niemelä1999), conservation easements or payments for environmental services, needed to ensure their long-term integrity.
ACKNOWLEDGEMENTS
We thank D. Nickel, S.Tomassi, R. Ramdewor, C.Wold, and B.Aylward for their various wetlands, legal and policy work that informed the study. The support of S. Ramrekha and colleagues is warmly acknowledged.