
1. Introduction
Steady incoming flow past a smooth and nominally two-dimensional (2-D) bluff body has been a classical problem in fluid mechanics. Commonly used bluff bodies include cylinders with circular and square cross-sectional shapes, for which the flow is governed by a single dimensionless parameter, i.e. the Reynolds number Re (= UL/ν), defined based on the incoming flow velocity (U), the length scale of the cylinder perpendicular to the incoming flow (L) and the kinematic viscosity of the fluid (ν). For a circular cylinder, the length scale is the diameter of the cylinder, commonly denoted D. For a square cylinder, the length scale depends on the flow incidence angle. For a square cylinder aligned with the four sides perpendicular and parallel to the incoming flow, which is commonly referred to as a square cylinder with zero flow incidence/attack angle (e.g. Tong, Luo & Khoo Reference Tong, Luo and Khoo2008; Sheard, Fitzgerald & Ryan Reference Sheard, Fitzgerald and Ryan2009; Yoon, Yang & Choi Reference Yoon, Yang and Choi2010) or simply a square cylinder (e.g. Robichaux, Balachandar & Vanka Reference Robichaux, Balachandar and Vanka1999; Sohankar, Norberg & Davidson Reference Sohankar, Norberg and Davidson1999; Blackburn & Lopez Reference Blackburn and Lopez2003), the length scale is the side length of the cylinder, commonly also denoted D. On the other hand, for a square cylinder aligned with all four sides 45 ° to the incoming flow, i.e. with an incidence angle α = 45 ° and commonly referred to as a diamond cylinder, the length scale, commonly denoted h (e.g. Sheard et al. Reference Sheard, Fitzgerald and Ryan2009; Yoon et al. Reference Yoon, Yang and Choi2010), is  $\sqrt 2$ times the side length of the cylinder. To be consistent with previous studies, the present study uses the terms ‘square cylinder’ and ‘diamond cylinder’ for the cases with α = 0 ° and 45 °, respectively.
Three-dimensional (3-D) wake transitions for a circular and a square cylinder have been studied extensively in the literature through physical experiments, linear/nonlinear stability analyses and direct numerical simulations (DNS). With the increase in Re, a few wake transition regimes appear.
(i) At Re ~ 190 for a circular cylinder (Barkley & Henderson Reference Barkley and Henderson1996; Williamson Reference Williamson1996) and Re ~ 165 for a square cylinder (Sheard et al. Reference Sheard, Fitzgerald and Ryan2009; Choi, Jang & Yang Reference Choi, Jang and Yang2012; Park & Yang Reference Park and Yang2016), the wake transitions from two- to three-dimensional through the mode A instability that originates in the primary vortex cores (Williamson Reference Williamson1996; Leweke & Williamson Reference Leweke and Williamson1998; Thompson, Leweke & Williamson Reference Thompson, Leweke and Williamson2001). The mode A instability is subcritical in nature and contains a small hysteresis loop (Henderson & Barkley Reference Henderson and Barkley1996; Henderson Reference Henderson1997; Akbar, Bouchet & Dušek Reference Akbar, Bouchet and Dušek2011). The mode A streamwise vortices display an out-of-phase sequence (Williamson Reference Williamson1996) and a relatively large spanwise wavelength/period of ~4D for a circular cylinder (Barkley & Henderson Reference Barkley and Henderson1996) and ~5D for a square cylinder (Choi et al. Reference Choi, Jang and Yang2012; Park & Yang Reference Park and Yang2016). The ordered mode A structure is unstable over time and will evolve spontaneously into a more stable pattern with vortex dislocations (Williamson Reference Williamson1996). For Re ~ 190–230 for a circular cylinder (Williamson Reference Williamson1996) and Re ~ 165–185 for a square cylinder (Jiang, Cheng & An Reference Jiang, Cheng and An2018a), the fully developed wake is represented by the pattern of mode A with vortex dislocations.
(ii) Over Re ~ 230–265 for a circular cylinder (Williamson Reference Williamson1996; Barkley, Tuckerman & Golubitsky Reference Barkley, Tuckerman and Golubitsky2000; Sheard, Thompson & Hourigan Reference Sheard, Thompson and Hourigan2003) and Re ~ 185–210 for a square cylinder (Jiang et al. Reference Jiang, Cheng and An2018a), the wake transitions gradually from the pattern of mode A with vortex dislocations to mode B. The mode B instability differs from the mode A instability in that it originates in the braid shear layer region (Williamson Reference Williamson1996; Leweke & Williamson Reference Leweke and Williamson1998; Thompson et al. Reference Thompson, Leweke and Williamson2001) and is supercritical in nature (Henderson Reference Henderson1997). The mode B streamwise vortices display an in-phase sequence (Williamson Reference Williamson1996) and a relatively small spanwise wavelength/period of ~0.8D for a circular cylinder (Barkley & Henderson Reference Barkley and Henderson1996) and ~1.1D for a square cylinder (Choi et al. Reference Choi, Jang and Yang2012; Park & Yang Reference Park and Yang2016).
(iii) At Re ~ 265 for a circular cylinder (Williamson Reference Williamson1996; Barkley et al. Reference Barkley, Tuckerman and Golubitsky2000; Sheard et al. Reference Sheard, Thompson and Hourigan2003) and Re ~ 210 for a square cylinder (Jiang et al. Reference Jiang, Cheng and An2018a), the pattern of mode A with vortex dislocations disappears, beyond which the mode B structures become increasingly disordered, such that the wake becomes increasingly turbulent/chaotic. In particular, for a circular cylinder a critical condition is observed at Re ~ 265, where the mode B structures are particularly ordered, and a local peak or trough is observed for a number of flow properties, e.g. the base pressure coefficient and the Strouhal number (Williamson Reference Williamson1996).
An equally important case to the square cylinder is the diamond cylinder. Among the range of flow incidence angles, the square and diamond cylinders are the two special cases where the cross-sectional shape of the cylinder is symmetric about the wake centreline. In addition, at an Re corresponding to the wake transition from two- to three-dimensional, the 2-D wakes of both cylinders possess the Z 2 spatio-temporal symmetry, i.e. spatial reflection of the flow about the wake centreline after time evolution of every half-vortex shedding period (Blackburn & Sheard Reference Blackburn and Sheard2010; Yoon et al. Reference Yoon, Yang and Choi2010). Consistently, over the range of flow incidence angles, the cases of square and diamond cylinders correspond to local minima of Re for the onset of 3-D (specifically mode A) wake instability (Sheard et al. Reference Sheard, Fitzgerald and Ryan2009; Yoon et al. Reference Yoon, Yang and Choi2010), i.e. the square and diamond cylinders are locally most unstable to the 3-D instability.
However, the 3-D wake transition process of a diamond cylinder is far less studied than that of a square or circular cylinder. The most well-understood aspect for a diamond cylinder is the onset of three-dimensionality, which is identified as the mode A instability at the critical Re (Recr) with the corresponding most unstable spanwise wavelength (λcr) of (Recr, λcr/h) = (116, 4.0) by Sheard et al. (Reference Sheard, Fitzgerald and Ryan2009) and (120, 4.2) by Yoon et al. (Reference Yoon, Yang and Choi2010) through Floquet stability analysis, and Recr = 127 ± 2 by Tong et al. (Reference Tong, Luo and Khoo2008) through physical experiments. Beyond Recr, Floquet analysis has been routinely adopted in the literature in identifying additional instability modes in the cylinder wake. However, for a diamond cylinder the 2-D base flow becomes aperiodic at  $Re\mathrm{\ \mathbin{\lower.3ex\hbox{$\buildrel> \over {\smash{\scriptstyle\sim}\vphantom{_x}}$}}\ }140$, which inhibits the application of Floquet analysis to higher Re values for the identification of additional instability modes other than mode A (Sheard et al. Reference Sheard, Fitzgerald and Ryan2009). Alternatively, limited experimental and 3-D DNS cases (Tong et al. Reference Tong, Luo and Khoo2008; Yoon, Yang & Choi Reference Yoon, Yang and Choi2012; Jiang et al. Reference Jiang, Cheng, An, Tong and Yang2018b) shed light on the wake structures beyond Recr. Tong et al. (Reference Tong, Luo and Khoo2008) conducted physical experiments and identified a further wake transition from the mode A regime (with vortex dislocations) to the mode B regime at Re = 190. Yoon et al. (Reference Yoon, Yang and Choi2012) performed 3-D DNS at a few Re values and observed ordered mode A structures at Re = 150, disordered mode A structures at Re = 200 and hardly identifiable structures at Re = 250. Jiang et al. (Reference Jiang, Cheng, An, Tong and Yang2018b) performed 3-D DNS and observed mode B structures at
 $Re\mathrm{\ \mathbin{\lower.3ex\hbox{$\buildrel> \over {\smash{\scriptstyle\sim}\vphantom{_x}}$}}\ }200$.
However, the wake structures reported by the above-mentioned studies do not agree well, and it is unclear whether the wake transition from mode A to mode B is a sudden or a gradual process.
In light of the earlier works, the present study aims at investigating in detail the wake transition process of a diamond cylinder based on 3-D DNS with a fine increment of Re of 10. A particular focus will be the gradual wake transition from mode A to mode B and the corresponding variations in the hydrodynamic forces.
The present study is also motivated by the aperiodicity of the base flow for a diamond cylinder and the consequent limitation to the Floquet stability analysis (Sheard et al. Reference Sheard, Fitzgerald and Ryan2009). As will be shown in § 3.5, the aperiodicity of the base flow arises from the transition from the primary (Kármán) vortex street to the secondary vortex street within the relatively near wake (e.g. within 15D downstream of the cylinder for Re ≥ 200). Therefore, interactions between the 3-D wake transition and the 2-D base-flow transition may be expected for the case of a diamond cylinder. Similar cases involving the base-flow transition relatively close to the cylinder include a thin rectangular cylinder (Saha Reference Saha2007), a thin elliptical cylinder (Thompson et al. Reference Thompson, Radi, Rao, Sheridan and Hourigan2014), a triangular cylinder (Ng et al. Reference Ng, Vo, Hussam and Sheard2016), etc. In contrast, for the cases of circular and square cylinders, the base flows over the 3-D wake transition regimes do not transition to the secondary vortex street within at least 50D downstream of the cylinder (e.g. Jiang & Cheng Reference Jiang and Cheng2019), such that the 3-D wake transition and the 2-D base-flow transition are decoupled.
In the present study, the diamond cylinder serves as a representative case in investigating the interactions between the 3-D wake transition and the 2-D base-flow transition. In addition to the 3-D DNS, Floquet analysis is employed in providing a more thorough understanding of the interactions. The Floquet analysis will be conducted with caution, where the aperiodicity of the base flow will be tackled by particular measures.
2. Numerical model
2.1. Numerical method
DNS were conducted in this study in solving the flow around a diamond cylinder. The governing equations are the continuity and incompressible Navier–Stokes equations
 \begin{gather}\frac{{\partial {u_i}}}{{\partial {x_i}}} = 0,\end{gather}
 \begin{gather}\frac{{\partial {u_i}}}{{\partial t}} + {u_j}\frac{{\partial {u_i}}}{{\partial {x_j}}} ={-} \frac{1}{\rho }\frac{{\partial p}}{{\partial {x_i}}} + \nu \frac{{{\partial ^2}{u_i}}}{{\partial {x_j}\partial {x_j}}},\end{gather}
where  $({x_1},{x_2},{x_3}) = (x,y,z)$ are the Cartesian coordinates, ui is the velocity component in the direction xi, t is time,
 $\rho$ is fluid density, p is pressure and ν is kinematic viscosity. The numerical simulations were performed with the open-source code OpenFOAM (www.openfoam.org). The finite volume method (FVM) and the PISO (pressure implicit with splitting of operators) algorithm (Issa Reference Issa1986) were used for solving the equations. The convection, diffusion and time derivative terms were discretised, respectively, using a fourth-order cubic scheme, a second-order linear scheme and a blended scheme consisting of the second-order Crank–Nicolson scheme and a first-order Euler implicit scheme. The same numerical approach was used in Jiang et al. (Reference Jiang, Cheng, Draper, An and Tong2016, Reference Jiang, Cheng and An2018a) for the simulations of wake transition of a circular and a square cylinder.
2.2. Computational domain and mesh
A hexahedral computational domain, as sketched in figure 1(a), was used for the present DNS. As shown in figure 1(a), the centre of the diamond cylinder was placed at (x, y) = (0, 0). The computational domain size was −40 ≤ x/h ≤ 40 in the streamwise direction, −40 ≤ y/h ≤ 40 in the transverse direction and 0 ≤ z/h ≤ 12 in the spanwise direction. The spanwise domain size Lz/h = 12 was chosen based on Jiang, Cheng & An (Reference Jiang, Cheng and An2017a), who examined the effect of Lz on the numerical modelling of flow past a circular cylinder over the 3-D wake transition regimes, and demonstrated that an Lz of approximately three times the intrinsic wavelength of mode A is required to avoid inaccurate vortex patterns induced by the restriction of Lz. For the present case of a diamond cylinder, the spanwise wavelength of mode A at the onset of flow three-dimensionality is 4.00h (see § 2.4), such that Lz/h = 12 was used to accommodate three spanwise periods of mode A.
(a) Schematic model of the computational domain (not to scale), and (b) close-up view of the 2-D mesh near the cylinder.

The boundary conditions for the velocity included a uniform velocity (ux, uy, uz) = (U, 0, 0) at the inlet, a Neumann condition (i.e. zero normal gradient) at the outlet and a no-slip condition on the cylinder surface. The boundary conditions for the pressure included a Neumann condition for the inlet and cylinder surface, and a reference of p = 0 at the outlet. Symmetry boundary conditions were applied at the top and bottom boundaries, while periodic boundary conditions were employed at the two lateral boundaries perpendicular to the cylinder span. The periodic boundary conditions allow for travelling waves in the spanwise direction (Jiang et al. Reference Jiang, Cheng and An2017a) and follow the nature of the underlying instability modes which are spanwise periodic (e.g. Henderson Reference Henderson1997; Sheard et al. Reference Sheard, Fitzgerald and Ryan2009). The internal flow followed an impulsive start.
The 2-D mesh in the x–y plane consisted of 92 828 cells. Figure 1(b) shows a close-up view of the 2-D mesh near the cylinder. The cylinder surface was discretised with 128 nodes. The height of the first layer of mesh next to the cylinder was 0.008h, which resulted in the smallest cell size at the four corners of the cylinder being 0.008h × 0.008h. A relatively high resolution was used in the wake region by specifying the streamwise cell size at the wake centreline (y = 0) increasing linearly from 0.04h at x/h = 1.5 to 0.1h at x/h = 20. The 3-D mesh was constructed by replicating the 2-D mesh along the z-direction with a spanwise cell size Δz = 0.1h.
For each case, the time step size was fixed at ΔtU/h = 0.00186, which corresponded to a Courant–Friedrichs–Lewy (CFL) limit of 0.5. The CFL number is defined as
 \begin{equation}\textrm{CFL} = \frac{{|u |\mathrm{\Delta }t}}{{\Delta l}},\end{equation}
where |u| is the magnitude of the velocity through a cell, and Δl is the cell size in the direction of the velocity.
2.3. Mesh convergence
Based on the reference mesh introduced in § 2.2, a mesh dependence study was performed at Re = 250 (the largest Re for the present DNS by OpenFOAM) with two variations.
(i) A mesh refined in the z-direction, where Δz was reduced from 0.1h to 0.05h.
(ii) A mesh refined in the x–y plane, where the numbers of cells in both the x- and y-directions were 1.5 times those of the reference mesh, while the general topology of the mesh remained unchanged. In particular, the number of cells around the cylinder surface was increased by 1.5 times, while the height of the first layer of mesh next to the cylinder was reduced by 1.5 times. For this case, the time step size was also reduced by 1.5 times so as to satisfy the CFL limit of 0.5.
Table 1 lists some major flow properties calculated with the three meshes. The drag and lift coefficients (CD and CL) and the Strouhal number (St) are defined as
 \begin{gather}{C_D} = \frac{{{F_D}}}{{\frac{1}{2}\rho {U^2}h{L_z}}},\end{gather}
 \begin{gather}{C_L} = \frac{{{F_L}}}{{\frac{1}{2}\rho {U^2}h{L_z}}},\end{gather}
 \begin{gather}St = \frac{{{f_L}h}}{U},\end{gather}
where FD and FL are the drag and lift forces on the cylinder, respectively, and fL is the frequency of the fluctuating lift force, which is determined as the peak frequency derived from the fast Fourier transform (FFT) of the time history of CL. The time-averaged drag and lift coefficients are denoted  $\overline {{C_D}}$ and
 $\overline {{C_L}}$, respectively. The root-mean-square lift coefficient is calculated as
 \begin{equation}{C^{\prime}_L} = \sqrt {\frac{1}{N}\sum\limits_{i = 1}^N {{{({C_{L,i}} - \overline {{C_L}} )}^2}} } ,\end{equation}
where N is the number of values in the time history. The wake recirculation length (Lr) is defined as the horizontal distance between the centre of the cylinder (x/h = 0) and the wake stagnation point, which is averaged over both time and the cylinder span. For each case listed in table 1, the time average was performed for at least 650 non-dimensional time units (defined as t* = tU/h), after discarding an initial period of at least 350 non-dimensional time units.
Mesh dependence check of some major flow properties for Re = 250. The results other than the reference case are shown by the relative differences with respect to those of the reference case.

As shown in table 1, the flow properties calculated with the two refined meshes are very close to those calculated with the reference mesh.
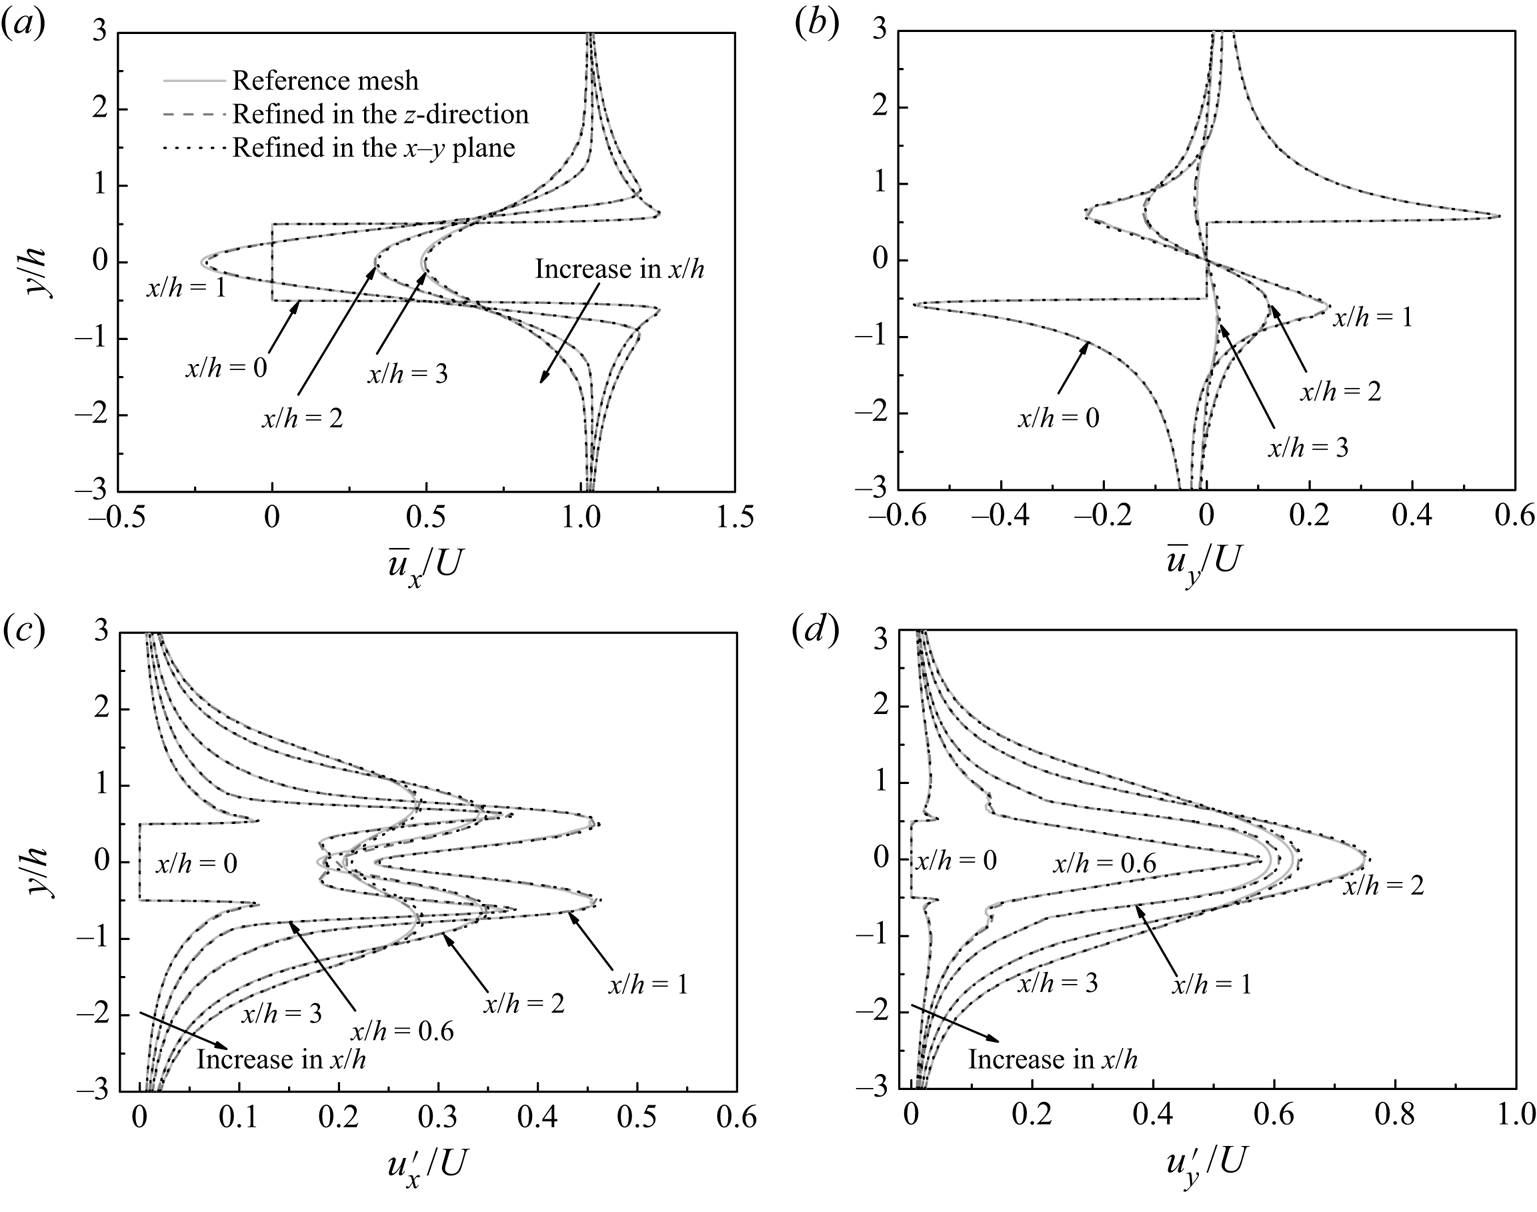
In addition, for the three cases listed in table 1, figure 2 shows the time-averaged and root-mean-square velocity profiles sampled at a few streamwise locations in the wake. The velocity profiles were also averaged over the cylinder span. The time-averaged streamwise and transverse velocities are denoted as  $\overline {{u_x}}$ and
 $\overline {{u_y}}$, respectively, while the root-mean-square streamwise and transverse velocities are calculated as
 \begin{gather}{u^{\prime}_x} = \sqrt {\frac{1}{N}\sum\limits_{i = 1}^N {{{({u_{x,i}} - \overline {{u_x}} )}^2}} } ,\end{gather}
 \begin{gather}{u^{\prime}_y} = \sqrt {\frac{1}{N}\sum\limits_{i = 1}^N {{{({u_{y,i}} - \overline {{u_y}} )}^2}} } .\end{gather}
Mesh dependence check of the velocity profiles sampled at a few streamwise locations for Re = 250: (a) time-averaged streamwise velocity profiles, (b) time-averaged transverse velocity profiles, (c) root-mean-square streamwise velocity profiles and (d) root-mean-square transverse velocity profiles. The velocity profiles were also averaged over the cylinder span.

As shown in figure 2, the velocity profiles calculated with the two variation cases agreed well with those calculated with the reference case, with the largest difference at any (x, y) location being smaller than 0.02U. Based on the results shown in table 1 and figure 2, the reference mesh was considered adequate and was adopted for the present study.
2.4. Onset of three-dimensionality
For flow past a diamond cylinder, the flow transitions from two- to three-dimensional through the mode A wake instability (Tong et al. Reference Tong, Luo and Khoo2008; Sheard et al. Reference Sheard, Fitzgerald and Ryan2009; Yoon et al. Reference Yoon, Yang and Choi2010). Floquet stability analysis has been a preferred method in determining the Recr and λcr values for this instability, e.g. (Recr, λcr/h) = (116, 4.0) by Sheard et al. (Reference Sheard, Fitzgerald and Ryan2009) and (120, 4.2) by Yoon et al. (Reference Yoon, Yang and Choi2010). In this section, Floquet analysis was used to confirm the (Recr, λcr/h) values and to map out the neutral instability curve for mode A. The present Floquet analysis followed the methodology presented in Barkley & Henderson (Reference Barkley and Henderson1996) and the numerical framework embedded in the open-source code Nektar++ (Cantwell et al. Reference Cantwell2015) (since Floquet analysis is not readily available in the standard framework of OpenFOAM but has been well tested in Nektar++). The computational domain size used in Nektar++ for the Floquet analysis was the same as that introduced in § 2.2 for OpenFOAM. The macro-element mesh for Nektar++ used 32 macro-elements around the cylinder perimeter, 0.0388h × 0.0388h for the smallest cell size at the four corners of the cylinder, and a relatively high wake resolution such that the streamwise cell size at the wake centreline increased linearly from 0.196h at x/h = 1.5 to 0.810h at x/h = 40. Overall, the macro-element mesh was approximately 4 to 5 times coarser in both the x- and y-directions than the mesh used in OpenFOAM. The macro-elements were then subdivided using fifth-order Lagrange polynomials (Np = 5) on the Gauss–Lobatto–Legendre points for the quadrilateral expansions. Owing to the use of the high-order spectral/hp element method for Nektar++ (Karniadakis & Sherwin Reference Karniadakis and Sherwin2005), the overall mesh resolution for Nektar++ was finer than that for the FVM-based OpenFOAM.
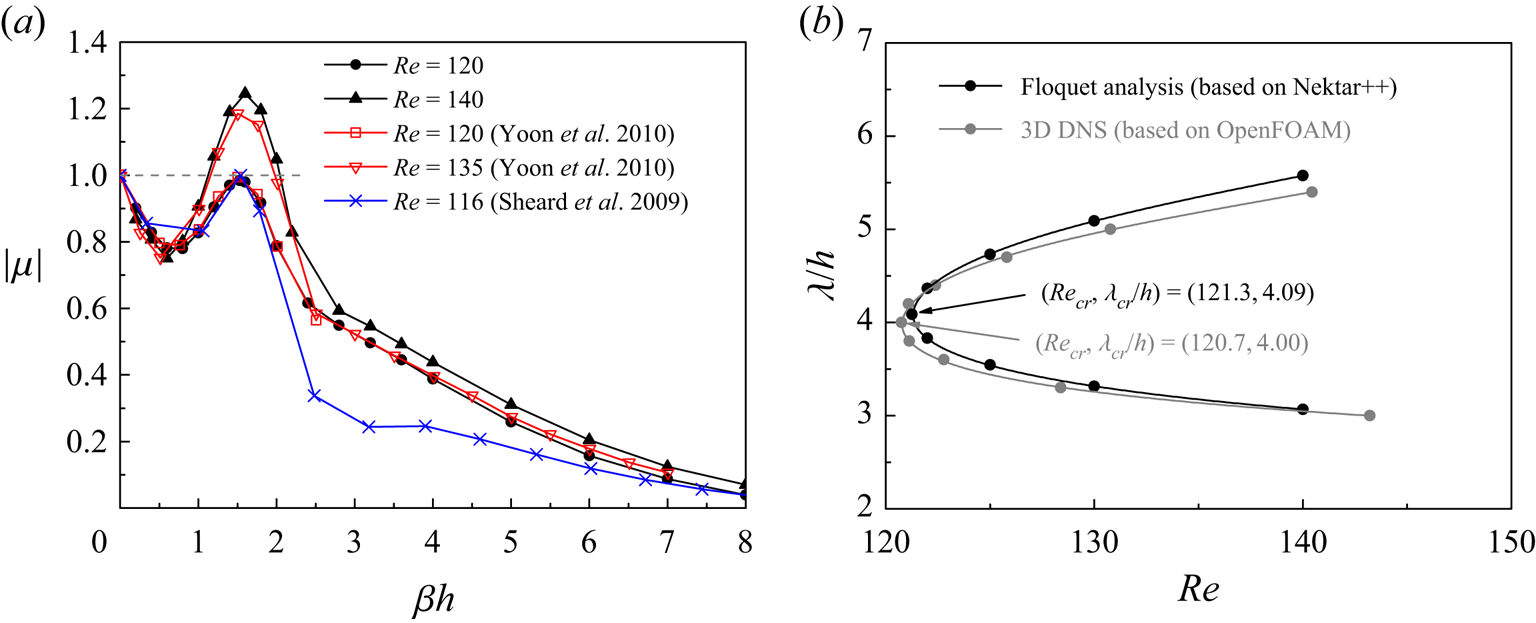
Figure 3(a) shows the dependence of the dominant Floquet multiplier μ on the spanwise wavenumber β (= 2π/λ) for Re = 120 and 140, together with similar results predicted by Sheard et al. (Reference Sheard, Fitzgerald and Ryan2009) and Yoon et al. (Reference Yoon, Yang and Choi2010). In figure 3(a), a single peak region of |μ| > 1.0 is observed, where the μ values are real and positive, which suggests that this peak region corresponds to the mode A instability. Figure 3(b) shows the neutral instability curve of mode A. The (Recr, λcr/h) values for the present Floquet analysis are determined based on a linear interpolation of the peak |μ| values at Re = 121 and 122 to the neutral instability of |μ| = 1.0. The results (Recr, λcr/h) = (121.3, 4.09) agree well with those reported by Sheard et al. (Reference Sheard, Fitzgerald and Ryan2009) and Yoon et al. (Reference Yoon, Yang and Choi2010). In addition, a mesh convergence check was performed at (Re, λ/h) = (120, 4.107), where an increase in Np from 5 to 7 resulted in a decrease in |μ| of 0.01%, suggesting the use of Np = 5 was adequate.
Floquet stability analysis results: (a) dependence of the dominant Floquet multiplier μ on the spanwise wavenumber β, and (b) the neutral instability curve of mode A.

As shown in figure 3(b), the neutral instability curve for mode A was also calculated through 3-D DNS (based on OpenFOAM). For the DNS method, only a half of a spanwise period of the mode A structure was simulated (by using Lz = λ/2, Lz/Δz = 10 and symmetry boundary conditions at the two lateral boundaries to isolate a half of a spanwise period of mode A), such that the computational cost of this method was comparable to that of the Floquet analysis. More details on this method can be found in Jiang et al. (Reference Jiang, Cheng, Draper and An2017b). The present DNS method predicted (Recr, λcr/h) = (120.7, 4.00), which agreed well with the results predicted by the Floquet analysis. In addition, a mesh convergence check at Lz = λ/2 = 2h showed that by (i) doubling the mesh layers in the spanwise direction (to Lz/Δz = 20), (ii) doubling the cell numbers in both the x- and y-directions or (iii) doubling the domain size in the x–y plane (to −80 ≤ x/h ≤ 80 and −80 ≤ y/h ≤ 80), the variations in Recr were all within 1%. In particular, variation case (i) predicted also Recr = 120.7. For the 3-D wake transition process investigated in § 3, the mesh resolution used in OpenFOAM was identical to that used in the variation case (i), such that (Recr, λcr/h) = (120.7, 4.00) was directly applicable to the OpenFOAM cases examined in § 3.
3. Numerical results
3.1. Three-dimensional wake transition
In the present study, the 3-D wake transition beyond Recr = 120.7 was examined up to Re = 250. For each Re, the flow was deemed fully developed after a time integration of 1000 non-dimensional time units, which corresponded to ~180 vortex shedding cycles. After that, at least another 1000 non-dimensional time units were used for the statistics and analysis of the fully developed flow. The wake transition process was identified through visualising the streamwise and spanwise vorticity (ωx and ωz) fields, where ωx and ωz are defined in a non-dimensional form as
 \begin{gather}{\omega _x} = \left( {\frac{{\partial {u_z}}}{{\partial y}} - \frac{{\partial {u_y}}}{{\partial z}}} \right)\frac{h}{U},\end{gather}
 \begin{gather}{\omega _z} = \left( {\frac{{\partial {u_y}}}{{\partial x}} - \frac{{\partial {u_x}}}{{\partial y}}} \right)\frac{h}{U}.\end{gather}
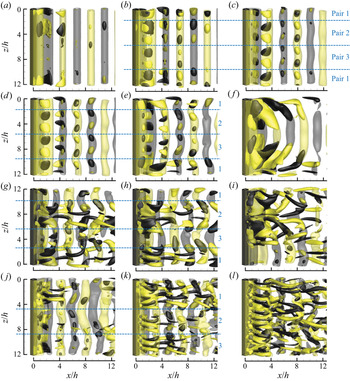
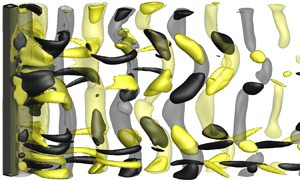
Figure 4 illustrates the streamwise and spanwise vortex structures for Re in different wake transition regimes. In summary, with the increase in Re, the wake undergoes a transition sequence of ‘mode A with global vortex dislocations (Re = Recr − 150) → mode swapping between modes A and B (Re = 160–210) → mode B (Re ≥ 220)’.
Instantaneous vorticity fields in the near wake of a diamond cylinder for (a–f) Re = 125 with t* = 80, 120, 320, 400, 480 and 520, (g–i) Re = 150 with t* = 1605, 1645 and 1675, (j–k) Re = 190 with t* = 1360 and 1380 and (l) Re = 240 with t* = 2125. The translucent iso-surfaces represent spanwise vortices with ωz = ±1.0, while the opaque iso-surfaces represent streamwise vortices with ωx = ±0.02 for panels (a,b), ωx = ±0.3 for panel (c), ωx = ±0.5 for panels (d–f), ωx = ±0.8 for panels (g–i), and ωx = ±1.0 for panels (j–l). Dark grey and light yellow denote positive and negative vorticity values, respectively. The flow is from left to right past the cylinder on the left.

Specifically, for Re = Recr − 150, the initial 3-D structure developed in the wake is a relatively ordered mode A structure (figure 4b–d). As shown in figure 4(b–d), the mode A structure originates and grows from the primary vortex cores, which is consistent with the origin of the mode A instability identified based on a circular cylinder (Williamson Reference Williamson1996; Leweke & Williamson Reference Leweke and Williamson1998; Thompson et al. Reference Thompson, Leweke and Williamson2001). With the evolution over time, the relatively ordered mode A structure evolves into a pattern with vortex dislocations (figure 4d–f). The origin of the vortex dislocations shown in figure 4(f) can be traced back to a slight difference in strength in the three pairs of the mode A streamwise vortices shown in figure 4(b–e). Ever since the emergence of the three mode A streamwise vortex pairs at t* ~ 100 (from figures 4a to 4b), pair 1 is always slightly stronger than the other two pairs (figure 4b–e). With the evolution in time, this stronger pair of mode A structure grows into a local vortex dislocation in figure 4(e). After that, the local vortex dislocation develops along the spanwise direction and engulfs the other two pairs of mode A structure, resulting in a pattern of global vortex dislocation for the saturated flow (figure 4f).
For the saturated flow, scattered mode A streamwise vortex pairs emerge intermittently. Depending on the Re value, the mode A streamwise vortex pairs developed in the wake (e.g. figure 4d,g,j) may evolve into one of the following two patterns:
(i) The mode A streamwise vortex pair evolves into a local vortex dislocation, e.g. pair 1 in figure 4(d,e) and pair 2 in figure 4(g,h).
(ii) The mode A streamwise vortex pair evolves into the mode B structure, e.g. pair 1 in figure 4(g) and pairs 2 and 3 in figure 4(j).
For Re = Recr − 140, only pattern (i) exists. Any particular mode A streamwise vortex pair that evolves through pattern (i) would engulf the unevolved mode A streamwise vortex pairs and lead to a pattern of global vortex dislocations (e.g. figure 4d–f). For Re = 150–210, both patterns exist. A special condition occurs at Re = 150, where although pattern (ii) exists occasionally, it is always accompanied by the co-existence of pattern (i) and would thus still evolve into global vortex dislocations (e.g. figure 4g–i). In summary, for Re = Recr − 150 the saturated flow is always represented by global vortex dislocations.
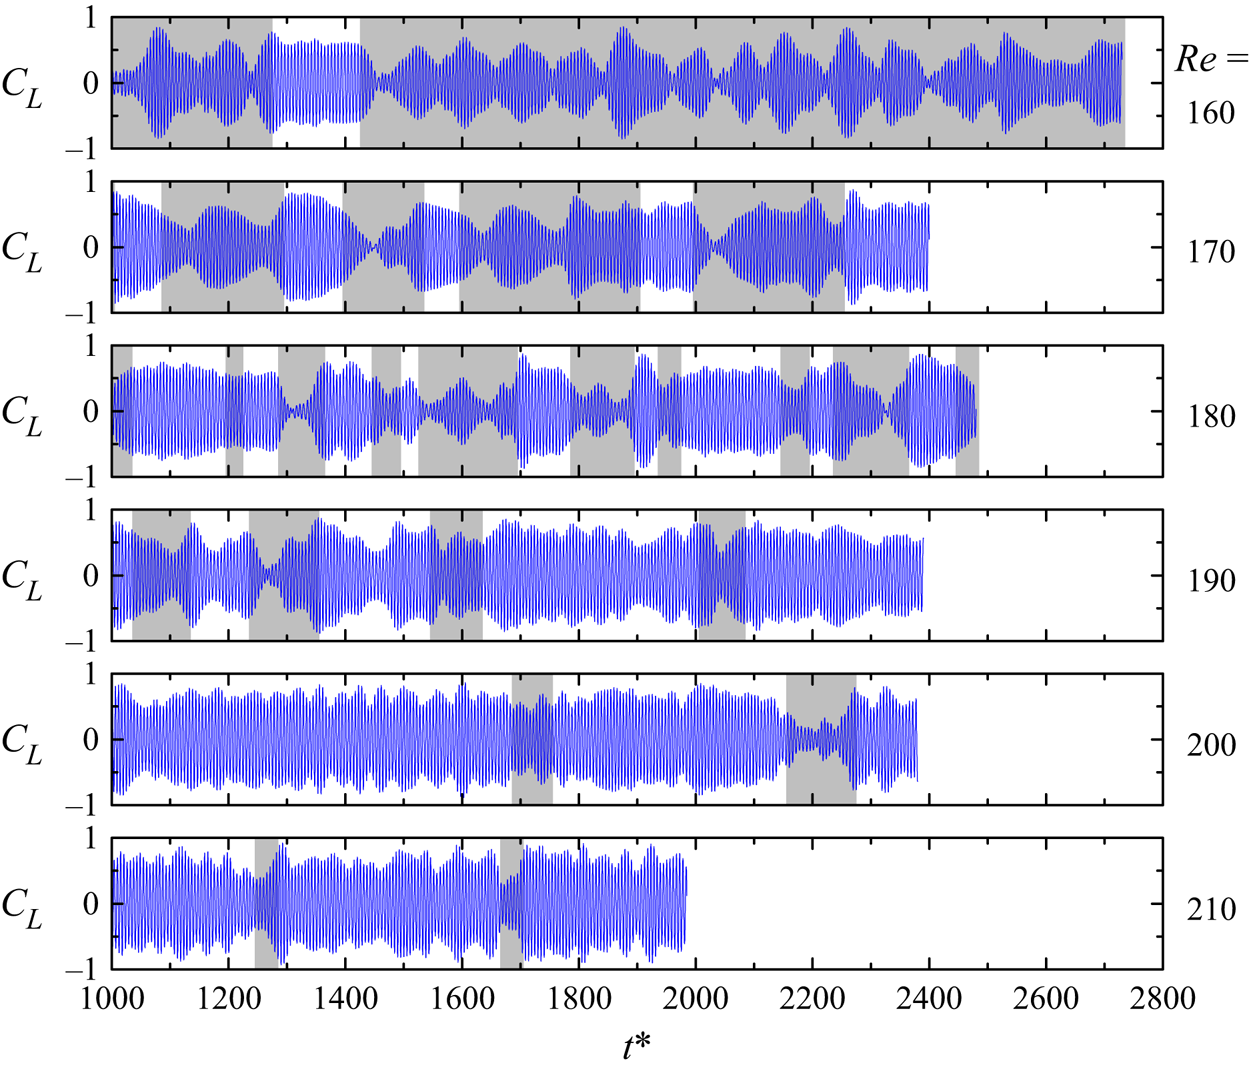
For Re = 160–210, global vortex dislocations appear intermittently in the saturated flow. Similar to Re = 150, any mode A streamwise vortex pair that evolves through pattern (i) would lead to global vortex dislocations, even when other mode A streamwise vortex pair(s) evolve through pattern (ii) at the same time (e.g. figure 4g–i). In contrast, global vortex dislocation is suppressed when all of the mode A streamwise vortex pairs evolve through pattern (ii) (e.g. figure 4j,k). This pattern (i)/(ii) of evolution results in an intermittent appearance of global vortex dislocations (i.e. mode swapping) for Re = 160–210.
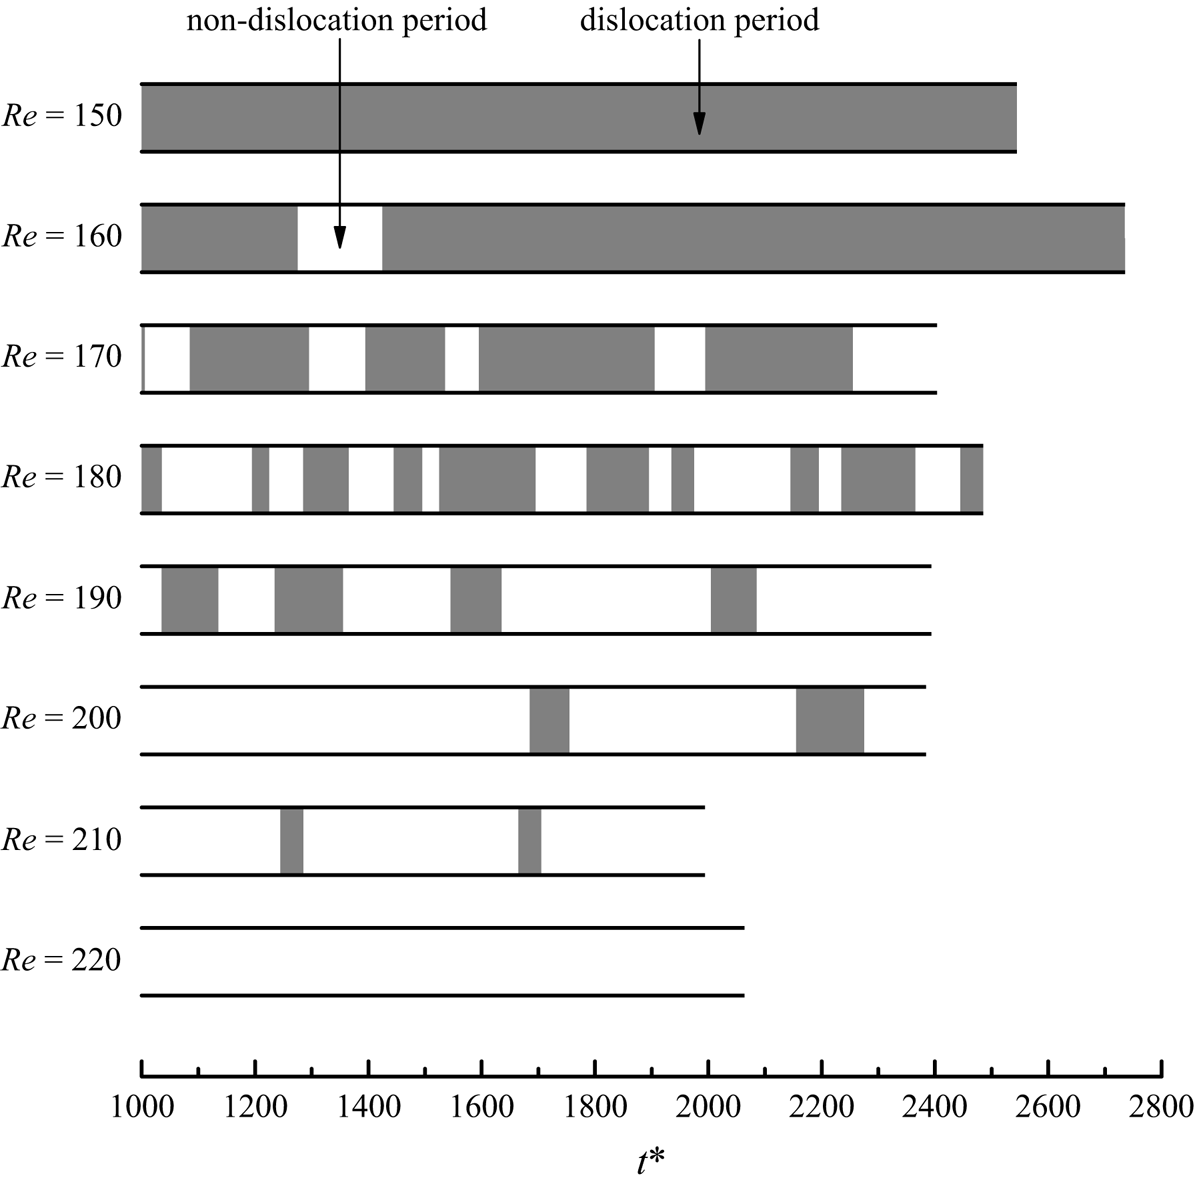
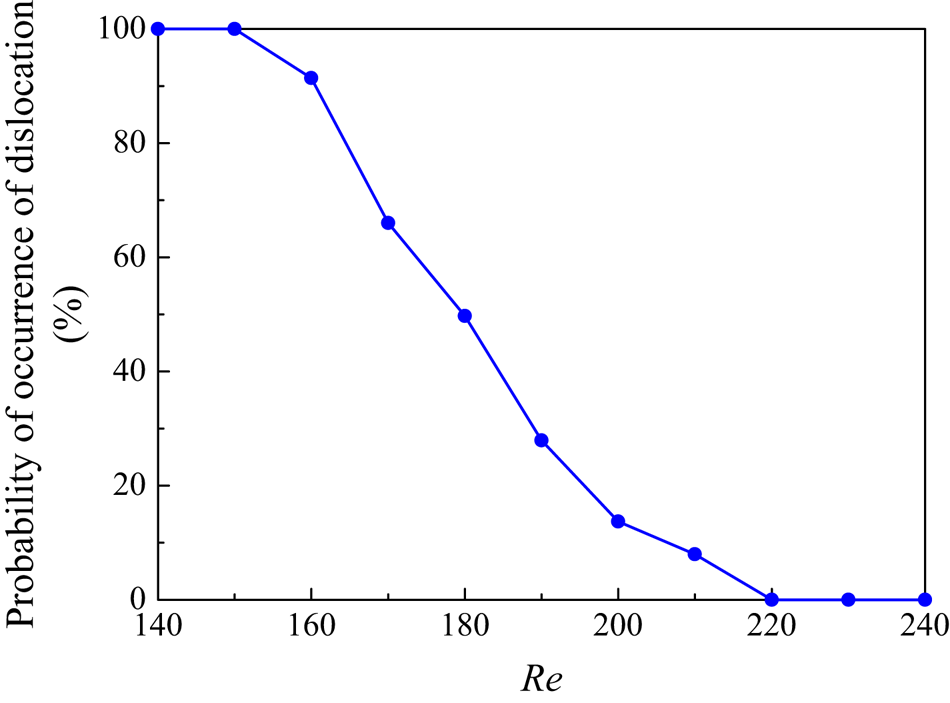
The mode swapping over Re = 160–210 is quantified in figure 5. The shaded and clear blocks indicate dislocation and non-dislocation time periods, respectively, which are determined by visually examining the time evolution of the streamwise vorticity field (e.g. those shown in figure 4) with an interval of 10 non-dimensional time units. The global vortex dislocations are spotted easily as they appear over continuous time periods and normally occupy the entire domain (Jiang et al. Reference Jiang, Cheng, Draper, An and Tong2016). Based on the time histories shown in figure 5, the probability of occurrence of dislocation is further quantified in figure 6. As shown in figure 6, the probability of occurrence of dislocation decreases monotonically with increasing Re. With the increase in Re, the mode B structures are more likely to be destabilised and in turn replace/stabilise the mode A streamwise vortex pairs through the pattern (ii) evolution, which results in a reducing likelihood of pattern (i), i.e. a reducing likelihood of dislocation. It is also noticed that the mode swapping shown in figure 5 is most frequent when the probability of occurrence of dislocation is close to 50%.
Quantification of the intermittent appearance of global vortex dislocations in the range of Re = 150–220. The shaded and clear blocks indicate dislocation and non-dislocation time periods, respectively.

Probability of occurrence of vortex dislocation for Re over the mode swapping regime.

For Re ≥ 220, pattern (i) no longer exists. Scattered mode A streamwise vortex pairs, which evolve through pattern (ii) only, are observed for <8% and <2% of the statistical time periods for Re = 220 and 250, respectively, which suggests that for Re ≥ 220 the influence of mode A is minimal. The wake is dominated by disordered mode B structures, as illustrated in figure 4(l).
3.2. Characteristics of the dislocation and non-dislocation periods
Based on the separation of the dislocation and non-dislocation time periods in figure 5, the flow properties, such as the hydrodynamic forces on the cylinder, can also be decomposed into the values corresponding to the dislocation and non-dislocation time periods. Such an analysis has not been performed before in the literature, and is expected to shed new light on the different characteristics of the dislocation and non-dislocation periods.
Figure 7 shows the time histories of CL for Re over the mode swapping regime, overlaid with shaded and clear regions representing dislocation and non-dislocation time periods, respectively. As shown in figure 7, the dislocation periods correspond to local reductions in the fluctuation amplitude of CL, which include some extremely small fluctuation amplitudes over the time history. In particular, the long dislocation periods observed for Re = 160 consist of frequent local reductions in the fluctuation amplitude of CL, except for the non-dislocation period at t* = 1280–1420, where the fluctuation amplitude is sustained at a relatively large level.
Time histories of the lift coefficient for Re = 160–210, overlaid with shaded and clear regions representing dislocation and non-dislocation time periods, respectively.

The local reductions in the fluctuation amplitude of CL for the dislocation periods originate from the local dislocations in the mode A streamwise vortices. As shown in figure 4(e,f,h,i), the local dislocations in the mode A streamwise vortices towards the upstream direction would induce an upstream movement of the corresponding fractions of the spanwise vortex rollers and eventually lead to inclined spanwise vortex rollers at the two sides of the local dislocation. The inclined spanwise vortex rollers shown in figure 4(f,i) indicate phase differences in the primary vortex shedding at different spanwise locations up to at least 180 ° (the inclined spanwise vortex rollers may reach the streamwise location for the subsequent spanwise vortex roller), which partially cancels out the integrated lift coefficient. In contrast, the mixed mode A and B structures in the non-dislocation periods do not induce significant inclinations in the spanwise vortex rollers (e.g. figure 4j,k), such that the fluctuation amplitudes of CL are relatively large.
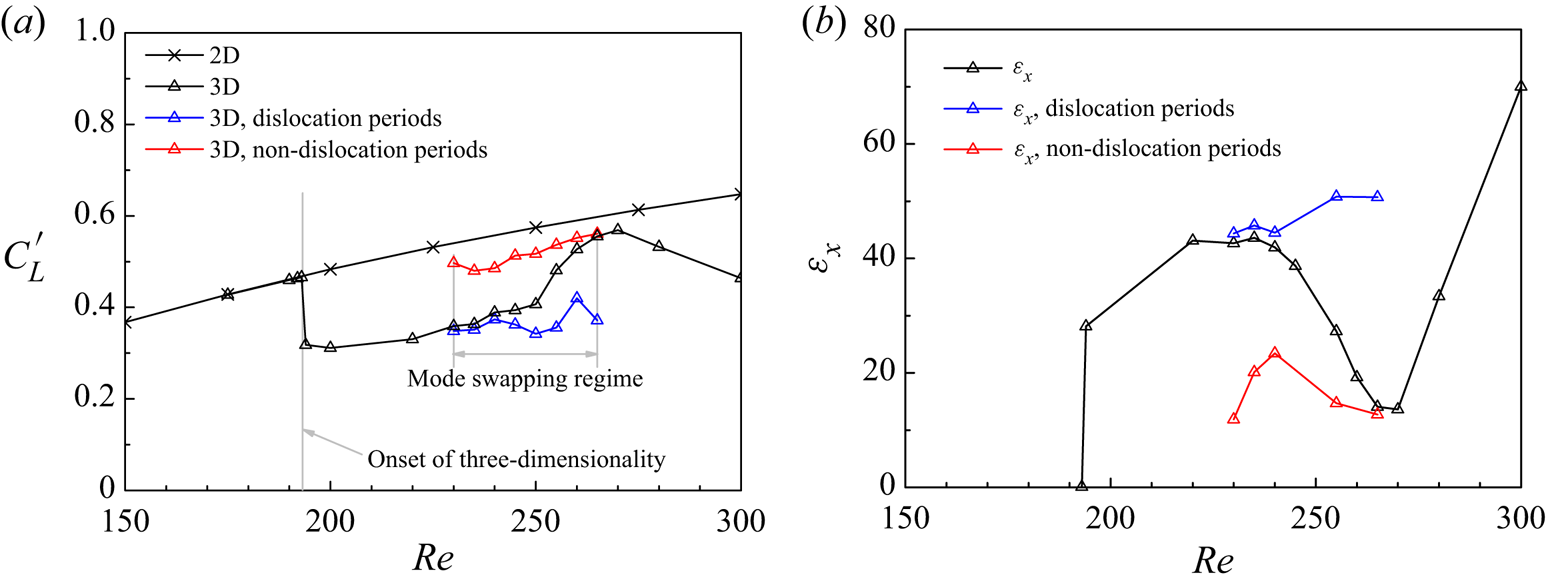
Figure 8(a) shows the  ${C^{\prime}_L}\text{--}Re$ relationship over the wake transition regimes. The
 ${C^{\prime}_L}$ values over the mode swapping regime are further decomposed into the ones corresponding to the dislocation and non-dislocation time periods. As expected, the
 ${C^{\prime}_L}$ values for the dislocation periods are consistently smaller than those for the non-dislocation periods. With the gradual decrease in the probability of occurrence of dislocation over Re = 160–210 (figure 6), the overall
 ${C^{\prime}_L}$ value moves gradually from the dislocation branch to the non-dislocation branch (figure 8a).
(a) The  ${C^{\prime}_L}\text{--}Re$ relationship, and (b) the
 $\varepsilon_x\text{--}Re$ and
 $\varepsilon_y\text{--}Re$ relationships (integrated over x/h = 0–20) over the wake transition regimes.

Figure 8(b) examines the degree of flow three-dimensionality in the wake, quantified by the time-averaged streamwise and transverse enstrophies ( $\varepsilon_x$ and
 $\varepsilon_y$) defined as
 \begin{gather}{\varepsilon _x} = \frac{1}{2}\int_V {\omega _x^2\,\textrm{d}V} ,\end{gather}
 \begin{gather}{\varepsilon _y} = \frac{1}{2}\int_V {\omega _y^2\,\textrm{d}V} ,\quad \textrm{where}\;{\omega _y} = \left( {\frac{{\partial {u_x}}}{{\partial z}} - \frac{{\partial {u_z}}}{{\partial x}}} \right)\frac{h}{U},\end{gather}
where V is the volume of the flow field of interest. The enstrophies shown in figure 8(b) are integrated over the wake region of x/h = 0–20. In general, the degree of three-dimensionality increases gradually with increasing Re. In addition, the  $\varepsilon_x$ and
 $\varepsilon_y$ values over the mode swapping regime are decomposed into the ones corresponding to the dislocation and non-dislocation periods. The enstrophies for the dislocation periods are slightly larger than those for the non-dislocation periods, which suggests that the dislocation periods have larger degrees of flow three-dimensionality than the non-dislocation periods. The larger degrees of flow three-dimensionality for the dislocation periods are consistent with the larger reductions in the
 ${C^{\prime}_L}$ values from their 2-D counterparts shown in figure 8(a).
In comparison, figure 9 shows the  ${C^{\prime}_L}\text{--}Re$ and
 $\varepsilon_x\text{--}Re$ relationships for flow past a circular cylinder. In the mode swapping regime of Re ~ 230–265 (Williamson Reference Williamson1996; Barkley et al. Reference Barkley, Tuckerman and Golubitsky2000; Sheard et al. Reference Sheard, Thompson and Hourigan2003; Jiang et al. Reference Jiang, Cheng, Draper, An and Tong2016), the
 ${C^{\prime}_L}$ and
 $\varepsilon_x$ values corresponding to the dislocation and non-dislocation periods are calculated in the present study by further analysing the numerical cases reported by Jiang et al. (Reference Jiang, Cheng, Draper, An and Tong2016), where the dislocation and non-dislocation time periods are identified in a similar manner to figure 5. Similar to the diamond cylinder, for a circular cylinder the dislocation periods also display larger degrees of flow three-dimensionality and larger reductions in
 ${C^{\prime}_L}$ (from their 2-D counterparts) than the non-dislocation periods (figure 9).
(a) The  ${C^{\prime}_L}\text{--}Re$ relationship, and (b) the
 $\varepsilon_x\text{--}Re$ relationship (integrated over x/D = 0–10) over the wake transition regimes for flow past a circular cylinder.

However, a major difference between a circular and a diamond cylinder is that for a circular cylinder there is a critical condition at the upper end of the mode swapping regime (Williamson Reference Williamson1996), where a local peak or trough is observed for various flow properties (see e.g. figure 9). In contrast, such a critical condition does not appear for a diamond cylinder (figure 8). Such a difference between a circular and a diamond cylinder originates from the development of particularly ordered and parallel mode B structures for the non-dislocation periods of a circular cylinder (see e.g. figure 14(c) of Jiang et al. Reference Jiang, Cheng, Draper, An and Tong2016) whereas more disordered mode B structures for the non-dislocation periods of a diamond cylinder (see e.g. figure 4k). For a circular cylinder, the particularly ordered mode B structures for the non-dislocation periods induce  $\varepsilon_x$ values less than half of those for the dislocation periods (figure 9b) and
 ${C^{\prime}_L}$ values very close to the largest possible level, i.e. their 2-D counterparts (figure 9a). In contrast, the disordered mode B structures observed for the non-dislocation periods of a diamond cylinder induce relatively large degrees of flow three-dimensionality comparable to those of the dislocation periods (figure 8b) and
 ${C^{\prime}_L}$ values much smaller than their 2-D counterparts (figure 8a). Since the non-dislocation branches shown in figure 8 are now closer to the dislocation branches than the 2-D curves (for figure 8b the 2-D results are
 $\varepsilon_x=\varepsilon_y=0$), the overall
 ${C^{\prime}_L}\text{--}Re$,
 $\varepsilon_x\text{--}Re$ and
 $\varepsilon_y\text{--}Re$ curves, which are bounded by the dislocation and non-dislocation branches, do not show obvious peak/trough towards their 2-D counterparts at the upper end of the mode swapping regime. Instead, only slight changes in the variation trends may be observed when the overall curve detaches the dislocation branch at Re ~ 160 and attaches the non-dislocation branch at Re ~ 210. These slight changes may easily be overlooked when the dislocation and non-dislocation branches are switched off.
3.3. Vortex shedding frequency
Figure 10 shows the frequency spectra of CL for the determination of the vortex shedding frequency. The frequency spectra are obtained from the FFT of the time histories of CL. Each frequency spectrum shown in figure 10 contains a main peak, accompanied by broadband frequencies at the two sides of the peak, owing to the irregularity of the 3-D flows.
Frequency spectra of CL for Re = 140–240.

Based on the separation of the time history of CL into the dislocation and non-dislocation periods in figure 7, the frequency spectrum of CL can also be decomposed by performing FFT separately on the dislocation and non-dislocation ranges of the time history. Figure 11(a) shows an example of the decomposition of the frequency spectrum of CL for Re = 180. It is seen that the peak frequency corresponding to the non-dislocation periods is much closer to that of the dislocation periods than that calculated through 2-D DNS, which is similar to the variation trends of  $\varepsilon_x$ and
 $\varepsilon_y$ shown in figure 8(b). Jiang & Cheng (Reference Jiang and Cheng2017) also showed based on a circular cylinder that in the mode swapping regime the degree of reduction in the 3-D St value from its 2-D counterpart correlates well with the degree of flow three-dimensionality. In comparison, figure 11(b) shows a circular cylinder example at Re = 250, where the peak frequency corresponding to the non-dislocation periods is much closer to its 2-D counterpart than that of the dislocation periods. For the circular cylinder, the difference between the peak frequencies corresponding to the dislocation and non-dislocation periods (of ΔSt = 0.0104) can be revealed by the frequency spectrum corresponding to the entire time history of CL, where two peaks of ΔSt = 0.00997 apart are observed (figure 11b). For the diamond cylinder, however, because the difference between the peak frequencies corresponding to the dislocation and non-dislocation periods (of ΔSt = 0.00195) is even smaller than the range of St under the main frequency peak (of
 $\mathrm{\Delta }St\mathrm{\ \mathbin{\lower.3ex\hbox{$\buildrel> \over {\smash{\scriptstyle\sim}\vphantom{_x}}$}}\ }0.005$), the frequency spectrum corresponding to the entire time history of CL cannot display the twin-peaked pattern. The relatively small ΔSt between the dislocation and non-dislocation branches over the mode swapping regime can also be viewed in figure 10 by highlighting the peak frequencies of Re = 150 (just before mode swapping) and Re = 220 (just after mode swapping) using two vertical lines, where a similar minor difference of ΔSt = 0.00318 is observed.
Frequency spectra of CL for (a) flow past a diamond cylinder at Re = 180, and (b) flow past a circular cylinder at Re = 250.

Figure 12 shows the St–Re relationship over the wake transition regimes for flow past a diamond cylinder. At the onset of three-dimensionality, a sudden drop in the St value (of 5.6%) is observed, which, according to Jiang et al. (Reference Jiang, Cheng and An2018a), is consistent with the subcritical nature of the mode A instability for a diamond cylinder (Sheard et al. Reference Sheard, Fitzgerald and Ryan2009) and the associated sudden increase in the degree of flow three-dimensionality at Recr (figure 8b). For Re > Recr, a continuous St–Re relationship is observed for the 3-D flows, including the mode swapping regime highlighted in figure 12, since the twin-peaked pattern is not observed for the frequency spectra shown in figure 10.
The St–Re relationship over the wake transition regimes.

3.4. The drag coefficient
Figure 13 shows the  $\overline {{C_D}}\text{--}Re$ relationship over the wake transition regimes. In addition, the total drag coefficient is decomposed into the pressure and viscous components. The present 2-D results agree relatively well with those reported by Yoon et al. (Reference Yoon, Yang and Choi2010). As Re exceeds the onset of the primary wake instability, the pressure drag starts to increase while the viscous drag continues to decrease, which is similar to that of a circular cylinder investigated in Henderson (Reference Henderson1995). However, a difference to a circular cylinder (Henderson Reference Henderson1995) or a square cylinder (Jiang & Cheng Reference Jiang and Cheng2018) is that for a diamond cylinder the increase rate of the pressure drag is larger than the decrease rate of the viscous drag, such that the total drag exhibits an increase right after the onset of the primary wake instability. At the onset of the secondary wake instability, both the pressure and viscous drag display an approximately 7% decrease, which is consistent with the sudden decrease/increase in St (figure 12),
 ${C^{\prime}_L}$ (figure 8a) and the degree of flow three-dimensionality (figure 8b) discussed in §§ 3.2 and 3.3.
The  $\overline {{C_D}}\text{--}Re$ relationship over the wake transition regimes.

Based on the decomposition of the pressure and viscous drag coefficients (denoted  $\overline {{C_{D,p}}}$ and
 $\overline {{C_{D,v}}}$, respectively) in figure 13, the ratio between the pressure drag and the total drag
 $(\overline {{C_{D,p}}} /\overline {{C_D}} )$ is quantified in figure 14. In comparison, figure 14 also shows the results for a circular cylinder, a square cylinder (with α = 0 °) and inclined square cylinders with α = 15.3 ° and 29.7 °, based on the
 $\overline {{C_{D,p}}}$ and
 $\overline {{C_{D,v}}}$ values reported by Jiang & Cheng (Reference Jiang and Cheng2018) and Yoon et al. (Reference Yoon, Yang and Choi2010). The red vertical bars in figure 14 indicate the onset of three-dimensionality for circular, square and diamond cylinders, where the 3-D results appear to the right of them. In addition, the 2-D simulations have been extended beyond the onset of three-dimensionality (although unphysical in real situations), and the 2-D results show excellent agreement with the corresponding 3-D results. The agreement between the 2-D and 3-D results is attributed to a very similar percentage decrease in the pressure and viscous drag at the onset of three-dimensionality (e.g. figure 13). Therefore, the 2-D results for α = 15.3 ° and 29.7 ° can be used without having to consider the effect of three-dimensionality.
The ratio between the pressure drag and the total drag for different cylinders. The red vertical bars indicate the onset of three-dimensionality.

A common feature for the cylinders investigated in figure 14 is that, for each cross-sectional shape, the projected length perpendicular to the incoming flow (which contributes to the pressure drag) is the same as the projected length parallel to the incoming flow (which contributes to the viscous drag). Therefore, the ratio  $\overline {{C_{D,p}}} /(\overline {{C_{D,p}}} + \overline {{C_{D,v}}} ) = \overline {{C_{D,p}}} /\overline {{C_D}}$ serves as a direct indication of the bluffness of the cylinder. As shown in figure 14, the
 $\overline {{C_{D,p}}} /\overline {{C_D}}$ value, and hence the bluffness of the cylinder, is largest for a square cylinder, followed by inclined square cylinders with increasing α from 0 ° to 45 °, and smallest for a circular cylinder.
3.5. Floquet analysis of the 3-D wake instability modes
As discussed in § 3.1, the mode B structures observed at Re ≥ 150 are destabilised by the mode A structures that exist in the wake. On the other hand, it is also of interest to examine the global instability of mode B (and other modes) to the 2-D base flow, where the interactions between the modes A and B structures are eliminated. In general, Floquet stability analysis has been a preferred method in determining the 3-D modes that are unstable to the 2-D base flow, e.g. the mode B instability of a circular cylinder (Barkley & Henderson Reference Barkley and Henderson1996; Posdziech & Grundmann Reference Posdziech and Grundmann2001) and a square cylinder (Robichaux et al. Reference Robichaux, Balachandar and Vanka1999; Sheard et al. Reference Sheard, Fitzgerald and Ryan2009; Park & Yang Reference Park and Yang2016), among many others. A necessary condition for the use of the Floquet analysis is that the 2-D base flow is time periodic (Barkley & Henderson Reference Barkley and Henderson1996). For a diamond cylinder, however, Sheard et al. (Reference Sheard, Fitzgerald and Ryan2009) found that the 2-D base flow became aperiodic at  $Re\mathrm{\ \mathbin{\lower.3ex\hbox{$\buildrel> \over {\smash{\scriptstyle\sim}\vphantom{_x}}$}}\ }140$, such that no Floquet analysis had been performed for
 $Re\mathrm{\ \mathbin{\lower.3ex\hbox{$\buildrel> \over {\smash{\scriptstyle\sim}\vphantom{_x}}$}}\ }140$ to identify the instability modes other than mode A.
In the present study, the 3-D instability modes of a diamond cylinder for  $Re\mathrm{\ \mathbin{\lower.3ex\hbox{$\buildrel> \over {\smash{\scriptstyle\sim}\vphantom{_x}}$}}\ }140$ are examined by the Floquet analysis with caution. The aperiodicity of the 2-D base flow is illustrated in figure 15(a,b) at Re = 300 with two instantaneous vorticity fields of one primary vortex shedding period (T* = TU/h) apart, where the vorticity fields become aperiodic at
 $x/h\mathrm{\ \mathbin{\lower.3ex\hbox{$\buildrel> \over {\smash{\scriptstyle\sim}\vphantom{_x}}$}}\ }7$. In addition, figure 15(c) shows the locations of the vortex centres extracted from 19 snapshots of the vorticity field (including the vorticity field shown in figure 15a), which illustrates more clearly that the wake becomes aperiodic at
 $x/h\mathrm{\ \mathbin{\lower.3ex\hbox{$\buildrel> \over {\smash{\scriptstyle\sim}\vphantom{_x}}$}}\ }7$. The two vertical dashed lines in each panel of figure 15 mark the streamwise locations where the wake transitions from the primary vortex street to the two-layered and the secondary vortex streets. The transition locations are determined as the x/h values corresponding to the local maxima in the time-averaged transverse velocity field shown in figure 15(d) (Jiang & Cheng Reference Jiang and Cheng2019). A mesh convergence check conducted at Re = 300 (the largest Re considered by the Nektar++ model used in this section) shows that an increase in Np from 5 to 7 results in variations in the two transition locations of 0.5%, which suggests that the use of Np = 5 is adequate. As shown in figure 15(a–c), the wake remains periodic when the primary vortices rearrange themselves to the two-layered pattern, while the wake gradually becomes aperiodic when the two-layered vortices rearrange themselves for the irregular vortex merging (see e.g. figure 15b) at the transition to the secondary vortex street. In other words, the aperiodicity of the 2-D base flow arises from the transition from the two-layered to the secondary vortex street. Such a transition is not observed for Re = 140 within the wake domain length up to x/h = 40 (and the entire wake is perfectly periodic), but is observed for Re ≥ 160 (and the wake is aperiodic), such that the Floquet analysis of Re ≥ 160 should be conducted with caution.
Characteristics of the 2-D base flow for Re = 300: (a) instantaneous vorticity field at t* = 1400, (b) instantaneous vorticity field at t* = 1400 + T*, (c) locations of the vortex centres extracted from 19 snapshots of the vorticity field (at t* = 1000 to 2800 with an interval of 100) and (d) time-averaged transverse velocity field. The vertical dashed lines mark the two transition locations, while the horizontal dashed line in panels (c,d) marks the wake centreline.

Figure 16 shows the |μ|−β relationships for Re = 300, predicted through the Floquet analysis using two different vortex shedding periods of the base flows, i.e. t* = 1400 − (1400 + T*) and t* = 1600 − (1600 + T*). It is found that the aperiodicity of the base flow results in quantitative uncertainties in the |μ|−β relationship, while, qualitatively, the unstable peaks (i.e. the wake instability modes) are the same. The first peak at βh ~ 0.8–1.8 contains real and positive μ values, which correspond to the mode A instability. The second peak at βh ~ 2.8–4 contains real and negative μ values, which correspond to a subharmonic mode. Based on further computations, the critical Re for the instability of the subharmonic mode is located within 280–285. Other than these two modes, no additional instability modes are identified by the Floquet analysis over Re = 120–300 (with an interval of 20).
The |μ|−β relationships for Re = 300, predicted through the Floquet analysis using different base flows. The horizontal dashed line marks the neutral instability of |μ| = 1.0.

To eliminate the quantitative uncertainties in the |μ|−β relationship induced by the aperiodicity of the base flow, phase-averaged (hence T-periodic) base flow is attempted for the Floquet analysis. The phase-averaged base flow is generated based on 200T of the fully developed original 2-D flow. Figure 17(a,b) illustrates the phase-averaged base flow for Re = 300 at two phases of T/2 apart. The |μ|−β relationship predicted using the phase-averaged base flow is also shown in figure 16, where, similarly, a mode A and a subharmonic mode are obtained, which suggests again that the aperiodicity of the base flow induces a quantitative but not qualitative influence on the Floquet instability modes. Based on the phase-averaged base flow, Floquet analyses were performed for Re ≥ 160. Figure 18 shows the extended neutral instability curve for mode A up to Re = 300 (cf. figure 3b). In addition, the subharmonic instability mode is identified at Re ≥ 285.
Illustration of T-periodic base flows for Re = 300. Panels (a,b) show instantaneous vorticity fields for the phase-averaged base flow at two phases of T/2 apart, while panels (c,d) show instantaneous vorticity fields for the stabilised base flow at two phases of T/2 apart. The base flows in panels (a,c) are shown at the same phase as figure 15(a,b). The vertical dashed lines mark the two transition locations for the original aperiodic 2-D flow.

The neutral instability curves for mode A and the subharmonic mode. The Floquet analyses for Re ≥ 160 are performed based on the phase-averaged base flow.

To further confirm the existence of the subharmonic instability mode predicted by the Floquet analysis, 3-D DNS were conducted using Lz/h = 1–3 to eliminate the influence of mode A and to reveal the relatively small-scale subharmonic instability mode. The present DNS cases and their 2-D or 3-D near-wake patterns are summarised in figure 18 using isolated symbols. The DNS results agree well with the neutral instability curves. For Re = 260 and 280, the near wake becomes three-dimensional when Lz/h increases from 2.5 to 3, and the wake of Lz/h = 3 is represented by one spanwise period of the mode A structure. For Re = 290, the near wake first becomes three-dimensional when Lz/h increases from 1.4 to 1.5, and the near wake is represented by one spanwise period of the subharmonic mode. The subharmonic mode observed at Lz/h = 1.5 is free from the influence of mode A that may appear at larger Lz/h values. The existence of the subharmonic instability mode is thus cross-checked by both DNS and the Floquet analysis, where both methods predict its onset of instability at Re within 280–290.
The subharmonic mode is also observed at Re = 300 when Lz/h increases from 1.3 to 1.4. The subharmonic mode at Re = 300 and Lz/h = 1.4 is investigated in detail by examining the instantaneous ωz and ωx fields over a period of 20T. Figure 19 illustrates the ωz (a,c,e) and ωx (b,d,f) fields at the plane z/h = 0.1 over a period of 2T. Panels (a,b) of figure 19 are shown at an arbitrary time instant in the fully developed flow, while panels (c,d) and (e,f) are shown at time evolutions of T and 2T, respectively. It is seen that the ωz fields shown in figure 19(a,c,e) are generally T-periodic at  $x/h\mathrm{\ \mathbin{\lower.3ex\hbox{$\buildrel< \over {\smash{\scriptstyle\sim}\vphantom{_x}}$}}\ }7$, which is similar to those of the 2-D flow shown in figure 15(a,b). However, while the |ωx| fields in figure 19(b,d,f) are generally T-periodic at
 $x/h\mathrm{\ \mathbin{\lower.3ex\hbox{$\buildrel< \over {\smash{\scriptstyle\sim}\vphantom{_x}}$}}\ }7$, the streamwise vortices change sign every T, resulting in the period doubling of the flow.
Instantaneous ωz (a,c,e) and ωx (b,d,f) fields at the plane z/h = 0.1 for the 3-D DNS case of Re = 300 and Lz/h = 1.4. Panels (a,b) are shown at an arbitrary time instant in the fully developed flow, while panels (c,d) and (e,f) are shown at time evolutions of T and 2T, respectively.

The physical mechanism for the development of the subharmonic mode is investigated below. It is anticipated that the development of the subharmonic mode is related to the development of the secondary vortex street relatively close to the cylinder. To prove this point, an additional Floquet analysis was conducted by using a base flow without the transition to the secondary vortex street. The transition to the secondary vortex street can be suppressed by stabilising the two-layered vortex street until the outlet boundary (see figure 17c,d) through the following procedures:
(i) Compute the fully developed 2-D flow and the corresponding vortex shedding period T.
(ii) Repeat the following until the two-layered vortex street is stabilised till the outlet: advance the flow by a period of T and use the average of the flow fields at the beginning and the end of the T-period as the initial condition for the next iteration.
(iii) Compute the updated T for the stabilised flow field.
(iv) Repeat steps (ii) and (iii) until the updated T does not change.
It is worth noting that the stabilised base flow is strictly T-periodic, since the aperiodic transition to the secondary vortex street is suppressed.
Based on the stabilised base flow, the |μ|−β relationship for Re = 300 is also shown in figure 16. While the first peak at βh ~ 0.8–1.8 still corresponds to the mode A instability, the second peak, which is marginally unstable at βh = 3.2 with a real and positive μ value (rather than a real and negative μ for the subharmonic mode), corresponds to a wake instability in the two-layered vortex street near the outlet, which would not exist in the original base flow.
The disappearance of the subharmonic mode in the stabilised base flow sheds light on the origin of the subharmonic mode. For the original base flow (and naturally also the phase-averaged base flow), it is found that the time-averaged flow becomes asymmetric about the wake centreline at Re ≥ 285 (e.g. figure 15d). Consistently, the time-averaged lift coefficient becomes non-zero, the trajectories for the positive and negative vortices become asymmetric about the wake centreline (figure 15c) and the corresponding phase-averaged base flow (figure 17a,b) breaks the following spatio-temporal symmetry:
 \begin{equation}{\omega _z}(x,y,t) ={-} {\omega _z}(x, - y,t + T/2).\end{equation}
Physically, subharmonic modes are often detected by the Floquet analysis when the base flow breaks the above spatio-temporal symmetry (Blackburn & Sheard Reference Blackburn and Sheard2010), even when the bluff body and the incoming flow are symmetric about the wake centreline (e.g. Serson et al. Reference Serson, Meneghini, Carmo, Volpe and Gioria2014). Therefore, it is not surprising that the critical Re for the asymmetry of the time-averaged flow coincides with the critical Re for the instability of the subharmonic mode (both at Re = 280–285). In contrast, the stabilised base flow (figure 17c,d) possesses the spatio-temporal symmetry given in (3.5), such that no subharmonic mode is detected by the Floquet analysis. A comparison between the original/phase-averaged base flow and the stabilised base flow suggests that the breaking of the spatio-temporal symmetry described in (3.5) is induced by the transition to the secondary vortex street relatively close to the cylinder, which rearranges the near-wake vortex pattern upstream of the transition.
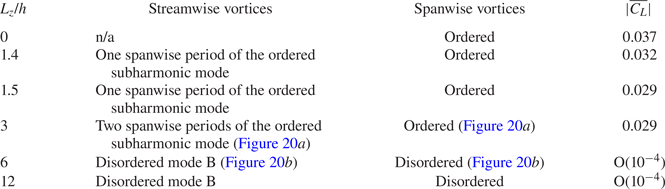
Although the subharmonic mode is detected by the Floquet analysis and 3-D DNS with Lz smaller than the spanwise wavelengths of mode A at  $Re\mathrm{\ \mathbin{\lower.3ex\hbox{$\buildrel> \over {\smash{\scriptstyle\sim}\vphantom{_x}}$}}\ }285$, it may not exist in the natural 3-D flow. Instead, § 3.1 shows that the mode B structures are observed in the natural 3-D flow at Re ≥ 150 and dominate the wake at Re ≥ 220, although none of the Floquet analysis conducted here detects the mode B instability. In addition, table 2 summarises the wake structures for Re = 300 predicted by the 3-D DNS under different Lz/h constraints. A mesh convergence check was performed for the case Lz/h = 12 by increasing Np from 5 to 6, where the St,
 $\overline {{C_D}}$ and
 ${C^{\prime}_L}$ values vary by less than 1%. It is seen in table 2 that with increasing Lz/h from 3 to 6, the wake structure changes from the ordered subharmonic mode (figure 20a) to disordered mode B (figure 20b). The existence of mode B rather than the subharmonic mode for Lz/h = 6 and 12 is supported by the following evidence.
(i) The streamwise vortices possess the spatio-temporal symmetry corresponding to mode B rather than the subharmonic mode.
(ii) The time-averaged lift coefficient is practically zero (of the order of 10−4).
(iii) The mode B structures emerge at Re ≥ 150, which is much smaller than the onset of the subharmonic mode at Re ~ 285.
Instantaneous vorticity fields for Re = 300 predicted by the 3-D DNS using (a) Lz/h = 3 and (b) Lz/h = 6. The translucent iso-surfaces represent spanwise vortices with ωz = ±2, while the opaque iso-surfaces represent streamwise vortices with ωx = ±0.4 for panel (a) and ωx = ±2 for panel (b). Dark grey and light yellow denote positive and negative vorticity values, respectively. The flow is from left to right past the cylinder on the left.

Wake structures for Re = 300 predicted by the 3-D DNS under different Lz/h constraints.

The development of mode B rather than the subharmonic mode in the natural 3-D flow is attributed to the influence of the mode A instability. The mode A streamwise vortices may destabilise mode B through (i) destabilising the braid shear layer region (Jiang et al. Reference Jiang, Cheng, Draper, An and Tong2016) for the hyperbolic instability of mode B (Williamson Reference Williamson1996; Leweke & Williamson Reference Leweke and Williamson1998; Thompson et al. Reference Thompson, Leweke and Williamson2001), and (ii) modulating the pattern of the spanwise vortices (i.e. the base flow) to allow for the instability of mode B. To demonstrate the latter mechanism, the span-averaged spanwise vorticity fields for Re = 300 computed with Lz/h = 3 and 6 are shown in figure 21. For Lz/h = 3, the ordered streamwise vortices of the subharmonic mode do not induce noticeable influence on the spanwise vortices (figure 20a), such that the pattern of the spanwise vortices shown in figure 21(a) is similar to that computed with 2-D DNS (figure 15a,b), where the primary vortex street transitions to the two-layered and secondary vortex streets at x/h ~ 4 and 10, respectively. For Lz/h = 6, the spanwise vortices are highly disordered (figure 20b), such that the spanwise vorticity field shown in figure 21(b) is based on a phase average over 25 vortex shedding cycles. Compared with figure 21(a), the pattern and strength of the spanwise vortices shown in figure 21(b) are significantly modulated by the disordered streamwise vortices (figure 20b) and the associated development of turbulence and turbulent dissipation.
Span-averaged spanwise vorticity fields for Re = 300, obtained from (a) the instantaneous 3-D flow field shown in figure 20(a) computed with Lz/h = 3, and (b) the phase-averaged 3-D flow computed with Lz/h = 6.

It is anticipated that the modulated pattern of the spanwise vortices may give rise to the instability of mode B. Therefore, an additional Floquet analysis is conducted, where the base flow is the phase- and span-averaged spanwise vorticity fields for Re = 300 obtained with Lz/h = 6 (called the modulated base flow hereafter). Figure 22 shows the |μ|−β relationship for Re = 300, predicted through the Floquet analysis using the modulated base flow. The two unstable modes identified in figure 22 both contain real and positive μ values, which correspond to synchronous modes. The streamwise perturbation vorticity fields for the two modes are shown in figure 23(a,b). The perturbation patterns of the two modes agree well with those for modes A and B for circular and square cylinders (see e.g. Robichaux et al. Reference Robichaux, Balachandar and Vanka1999; Carmo, Meneghini & Sherwin Reference Carmo, Meneghini and Sherwin2010). The most unstable spanwise wavelength for mode B (~0.9h) is similar to the wavelengths for mode B for circular and square cylinders (Barkley & Henderson Reference Barkley and Henderson1996; Choi et al. Reference Choi, Jang and Yang2012; Park & Yang Reference Park and Yang2016).
The |μ|−β relationship for Re = 300, predicted through the Floquet analysis using the modulated base flow. The horizontal dashed line marks the neutral instability of |μ| = 1.0.

Streamwise perturbation vorticity fields for Re = 300: (a) mode A predicted by βh = 1.8 of the modulated base flow, (b) mode B predicted by βh = 7 of the modulated base flow, (c) mode A predicted by βh = 1.4 of the phase-averaged base flow and (d) the subharmonic mode predicted by βh = 3.2 of the phase-averaged base flow. Red and blue denote positive and negative vorticity values, respectively.

For completeness, figure 23(c,d) shows the streamwise perturbation vorticity fields for mode A and the subharmonic mode predicted with the phase-averaged base flow illustrated in figure 17(a,b). For mode A, the perturbation structure displays opposite signs for the two sides of the wake centreline (figure 23a,c). For the subharmonic mode, the perturbation structure displays both signs alternately at each side of the wake centreline (figure 23d). The most unstable spanwise wavelength for the subharmonic mode (~1.9h) is similar to the wavelengths for the subharmonic mode observed in the wake of other bluff bodies (e.g. Sheard et al. Reference Sheard, Fitzgerald and Ryan2009; Yildirim, Rindt & van Steenhoven Reference Yildirim, Rindt and van Steenhoven2013).
However, figure 22 shows that the subharmonic mode is suppressed by the modulated pattern of the spanwise vortices shown in figure 21(b). As discussed earlier in this section, the subharmonic mode is unstable to the original and phase-averaged base flows where the spatio-temporal symmetry described in (3.5) is broken by the transition to the secondary vortex street relatively close to the cylinder. For the modulated base flow shown in figure 21(b), the two-layered vortices with significantly weakened vorticity do not transition to the secondary vortex street, and the wake possesses the spatio-temporal symmetry (see e.g. the  $|{\overline {{C_L}} } |$ values in table 2), such that the subharmonic mode is suppressed.
4. Conclusions
This paper investigates numerically the 3-D wake transition process of a diamond cylinder. Detailed 3-D DNS show that the wake becomes three-dimensional at Recr ~ 121 and is represented by mode A with global vortex dislocations for Re = Recr − 150. For Re = 160–210, a mode swapping between modes A and B takes place. With the increase in Re, the mode B structures are increasingly likely destabilised by the streamwise vortices of mode A, and consequently the probability of occurrence of mode A with global vortex dislocations decreases monotonically. For Re ≥ 220, the wake is dominated by increasingly disordered mode B structures.
For the mode swapping regime, the different characteristics of the dislocation and non-dislocation periods are analysed quantitatively through a new approach. Specifically, a specific flow property (e.g.  ${C^{\prime}_L}$,
 $\varepsilon_x$,
 $\varepsilon_y$, St, etc.) can be decomposed into the values corresponding to the dislocation and non-dislocation time periods. Owing to the vortex dislocations, the
 ${C^{\prime}_L}$ and St values for the dislocation periods are smaller than their counterparts for the non-dislocation periods, and consistently the
 $\varepsilon_x$ and
 $\varepsilon_y$ values (i.e. the degree of flow three-dimensionality) show the opposite. Quantitatively, the
 ${C^{\prime}_L}$,
 $\varepsilon_x$,
 $\varepsilon_y$ and St values for the non-dislocation periods are closer to those for the dislocation branch than their 2-D counterparts. Therefore, the overall
 ${C^{\prime}_L}\text{--}Re$,
 $\varepsilon_x\text{--}Re$ and
 $\varepsilon_y\text{--}Re$ curves, which are bounded by the dislocation and non-dislocation branches, display only slight changes in the variation trends when the overall curve detaches the dislocation branch at Re ~ 160 and attaches the non-dislocation branch at Re ~ 210. In addition, the relatively close St values for the dislocation and non-dislocation periods cannot be distinguished as two peaks in the overall frequency spectrum.
In contrast, a similar analysis for the circular cylinder case shows that the non-dislocation branch is much closer to the 2-D curve than the dislocation branch, such that the overall curve displays an obvious peak/trough towards its 2-D counterpart at the upper end of the mode swapping regime, commonly known as a critical condition (Williamson Reference Williamson1996). In addition, the St values for the dislocation and non-dislocation periods are now sufficiently apart to be distinguished as two peaks in the overall frequency spectrum.
In addition to DNS, Floquet stability analyses are conducted to identify the 3-D wake instability modes of a diamond cylinder up to Re = 300. Phase-averaged base flow is adopted to eliminate the quantitative uncertainties induced by the aperiodic secondary vortex street in the base flow. In addition to mode A, a subharmonic instability mode is identified at Re ≥ 285, whereas mode B is not detected. The subharmonic instability mode is induced by the breaking of the Z 2 spatio-temporal symmetry of the base flow, which is further induced by the transition to the secondary vortex street relatively close to the cylinder and rearrangement of the near-wake vortex pattern upstream of the transition.
The disagreement between the natural 3-D flow and the Floquet analysis regarding the existence of mode B and the subharmonic mode is explained. For the natural 3-D flow, the existence of mode A modulates the pattern of the spanwise vortices (i.e. the base flow), which gives rise to the instability of mode B. In addition, the base flow modulated by the existence of modes A and B does not transition to the secondary vortex street, which suppresses the subharmonic mode. In summary, the natural 3-D flow involves complex interactions between the streamwise and spanwise vortices, as well as between the 3-D wake transition and the 2-D base-flow transition.
Funding
The author would like to acknowledge the support from the Australian Research Council through the DECRA scheme (Grant No. DE190100870). This work was supported by resources provided by the Pawsey Supercomputing Centre with funding from the Australian Government and the Government of Western Australia.
Declaration of interests
The author reports no conflict of interest.