




No CrossRef data available.
Perception of transient nonspeech stimuli is normal in specific language impairment: Evidence from glide discrimination
Published online by Cambridge University Press: 03 May 2005
Abstract
Twenty 9- to 12-year-olds with specific language impairment (SLI) were compared with 18 age-matched controls on auditory discrimination tasks, using a three-interval, two-alternative forced-choice format. The first task used minimal word pairs in silence and in noise. Nonspeech tasks involved discriminating direction of frequency glides and had two versions: (a) the glide moved from 500 to 1500 Hz, and duration was adaptively decreased; (b) all glides lasted 250 ms, and the frequency range was adaptively modified until a threshold was reached. Control and SLI groups did not differ on the glide tasks. Around half the children in both groups accurately discriminated 20 ms glides. There was a small but significant group difference on the speech-in-noise task, and scores were weakly related to literacy level. Perception of brief, transient, nonspeech stimuli is not abnormal in the majority of school-aged children with SLI.
Information
- Type
- Articles
- Information
- Copyright
- © 2005 Cambridge University Press
When a child has difficulty understanding spoken language, an obvious question is whether the problem is related to poor auditory perception. Many children with comprehension problems do not have any peripheral hearing loss, and can pass a hearing test that involves detecting sounds at low intensity. Nevertheless, this does not necessarily mean that auditory function is normal; the possibility remains that there is a problem in distinguishing salient properties of sounds. Tallal and Piercy (1973a) proposed that low-level auditory perceptual problems are implicated in causing specific language impairment (SLI), that is, developmental language difficulties that cannot be accounted for in terms of general developmental delay, peripheral hearing loss, autistic disorder, or physical handicap.
Tallal and Piercy (1973a) used a task known as the Auditory Repetition Test (ART), in which they presented children with two-tone sequences separated by variable interstimulus intervals (ISIs). Children were first trained to associate a complex tone with a high fundamental frequency (305 Hz) with one button press and a complex tone with a low fundamental frequency (100 Hz) with another button press. For the two-tone sequences, the task was to press the buttons corresponding to the sequence of tones that was presented (high–high, high–low, low–high, or low–low). Children with SLI performed close to ceiling levels when tones were separated by 305 ms or more, but their performance deteriorated at shorter ISIs. In contrast, control children maintained good levels of performance down to ISIs of 8 ms. Tallal and Piercy (1973b) went on to show that performance on this task by children with SLI was much worse with brief tones (75 ms) than with longer tones (125–250 ms). Such results led to development of the auditory temporal processing theory, which attributes SLI to a problem in discriminating auditory signals that are brief or rapid. Brevity of stimuli alone is not sufficient to create problems: Tallal and Stark (1981) showed that children with SLI had no difficulties in discriminating between two steady-state 40-ms vowels with different formant structures. However, if the same stimuli were followed immediately by another vowel, creating a diphthong, then these children did much worse. This led Tallal and Stark to suggest that brief stimuli lead to problems if they are followed in rapid succession by other acoustic cues. Tallal (2000) argued that poor auditory temporal resolution made it difficult to form fine-grained phonological representations, so children rely instead on coarse, syllable-based representations. This would lead to difficulties in language comprehension and problems in developing a phonic reading strategy.
Tallal's auditory temporal processing theory has been influential: at the time of this writing, the original 1973 Tallal and Piercy paper in Nature had over 200 citations in the Science Citation Index over the past 20 years. Clark, Rosen, Tallal, and Fitch (2000) argued that the accumulated research findings “overwhelmingly support the view that individuals with developmental language disabilities have a fundamental dysfunction in the ability to process brief auditory stimuli followed in rapid succession by other acoustic information (i.e. rapid auditory processing)” p. 829. Troia and Whitney (2003) noted that a computerized intervention package based on the theory, FastForWord®, has been administered to over 65,000 children in the United States. Nevertheless, recent years have seen a number of challenges to the auditory temporal resolution theory.
WHAT DOES THE ART MEASURE?
A number of researchers have questioned whether the results obtained with the ART are indicative of poor auditory temporal processing. In the ART, the child must learn to associate each of two frequencies with a specific keypress and remember this association over a lengthy set of trials that are typically given without feedback. Furthermore, the order of a sequence of tones must be reproduced. It has been argued that performance on this task may be affected by multiple factors other than auditory temporal resolution, including frequency discrimination, associative memory for tone–button pairings, short-term memory for tone sequences, perceptual learning, skill in classifying perceptually similar stimuli, and ability to make strategic use of verbal labels for the stimuli (Heath, Hogben, & Clark, 1999; Marshall, Snowling, & Bailey, 2001; McArthur & Bishop, 2001, 2004b; McArthur & Hogben, 2001; Nittrouer, 1999; Tomblin & Quinn, 1983). One might argue that the influence of such factors would predict deficits at long as well as short ISIs, but the original task used by Tallal and Piercy (1973a) gave ceiling effects at long ISIs. Indeed, a number of recent studies found no evidence of a selective deficit at short ISIs in children with SLI or reading deficits, provided ceiling effects were avoided (Bishop et al., 1999; Breier, Gray, Fletcher, Foorman, & Klaas, 2002; Bretherton & Holmes, 2003; Lincoln, Dickstein, Courchesne, Elmasian, & Tallal, 1992; Nittrouer, 1999; Norrelgen, Lacerda, & Forssberg, 2002; Share, Jorm, Maclean, & Matthews, 2002; Van der Lely, Rosen, & Adlard, 2004; Waber et al., 2001). One way of reducing the labeling and sequencing demands inherent in the ART is by asking children to judge whether two tones are the same or different, rather than reproduce the sequence. Tallal and Piercy (1973a) found that deficits were still apparent in children with SLI when this method was used, and some other studies also found deficits on the ART (although with long as well as short ISIs) using a same–different format in children with reading disability (Goswami et al., 2002) or SLI (Van der Lely et al., 2004). However, other studies of reading-disabled children found deficits only when the original “repetition” version of the test was used (Farmer & Klein, 1993; Heiervang, Stevenson, & Hugdahl, 2002).
THE RELATIONSHIP BETWEEN ART PERFORMANCE AND PHONOLOGICAL PROCESSING
In a review of the area, Rosen (2003) noted that evidence was particularly weak for a causal link between low-level auditory perceptual problems on the one hand, and impairments of speech perception and phonological processing of written language on the other. Tallal (1980) reported a very high correlation between errors in a nonword reading test and ART performance, but this has not been replicated (Breier et al., 2002; Bretherton & Holmes, 2003; Heath et al., 1999; Nittrouer, 1999; Norrelgen et al., 2002; Share et al., 2002; Van der Lely et al., 2004). Witton and colleagues (Talcott et al., 1999, 2000; Witton et al., 1998) found positive associations between children's ability to detect slow (2 Hz) frequency modulation and their phonological reading skills, and this has been interpreted as supportive of Tallal's theoretical position. However, the rates of modulation used in this task are far slower than occur within consonants, and the task could be failed because of poor frequency resolution rather than poor temporal processing. Furthermore, Bishop, Carlyon, Deeks, and Bishop (1999) failed to replicate this association in children with SLI. Hulslander et al. (2004) did find positive associations between tests of frequency modulation detection and literacy skills but showed that these could be accounted for in terms of effects of IQ or attention.
One possible reason for variable findings in previous studies is that the participants have ranged from children with SLI (Bishop, Bishop et al., 1999; Bishop, Carlyon et al., 1999; Norrelgen et al., 2002; Van der Lely et al., 2004), those with clinically diagnosed reading disability (Goswami et al., 2002), poor readers without SLI (Breier et al., 2002; Stark & Tallal, 1988), children referred for evaluation of learning disabilities (Waber et al., 2001), children with reading impairments identified from mainstream classrooms (Heiervang et al., 2002), to unselected samples (Nittrouer, 1999; Share et al., 2002). Tallal (1980) argued that the auditory temporal processing theory could account for phonological deficits in children with reading disability, but in her own work (Stark & Tallal, 1988) and that of Heath et al. (1999), auditory temporal deficits were not seen in children with reading disability if oral language was unimpaired. Even among those with SLI, it is clear that the auditory temporal deficits are found only in a subset of cases (Neville, Coffey, Holcomb, & Tallal, 1993; Tallal, Townsend, Curtiss, & Wulfeck, 1991). In the current study, we focused on the core group of children for whom the auditory temporal processing hypothesis was first postulated: those with severe and unexplained receptive language impairments.
A DIFFERENT APPROACH TO THE ASSESSMENT OF AUDITORY TEMPORAL PROCESSING
We assessed auditory temporal processing in children with SLI using a novel approach that avoided some of the limitations of the ART. We used a psychoacoustic task that differed from the ART both in terms of the auditory discrimination that was made and in terms of the task demands.
Discrimination of glide direction
The stimuli were frequency glides, that is, tones that changed in frequency in either an upward or downward direction. Changes in stimulus frequency are a salient characteristic of many communicative sounds, in nonhuman species as well as in human speech, and single units in auditory cortex respond preferentially to glides with specific temporal and spectral characteristics (Whitfield & Evans, 1965). In humans, neuroimaging evidence suggests that the left hemisphere is preferentially specialized for processing rapid frequency transitions (Fiez et al., 1995; Joanisse & Gati, 2003; Johnsrude, Zatorre, Milner, & Evans, 1997; but cf. Müller, Kleinhans, & Courchesne, 2001). It has been proposed that the evolution of language mechanisms in humans depended on such specialization (Poeppel, 2003) and that discrimination of rapid acoustic changes in nonverbal sounds may implicate the same specialized left-hemisphere mechanisms as are involved in speech discrimination (Belin, Zilbovicius, Crozier, Thivard, & Fontaine, 1998). Glides are thus of particular relevance to the auditory temporal processing theory, and the FastForWord® intervention includes training of frequency glide discrimination in its suite of programs.
In our task, children were required to discriminate between upward and downward glides that were identical except for being reversed in time. The same glide discrimination task can be modified adaptively to test temporal resolution (by varying the duration of the glide) or frequency resolution (by varying the extent of the glide, i.e., the difference between start and end frequencies). By making the stimuli progressively shorter, we eventually reach a point where listeners find it impossible to identify the temporal order of events within a sound. This would mean that, though it might be possible to identify the spectral content of a sound, it would not be possible to tell if the glide moved up or down. If auditory temporal resolution is poor, then breakdown in ability to detect glide direction should occur at a relatively long stimulus duration.
It is less clear whether Tallal's theory would predict any problems in discriminating glide direction for a long stimulus with a limited frequency excursion. Early studies with speech stimuli found that children with SLI had problems discriminating synthetic stop consonants when the formant transitions were relatively brief (43 ms), but could do the task well when the transitions were lengthened to 95 ms (e.g., Tallal, Stark, & Curtiss, 1976), suggesting that transient frequencies can be processed if there is sufficient time. However, there is mounting evidence that at least some children with SLI have difficulties processing spectral information (e.g., Tallal & Stark, 1981; Wright et al., 1997; McArthur & Bishop, 2004a, b), and, as noted, problems in detecting slow rates of frequency modulation has been associated with poor reading ability in some studies (Talcott et al., 1999, 2000; Witton et al., 1998). Thus it is possible that discrimination of glide direction in long stimuli will also create problems for children with SLI if small frequency excursions are used.
The AXB paradigm
In terms of performance demands, we adopted a procedure that minimized the labeling, memory and response planning demands inherent in the ART. Glides were presented in a three-interval two-alternative forced choice task. We used an AXB paradigm, in which the listener is presented with three intervals and has to determine whether the first or third interval is the same as the second in glide direction. There is no need to label the stimuli or remember associations between stimuli and response buttons, and the task can be done by listening for, and rejecting, the “odd man out.” In the AXB task, only adjacent intervals need be compared, and indeed it is possible to arrive at the correct response on the basis of hearing just the first two intervals (which will be either same or different). The third interval provides confirmatory evidence. By embedding such methods in a gamelike format and providing feedback to maintain children's attention, it is possible to obtain a stable estimate of threshold. We found that three-interval methods yield lower and less variable threshold estimates in children than two-interval methods when testing other kinds of auditory discrimination (Bishop, Carlyon et al., 1999; Sutcliffe, 2003).
We used the same AXB format to test children's ability to discriminate words differing by a single speech sound, varying task difficulty by presenting half the items in noise. Tallal's hypothesis maintains that an auditory temporal resolution deficit leads to poor language and literacy skills via its effect on speech processing, and thus predicts an association between deficits on nonspeech auditory temporal tasks and speech discrimination tasks.
AIMS OF THE CURRENT STUDY
Our study addressed the following questions:
- Are children with receptive SLI impaired on a test of speech perception, and if so, does this impairment predict the level of language and literacy deficit?
- Are impairments in speech perception associated with poor ability to discriminate glide direction? The prediction from the auditory temporal processing theory is that this association should be evident particularly for brief glides. However, if SLI is associated with poor frequency discrimination (Heath et al., 1999; McArthur & Bishop, 2004a, 2004b), we might expect to see impairment in the ability to discriminate glides with a small frequency range.
METHODS
Participants
Twenty children (14 boys, 6 girls) with SLI (ages = 9.5–12.5 years) were recruited from specialist educational placements for children with communication problems, including six special schools and three special classes within mainstream schools. Children with known sensorineural hearing loss or other handicapping conditions were excluded from consideration. Potential participants for whom parental consent was given were screened for nonverbal ability, and only those scoring within 1 SD of the normative mean are included in this report. To be included the child had to score at least 1 SD below the normative mean on at least two of four measures of language and reading, including at least one measure of receptive language (see below for details of assessments).
A typically developing control group of children of the same age range (7 boys, 11 girls) was recruited from a mainstream school. Any child who scored more than 1 SD below the normative mean on a measure of nonverbal ability, or on two or more of the language and reading tests, was excluded from this group, to ensure the groups were comparable on nonverbal ability, but clearly distinguished on language skills.
All children were given an audiometric screening to ensure they could hear pure tones at 500, 1000, 2000, and 4000 Hz in the better ear at 25 dB HL. Two control children failed screening by a narrow margin in one ear only, but they were retained in the sample as there is no evidence that this level of monaural loss affects discrimination of auditory stimuli presented well above detection threshold.
Standardized tests
Nonverbal ability was assessed using the Matrices Reasoning subtest of the Wechsler Abbreviated Scale of Intelligence (Wechsler, 1999). The t-scores from the norms were converted to scaled scores with a mean of 100 and SD of 15.
Oral language ability was assessed using the Test for Reception of Grammar—2 (TROG-2; Bishop, 2003) and the Expression, Reception, and Recall of Narrative Instrument (ERRNI; Bishop, 2004). The TROG-2 is an 80-item multiple-choice comprehension test in which the child must select from an array of 4 pictures the one that matches a spoken sentence. Sentences increase in grammatical complexity as the test proceeds. For the ERRNI, the child is shown a narrative in a series of 15 pictures on five pages. After inspecting the story, the child reviews the pictures and tells the story in his/her own words. After a delay of around 20 min, the child is asked to recall the story from memory without warning. Finally, the pictures are viewed again and the child is asked questions about the story, some of which involve making inferences about causes or emotions. The ERRNI yields scores reflecting mean length of utterance (MLU), semantic content of the story (“ideas scores”), initial telling and recall, and story comprehension. Both tests have been standardized on a nationally representative sample of over 800 children (ages = 4–16 years) in the United Kingdom. The TROG-2 and ERRNI comprehension scores were averaged to give a receptive language composite scaled score, and the ERRNI ideas scores and MLU were averaged to give an expressive language composite scaled score.
Literacy skills were assessed using the Test of Word Reading Efficiency (TOWRE; Torgesen, Wagner, & Rashotte, 1999) and the Spelling subtest from the Wechsler Objective Reading Dimensions (Rust, Golombok, & Trickey, 1993). For the TOWRE, the child is presented with a card showing a list of words or nonwords (in separate tests) and is required to read aloud as many as possible in 45 s. On the Spelling subtest, the child writes up to 50 items to dictation, starting with single letters and progressing to longer words. Testing is discontinued when six consecutive items are failed. Scores on both literacy tests were transformed to age-scaled scores with a mean of 100 and SD of 15 using test norms, and the three scaled scores were averaged to give a literacy composite.
Auditory discrimination tasks
Stimuli
For the speech discrimination task, all stimuli were words, originally recorded in an anechoic chamber using a DAT recorder, from a female speaker of Southern British English. Six word pairs were chosen because they were the most easily confused by a group of dyslexic children studied by Adlard and Hazan (1998). In each case at least one of the words contained a consonant cluster and the other word was obtained either by deleting the second consonant in the cluster or substituting for it with another consonant, forming a minimal pair. The pairs were: blow/bow; fog/frog; scar/star; skip/slip; smack/snack; spill/still. Two tokens of each word were recorded: thus, for instance, two versions of “fog” were recorded; the appropriate response to these would be “same,” but they were not acoustically identical. An easily discriminable pair, boat/coat, was used for four practice trials (with and without noise) at the start of the test session. One further easy pair, cat/mat, was presented intermingled with the main test items, and was used to act as a kind of “catch trial,” to detect cases where we might suspect a lack of attention to, or understanding of, the task (see Procedure for more details of the task).
In order to exclude the possibility of duration cues (especially with noise added), both words making up a pair (e.g., smack/snack) were made the same absolute duration by appending silence to the shorter ones. All items, with and without noise, were set to the same root mean square amplitude. Continuous speech-spectrum noise was added to each token at a signal/noise ratio of −2.5 dB. The spectrum of this noise was an approximation to the long-term average speech spectrum of male and female voices as measured by Byrne et al. (1994). A three-line approximation was judged adequate for capturing the major part of the shape from about 60 Hz to 9 kHz. This consisted of a low-frequency portion rolling off below 120 Hz at 17.5 dB/octave, and a high-frequency portion rolling off at 7.2 dB/octave above 420 Hz, with a constant spectrum portion in between.
Version A of the nonspeech discrimination task was designed to provide an estimate of temporal resolution. Stimuli were linear glides, all with a center frequency of 1000 Hz, with frequency range from start to end of glide up to 1000 Hz, created using Tucker–Davies Technology System II software. Stimuli were created with sampling rate of 48 kHz, using rise and fall times of 10 ms. An ensemble of glides was created, ranging in duration from 20 to 500 ms in 2-ms steps. Version B stressed spectral rather than temporal resolution: all glides were 250-ms duration, and task difficulty was increased by adaptively varying the difference between starting and finishing frequency of the glide. An ensemble of glides was created with frequency change ranging from 1000 Hz (500–1500 Hz) for the easiest discrimination down to 4 Hz (998–1002 Hz) for the hardest, in 2-Hz steps.
Procedure
Children were tested in a quiet room at their school. Stimuli were presented on a laptop computer, using Sennheiser HD25 headphones. The intensity was adjusted during practice trials to a level that the child found comfortable and clearly audible. All three discrimination tasks (one speech task and two nonspeech tasks) adopted the same AXB format. Three animals (owls in the speech task and dinosaurs in the nonspeech tasks) were shown on the screen. On each trial, three intervals were presented, separated by 500 ms. For each interval, the animal jumped as a sound was presented. The animal corresponding to the middle interval (X) was located in the middle of the screen above the other two animals, and the examiner explained that the task was to work out which of the two other animals (left or right) made the same sound as the central animal. The child selected the left- or right-hand animal by pointing to it. Demonstration was given to ensure the child understood what was required, and testing proceeded only when the child had performed correctly on at least four consecutive trials at the easiest level. The task was self-paced, with the examiner initiating each trial when the child was ready to attend. A correct response resulted in an item being added to stack of icons on the left of the screen; an incorrect response led to a “sigh” noise and no additional icon. If the child was reluctant to make a judgment, the item was repeated.
For the speech discrimination task, each pair of words was presented four times: twice with the first member as the target, twice with the second member as target, twice with no noise, twice with noise. Thus, there was a fixed number of trials: 4 practice trials with easy items, followed by 14 test trials with noise and 14 without noise, randomly intermixed. The score was the total number of items correct.
For both versions of the glide discrimination task, the child had to judge which of two glides differed in direction from a standard glide. Difficulty level was adaptively varied according to the child's level of accuracy, using a more virulent PEST procedure (Findlay, 1978). This involves presenting very easy discriminations initially, and using large step sizes to increase difficulty level until an error is made. When an error is made, the discrimination is made easier (i.e., a reversal in difficulty level occurs). Step size is progressively reduced, until a threshold level is reached at which the child achieves 75% correct. The smallest step size was 2 ms for Version A, and 2 Hz for Version B. Testing continued until 8 reversals had occurred or 60 trials had been presented. Threshold was computed as the average presentation level after the fourth reversal.
The order of presentation of Version A and Version B of the glide discrimination task was counterbalanced across children. The speech discrimination test was given after the glide tasks in a separate session.
RESULTS
Characteristics of the two groups are shown in Table 1. Although both groups scored close to the normative mean, the SLI group had significantly lower scores on the nonverbal ability test, F (1, 36) = 6.14, p = .02; effect size, η2 = .146. Nonverbal ability therefore needs to be taken into account when considering group differences on other measures. As anticipated, the control and SLI groups differed substantially on the language and literacy tests that were used as a basis for selecting the SLI group.

Speech discrimination
One child with SLI made an error on one of the four easy catch trials. His data were excluded from analysis. The distributions of scores on the speech discrimination test were skewed and are shown as back-to-back stem and leaf plots in Table 2, separately for the noise and no-noise conditions. When no noise was present, most children in both groups scored at ceiling, and there was no difference in the means on nonparametric test, Mann–Whitney z = .70, p (one tailed) = .243. When noise was present, the SLI group scored significantly lower than the control group, Mann–Whitney z = 1.82, p (one tailed) = .035. It would be unwise to interpret this result as indicating that children with SLI have a specific problem with speech in noise, given the ceiling effect in the no-noise condition. Rather, one might say that their speech discrimination is relatively weak, and this weakness is revealed by making the task more taxing by adding noise. Nevertheless, it is noteworthy that although reliable, the group difference is small, and there is overlap between the groups. The group difference did not appear to be attributable to nonverbal ability differences between groups, as the correlation between nonverbal ability and the speech-in-noise test was nonsignificant (Spearman ρ = .17, N = 38, p = .302).

Glide discrimination version A: Variable duration
All children in both groups understood the task well enough to perform significantly above chance level, with the more virulent PEST procedure converging on a threshold in between 25 and 59 trials. A preliminary analysis was conducted to test whether the order of presentation of the two glide discrimination tasks affected performance, and confirmed that it did not. Around half the children in each group could discriminate glide direction at the shortest duration used, 20 ms. For these cases, a threshold was not established: mean percentage trials correct was 95% for the controls and 96% for the SLI group. In the analyses, these children were treated as having a threshold at floor (i.e., 20 ms); for the remainder of the sample, the threshold was the briefest duration at which glide direction could be discriminated with 75% accuracy. Of the controls with thresholds over 20 ms, all but one obtained a threshold value between 21 and 100 ms. Four of the children with SLI needed a duration of over 170 ms to discriminate glide direction reliably. The distribution of scores was highly nonnormal, as shown in the back-to-back stem and leaf plots in Table 3. On a nonparametric one-tailed Mann–Whitney test, the distributions of thresholds for the two groups did not differ significantly (z = .43, p = .334).

Glide discrimination version B: Variable frequency change
When the frequency change of the glide was varied adaptively, two of the children in the SLI group performed at chance level and so a threshold could not be estimated. Both of these children scored well within normal limits on Version A of the task. For the remainder of the sample, the threshold was estimated as the frequency change, in Hz, at which glide direction could be discriminated with 75% accuracy. The distributions of thresholds are shown in Table 3. Thresholds ranged from less than 10 Hz to over 300 Hz. The distributions for the control and SLI groups were not significantly different, Mann–Whitney z = 0.16, p = .402 (one-tailed).
Characteristics of children with high thresholds on Version A of glide discrimination
Heterogeneity of participants, with highly skewed distributions of thresholds, is the rule rather than the exception in studies of auditory discrimination in SLI (McArthur & Bishop, 2001). In a small study, it is possible that statistics based on group averages will be misleading if only a subset of children is impaired. Accordingly, the SLI group was subdivided into three subgroups according to performance on Version A of the glide discrimination task. The SLI-a group (N = 11) contained children who distinguished glides reliably at the shortest duration, 20 ms. The SLI-b group (N = 5) had thresholds between 21 and 100 ms, and the SLI-c group (N = 4) had thresholds of 170 ms or above. Given the tiny sample sizes, this analysis must be regarded as exploratory, but it allowed us to check whether there was a distinctive profile associated with poor auditory temporal resolution. Relevant data are shown in Table 4. Groups did not differ significantly on age or on the language or literacy composites. Nevertheless, on the three literacy tests, all four children in the SLI-c group scored close to the test floor (scaled scores≤75 on all three tests), compared with none of the SLI-b, and four of the 11 SLI-a cases. Although only a minority of children with SLI have poor auditory temporal resolution, those that do seem at risk of severe literacy problems, but it is also the case that other children with equally severe literacy difficulties perform well on brief glide discrimination.

Characteristics of children with high thresholds on Version B of glide discrimination
McArthur and Bishop (2004a, 2004b) found that a subset of children with SLI had poor frequency discrimination, and that these children tended to do poorly on tests of phonological awareness and nonword reading. The glide discrimination task used here was different in nature from the task used by McArthur and Bishop, which involved pure tones, but nevertheless, both tasks would be expected to tax frequency resolution. Therefore, even though task B did not discriminate between SLI and control groups, it seemed worth doing an analogous analysis to see whether those who did poorly on this task had a different pattern of impairment from the rest of the group. On the basis of scrutiny of Table 3, a cutoff was placed at 70 Hz, and the five children with SLI who obtained thresholds above this level were contrasted with the remainder of the SLI sample. There was no hint of any differences between these subgroups on any of the measures in Table 4 (all F ratios <1).
Characteristics of children with poor speech discrimination
An analogous subdivision of the SLI group was made in terms of total speech discrimination score. Only one child with SLI scored outside the control range, so it was decided to make a simple binary split between those who scored 25 or more (N = 12), and those who scored 23 or less (N = 7; corresponding to 16th centile for the controls). There were no significant differences between these subgroups for any of the variables listed in Table 4. The largest effect size was again seen for the literacy composite, F (1, 17) = 1.48, p = .24, η2 = .080. However, unlike the findings with the glide discrimination A, those with poor speech discrimination had a wide spread of literacy scores (mean = 68.4, SD = 10.7, range = 53–84, cf. good discrimination subgroup: mean = 75.8, SD = 13.6, range = 55–105).
Correlations between discrimination measures
Scores for noise and no-noise speech discrimination scores were summed prior to computing Spearman correlations. As shown in Table 5, there were modest correlations between the frequency discrimination (version B) threshold and the other two measures, which reached significance when the whole sample was considered. However, the association between the duration discrimination (version A) threshold and speech discrimination, which was predicted by the auditory temporal processing hypothesis, did not reach significance.

Relationship between speech discrimination and language scores
Spearman correlations between the speech discrimination total score and the receptive language composite were nonsignificant, both for the whole sample, ρ = .29, N = 38, p = .082, and within the control group, ρ = .11, N = 18, p = .671, and within the SLI group, ρ = .08, N = 20, p = .738.
Relationship between speech discrimination and literacy scores
The three literacy measures were strongly intercorrelated, with pairwise Pearson correlations of greater than .8, so analyses were conducted on the literacy composite. The relationship between this composite and the speech discrimination score is shown for both control and SLI groups in Figure 1. The Spearman correlation between these measures was significant when both groups were combined, ρ = .34, N = 37, p = .041. The correlation was of similar magnitude but not significant when the SLI group was considered alone, ρ = .35, N = 19, p = .146, and was lower within the control group, ρ = .102, N = 18, p = .688.

A scatterplot depicting literacy scores in relation to speech discrimination total score, with SLI children subdivided according to performance on Version A of glide discrimination. Group SLI-a could discriminate glides of 20-ms duration; Group SLI-b had a threshold between 21 and 100 ms; and group SLI-c had thresholds of 170 ms or more, outside the control range
DISCUSSION
In this study we considered two main questions: is receptive SLI associated with poor speech discrimination and is speech discrimination related to ability to discriminate glide direction in nonverbal auditory stimuli? The answer to the first question was a qualified yes: there were statistically significant differences between SLI and control groups on a task that involved discriminating minimal pairs of words in the presence of noise. The difference was small in magnitude and there was overlap between scores of control and SLI groups, but nevertheless performance on this task was modestly correlated with literacy level when SLI and control groups were considered together. It is possible that the small effect size we obtained was a consequence of the specific task we used. Previous studies suggest we might have found stronger group differences had we used synthetic speech tokens (cf. Evans, Viele, Kass, & Tang, 2002; Stark & Heinz, 1996). Another possibility is that a categorical perception task, which has often revealed deficits in studies of reading-disabled children (see Manis et al., 1997, for review), might have been more sensitive.
The answer to the second question was negative. In the nonverbal auditory tasks, the child had to discriminate which of two glides differed from a comparison glide in direction of the frequency sweep. All stimuli contained the same spectral information, so to differentiate them it was necessary to consider how the spectral composition changed over time. Overall, the performance of the control and SLI groups did not differ on either Version A (where glides became progressively briefer as the test proceeded) or Version B (where the frequency range of the glide reduced as the test proceeded). Indeed, around half of the children with SLI and half the control children performed on Version A at a high level of accuracy with glide durations as brief as 20 ms. Contrary to prediction, Version A of the task showed no relation to speech discrimination skills. These findings are reminiscent of the results of Norrelgen et al. (2002), who found no deficit in SLI on a version of the ART using tone stimuli, though they did find impairment on a test of speech perception.
What are the theoretical implications of these results? Overall, the data are consistent with the position put forward by Studdert–Kennedy and Mody (1995). Although their arguments were developed to account for reading disability they could apply equally to SLI. They maintained that the key deficit in children with literacy problems was linguistic, affecting perception of speech segments, and that any associated nonverbal auditory deficits were incidental findings, not causally related to the speech difficulties. They argued that deficits in speech-based tasks are more reliable correlates of language and literacy problems than deficits in nonspeech auditory discrimination. Our data lend some support to this view, by showing not only do children with SLI perform more poorly than controls on a test of discriminating speech in noise but also performance on this test is modestly correlated with literacy level. We must be careful not to exaggerate the size of this effect, which accounts for around 12% of variance in literacy skills. Furthermore, we note that the direction of causation could be from poor literacy to poor speech perception, rather than the other way around (e.g., if reading led to weak vocabulary, making it harder to perceive words in the speech discrimination test). Note also that the fact that the speech discrimination task did not predict receptive language level is inconsistent with any theory that predicts speech perceptual difficulties are the root cause of receptive SLI.
The principal issue we have to address is our failure to find deficits in nonverbal auditory processing in SLI, which is discrepant with much of the literature in this field. It is clear that many studies find an excess of cases who do poorly on nonspeech auditory tasks when children with SLI are compared with controls, even though they also find children with SLI who do not have such deficits (e.g., McArthur & Hogben, 2001; Tallal et al., 1991; Van der Lely et al., 2004). In the current study, although overall group comparisons were nonsignificant, four children with SLI had thresholds for discriminating brief glides outside the normal range. Our initial sample size was relatively small and we had low power when comparing subsets of children with good and poor auditory temporal resolution, but there was a hint in the data that poor performance on Version A of the glide discrimination task might be associated with very poor literacy skills (although severe literacy problems were also seen in other children with good glide discrimination). McArthur and Bishop (2004a, 2004b) found an analogous result using a test of frequency discrimination: a subset of cases of SLI were impaired on this task, and they did especially poorly on phonological aspects of reading. One possibility is that the SLI population contains a distinct subgroup whose difficulties are due to low-level auditory perceptual deficits (either spectral or temporal), which affect language development by compromising phonological development. However, contrary this explanation is the lack of any association between Version B of the glide discrimination task and language or literacy skills within the SLI group, given that this task taxes frequency discrimination skills, albeit in a different format. Furthermore, previous studies have failed to find relationships between nonverbal auditory discrimination deficits and poor speech discrimination or oral measures of phonological processing (Bishop, Bishop et al., 1999; Bishop, Carlyon et al., 1999; Van der Lely et al., 2004).
A more prosaic explanation for the excess of nonverbal auditory deficits in SLI is that this is an artifactual result that reflects the difficulty that some children have with the task. No psychoacoustic procedure can be completely free of such influences, though we would argue that the three-interval AXB method that we adopted here reduces the influence of nonauditory factors on performance. If we were relying solely on data from psychoacoustic tasks, we might be tempted to conclude that nonsensory problems with memory, attention, and motivation were the whole explanation for auditory deficits associated with SLI. However, such an account could not explain why some studies find deficits in perceptual processing using brain event-related potentials (ERPs), which do not require the child to attend to, or give a behavioral response to, auditory stimuli (see Leppänen & Lyytinen, 1997, for a review, and Bishop & McArthur, 2004; McArthur & Bishop, 2004a, 2004b, for more recent evidence). The evidence from ERPs is no more consistent than that seen in behavioral studies, and nontemporal as well as temporal auditory deficits have been reported. Nevertheless, the ERP literature suggests that abnormalities of auditory function can be found in some cases of SLI even when there are no direct task demands.
We are confronted, then, by a conundrum. Auditory deficits in SLI are not confined to temporal tasks, are found in only a subset of cases, and are generally unrelated to speech discrimination or phonological processing. However, they cannot simply be dismissed as artefacts. Future research on this topic needs to consider three possible explanations for this pattern of results. One possibility is that auditory deficits (either temporal or spectral) may be implicated in early childhood, but then resolve to leave a long-lasting residue of linguistic deficit. To test this idea we need further longitudinal studies, such as that by Benasich and Tallal (2002), who showed that auditory temporal resolution in infancy predicts language outcome at age 3 years, suggestive of a causal link. A second possibility is that low-level nonverbal perceptual deficits may be implicated, but that the tests that have been used to date are not well designed to identify these. In the context of reading disability, Goswami (2003), for instance, argued that too much research has focused on the segmental level (phoneme identification and discrimination) and that problems in phonological awareness are more likely to reflect the impact of poor ability to encode suprasegmental cues that are important for segmenting syllables into onsets and rhymes. A third type of explanation was put forward by McArthur and Bishop (2004a; see also Bishop & McArthur, 2004, in press), who suggested that poor auditory processing may be a “marker” for underlying brain immaturity in SLI. According to this view, both auditory immaturity and language impairment arise because of neurodevelopmental delay, but the former does not cause the latter. If this is the case, the pattern of impairment on psychoacoustic tests and auditory ERPs will depend on the age of the child and the developmental trajectory of the task in question. The theory predicts that, on tasks where SLI is associated with auditory deficit, the pattern of performance in SLI should resemble that of younger typically developing children. It is noteworthy that this pattern was found on a version of the ART by Van der Lely et al. (2004). If the maturational account is correct, auditory temporal processing does not have any special role in the etiology of SLI: it simply is one indicator of underlying auditory immaturity.
ACKNOWLEDGMENTS
We thank Annukka Lehtonen and Lucy Cragg for help with data collection, and the staff and pupils of the following schools for their generous assistance with this study: Dawn House School, Alderwasley Hall, Gap House School, The Link Primary School, Meath School, Aston Clinton Combined School, Moor House School, Rose Hill First School, Penhill Primary School, and Westfield Community Primary School. Dawn House School and Meath School are ICAN schools. ICAN is the national educational charity for children with speech and language impairments. This work was supported by a Programme Grant from the Wellcome Trust.
References
Adlard A., &
Hazan V.
1998.
Speech perception in children with specific reading difficulties (dyslexia).
Quarterly Journal of Experimental Psychology,
51A,
153–
177.Google Scholar
Belin P.,
Zilbovicius M.,
Crozier S.,
Thivard L., &
Fontaine A.
1998.
Lateralization of speech and auditory temporal processing.
Journal of Cognitive Neuroscience,
10,
536–
540.Google Scholar
Benasich A. A., &
Tallal P.
2002.
Infant discrimination of rapid auditory cues predicts later language impairment.
Behavioural Brain Research,
136,
31–
49.Google Scholar
Bishop D. V. M.
2003.
The Test for Reception of Grammar, version 2 (TROG-2).
London:
Psychological Corporation.
Bishop D. V. M.
2004.
Expression, Reception and Recall of Narrative Instrument (ERRNI).
London:
Psychological Corporation.
Bishop D. V. M.,
Bishop S. J.,
Bright P.,
James C.,
Delaney T., &
Tallal P.
1999.
Different origin of auditory and phonological processing problems in children with language impairment: Evidence from a twin study.
Journal of Speech, Language and Hearing Research,
42,
155–
168.Google Scholar
Bishop D. V. M.,
Carlyon R. P.,
Deeks J. M., &
Bishop S. J.
1999.
Auditory temporal processing impairment: neither necessary nor sufficient for causing language impairment in children.
Journal of Speech, Language and Hearing Research,
42,
1295–
1310.Google Scholar
Bishop D. V. M., &
McArthur G. M.
2004.
Immature cortical responses to auditory stimuli in specific language impairment: Evidence from ERPs to rapid tone sequences.
Developmental Science,
7,
F11–
F18.Google Scholar
Bishop D. V. M., &
McArthur G. A. (in press).
Individual differences in auditory processing in specific language impairment: A follow-up study using event-related potentials and behavioural thresholds.
Cortex.
Breier J. I.,
Gray L. C.,
Fletcher J. M.,
Foorman B., &
Klaas P.
2002.
Perception of speech and nonspeech stimuli by children with and without reading disability and attention deficit hyperactivity disorder.
Journal of Experimental Child Psychology,
82,
226–
250.Google Scholar
Bretherton L., &
Holmes V. M.
2003.
The relationship between auditory temporal processing, phonemic awareness, and reading disability.
Journal of Experimental Child Psychology,
84,
218–
243.Google Scholar
Byrne D.,
Dillon H.,
Tran K.,
Arlinger S.,
Wilbraham K.,
Cox R.,
Hagerman B.,
Hetu R.,
Kei J.,
Lui C.,
Kiessling J.,
Kotby M.,
Nasser N.,
El Kholy W. A. H.,
Nakanishi Y.,
Oyer H.,
Powell R.,
Stephens D.,
Meredith R.,
Sirimanna T.,
Tavartkiladze G.,
Frolenkov G. I.,
Westerman S., &
Ludvigsen C.
1994.
An international comparison of long-term average speech spectra.
Journal of the Acoustical Society of America,
96,
2108–
2120.Google Scholar
Clark M. G.,
Rosen G. D.,
Tallal P., &
Fitch R. H.
2000.
Impaired processing of complex auditory stimuli in rats with induced cerebrocortical microgyria: An animal model of developmental language disabilities.
Journal of Cognitive Neuroscience,
12,
828–
839.Google Scholar
Evans J. L.,
Viele K.,
Kass R. E., &
Tang F.
2002.
Grammatical morphology and perception of synthetic and natural speech in children with specific language impairments.
Journal of Speech, Language, and Hearing Research,
45,
494–
504.Google Scholar
Farmer M. E., &
Klein R. M.
1993.
Auditory and visual temporal processing in dyslexic and normal readers.
Annals of the New York Academy of Sciences,
682,
339–
341.Google Scholar
Fiez J. A.,
Raichle M. E.,
Miezin F. M.,
Petersen S. E.,
Tallal P., &
Katz W. F.
1995.
PET studies of auditory and phonological processing: effects of stimulus characteristics and task demands.
Journal of Cognitive Neuroscience,
7,
357–
375.Google Scholar
Findlay J. M.
1978.
Estimates on probability functions: A more virulent PEST.
Perception and Psychophysics,
23,
181–
185.Google Scholar
Goswami U.
2003.
Why theories about developmental dyslexia require developmental designs.
Trends in Cognitive Sciences,
7,
534–
540.Google Scholar
Goswami U.,
Thomson J.,
Richardson U.,
Stainthorp R.,
Hughes D.,
Rosen S., &
Scott S. K.
2002.
Amplitude envelope onsets and developmental dyslexia: a new hypothesis.
Proceedings of the National Academy of Sciences,
99,
10911–
10916.Google Scholar
Heath S. M.,
Hogben J. H., &
Clark C. D.
1999.
Auditory temporal processing in disabled readers with and without oral language delay.
Journal of Child Psychology and Psychiatry,
40,
637–
647.Google Scholar
Heiervang E.,
Stevenson J., &
Hugdahl K.
2002.
Auditory processing in children with dyslexia.
Journal of Child Psychology and Psychiatry,
43,
931–
938.Google Scholar
Hulslander J.,
Talcott J.,
Witton C.,
DeFries J.,
Pennington B.,
Wadsworth S.,
Willcutt E., &
Olson R.
2004.
Sensory processing, reading, IQ, and attention.
Journal of Experimental Child Psychology,
88,
274–
295.Google Scholar
Joanisse M. F., &
Gati J. S.
2003.
Overlapping neural regions for processing rapid temporal cues in speech and nonspeech signals.
Neuroimage,
19,
64–
79.Google Scholar
Johnsrude I. S.,
Zatorre R. J.,
Milner B. A., &
Evans A. C.
1997.
Left-hemisphere specialization for the processing of acoustic transients.
Neuroreport,
8,
1761–
1765.Google Scholar
Leppänen P. H., &
Lyytinen H.
1997.
Auditory event-related potentials in the study of developmental language-related disorders.
Audiology and Neurootology,
2,
308–
340.Google Scholar
Lincoln A. J.,
Dickstein P.,
Courchesne E.,
Elmasian R., &
Tallal P.
1992.
Auditory processing abilities in non-retarded adolescents and young adults with developmental receptive language disorder and autism.
Brain and Language,
43,
613–
622.Google Scholar
Manis F. R.,
McBride–Chang C.,
Seidenberg M. S.,
Keating P.,
Doi I. M.,
Munson B., &
Peterson A.
1997.
Are speech perception deficits associated with developmental dyslexia?
Journal of Experimental Child Psychology,
66,
211–
235.Google Scholar
Marshall C. M.,
Snowling M. J., &
Bailey P. J.
2001.
Rapid auditory processing and phonological ability in normal readers and readers with dyslexia.
Journal of Speech, Language and Hearing Research,
44,
925–
940.Google Scholar
McArthur G. M., &
Bishop D. V. M.
2001.
Auditory perceptual processing in people with reading and oral language impairments: current issues and recommendations.
Dyslexia,
7,
150–
170.Google Scholar
McArthur G. M., &
Bishop D. V. M.
2004a.
Which people with specific language impairment have auditory processing deficits?
Cognitive Neuropsychology,
21,
79–
94.Google Scholar
McArthur G. M., &
Bishop D. V. M.
2004b.
Frequency discrimination deficits in people with specific language impairment: reliability, validity, and linguistic correlates.
Journal of Speech, Language, and Hearing Research,
47.Google Scholar
McArthur G. M., &
Hogben J. H.
2001.
Auditory backward recognition masking in children with a specific language impairment and children with a specific reading disability.
Journal of the Acoustical Society of America,
109,
1092–
1100.Google Scholar
Müller R. A.,
Kleinhans N., &
Courchesne E.
2001.
Broca's area and the discrimination of frequency transitions: A functional MRI study.
Brain and Language,
76,
70–
76.Google Scholar
Neville H. J.,
Coffey S. A.,
Holcomb P. J., &
Tallal P.
1993.
The neurobiology of sensory and language processing in language-impaired children.
Journal of Cognitive Neuroscience,
5,
235–
253.Google Scholar
Nittrouer S.
1999.
Do temporal processing deficits cause phonological processing problems?
Journal of Speech, Language and Hearing Research,
42,
925–
942.Google Scholar
Norrelgen F.,
Lacerda F., &
Forssberg H.
2002.
Temporal resolution of auditory perception and verbal working memory in 15 children with language impairment.
Journal of Learning Disabilities,
35,
539–
545.Google Scholar
Poeppel D.
2003.
The analysis of speech in different temporal integration windows: cerebral lateralization as “asymmetric sampling in time.”
Speech Communication,
41,
245–
255.Google Scholar
Rosen S.
2003.
Auditory processing in dyslexia and specific language impairment. Is there a deficit? What is its nature? Does it explain anything?
Journal of Phonetics,
31,
509–
527.CrossRefGoogle Scholar
Rust J.,
Golombok S., &
Trickey G.
1993.
Wechsler Objective Reading Dimensions.
Sidcup:
Psychological Corporation.
Share D. L.,
Jorm A. F.,
Maclean R., &
Matthews R.
2002.
Temporal processing and reading disability.
Reading and Writing,
15,
151–
178.Google Scholar
Stark R. E., &
Heinz J. M.
1996.
Perception of stop consonants in children with expressive and receptive-expressive language impairments.
Journal of Speech and Hearing Research,
39,
676–
686.Google Scholar
Stark R. E., &
Tallal P.
1988.
Language, speech and reading disorders in children.
Boston:
Little, Brown and Co.
Studdert–Kennedy M., &
Mody M.
1995.
Auditory temporal perception deficits in the reading-impaired: A critical review of the evidence.
Psychonomic Bulletin and Review,
2,
508–
514.Google Scholar
Sutcliffe P.
2003.
Auditory processing performance in young children: Attention is needed.
Unpublished doctoral dissertation,
Oxford University,
Oxford.
Talcott J.,
Witton C.,
McClean M.,
Hansen P.,
Rees A.,
Green G., &
Stein J.
1999.
Can sensitivity to auditory frequency modulation predict children's phonological and reading skills?
Neuroreport,
10,
2045–
2050.Google Scholar
Talcott J. B.,
Witton C.,
McLean M. F.,
Hansen P. C.,
Rees A.,
Green G. G. R., &
Stein J. F.
2000.
Dynamic sensory sensitivity and children's word decoding skills.
Proceedings of the National Academy of Sciences,
97,
2952–
2957.Google Scholar
Tallal P.
1980.
Auditory temporal perception, phonics and reading disabilities in children.
Brain and Language,
9,
182–
198.Google Scholar
Tallal P.
2000.
Experimental studies of language learning impairments: From research to remediation.
In D. V. M. Bishop &
L. B. Leonard (Eds.),
Speech and language impairments in children: Causes, characteristics, intervention and outcome
(pp. 131–
155).
Hove:
Psychology Press.
Tallal P., &
Piercy M.
1973a.
Defects of non-verbal auditory perception in children with developmental dysphasia.
Nature,
241,
468–
469.Google Scholar
Tallal P., &
Piercy M.
1973b.
Developmental aphasia: Impaired rate of non-verbal processing as a function of sensory modality.
Neuropsychologia,
11,
389–
398.Google Scholar
Tallal P., &
Stark R. E.
1981.
Speech acoustic-cue discrimination abilities of normally developing and language-impaired children.
Journal of the Acoustical Society of America,
69,
568–
574.Google Scholar
Tallal P.,
Stark R., &
Curtiss B.
1976.
Relation between speech perception and speech production in children with developmental dysphasia.
Brain and Language,
3,
305–
317.Google Scholar
Tallal P.,
Townsend J.,
Curtiss S., &
Wulfeck B.
1991.
Phenotypic profiles of language-impaired children based on genetic/family history.
Brain and Language,
41,
81–
95.Google Scholar
Tomblin J. B., &
Quinn M. A.
1983.
The contribution of perceptual learning to performance on the repetition task.
Journal of Speech and Hearing Research,
26,
369–
372.Google Scholar
Torgesen J. K.,
Wagner R., &
Rashotte C.
1999.
Test of Word Reading Efficiency (TOWRE).
New York:
Psychological Corporation.
Troia G. A., &
Whitney S. D.
2003.
A close look at the efficacy of FastForWord Language for children with academic weaknesses.
Contemporary Educational Psychology,
28,
465–
494.Google Scholar
Van der Lely H. K. J.,
Rosen S., &
Adlard A.
2004.
Grammatical language impairment and the specificity of cognitive domains: relations between auditory and language abilities.
Cognition.Google Scholar
Waber D. P.,
Weiler M. D.,
Wolff P. H.,
Bellinger D.,
Marcus D. J.,
Ariel R.,
Forbes P., &
Wypij D.
2001.
Processing of rapid auditory stimuli in school-age children referred for evaluation of learning disorders.
Child Development,
72,
37–
49.Google Scholar
Wechsler D.
1999.
Wechsler Abbreviated Scale of Intelligence.
San Antonio, TX:
Psychological Corporation.
Whitfield I. C., &
Evans E. F.
1965.
Responses of auditory cortical neurons to stimuli of changing frequency.
Journal of Neurophysiology,
28,
655–
672.Google Scholar
Witton C.,
Talcott J. B.,
Hansen P. C.,
Richardson A. J.,
Griffiths T. D.,
Rees A.,
Stein J. F., &
Green G. G. R.
1998.
Sensitivity to dynamic auditory and visual stimuli predicts nonword reading ability in both dyslexic and normal readers.
Current Biology,
8,
791–
797.Google Scholar
Wright B. A.,
Lombardino L. J.,
King W. M.,
Puranik C. S.,
Leonard C. M., &
Merzenich M. M.
1997.
Deficits in auditory temporal and spectral resolution in language-impaired children.
Nature,
387,
176–
178.Google Scholar
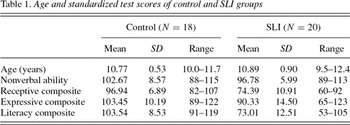
Age and standardized test scores of control and SLI groups
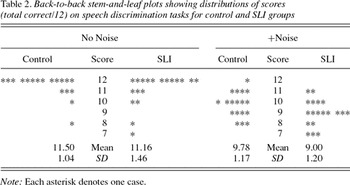
Back-to-back stem-and-leaf plots showing distributions of scores (total correct/12) on speech discrimination tasks for control and SLI groups
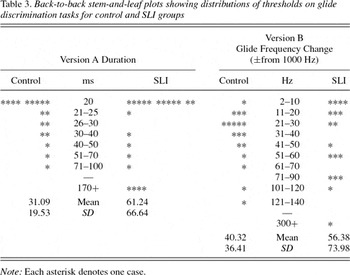
Back-to-back stem-and-leaf plots showing distributions of thresholds on glide discrimination tasks for control and SLI groups
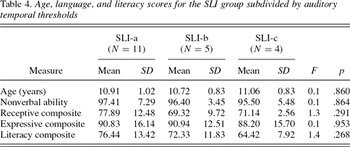
Age, language, and literacy scores for the SLI group subdivided by auditory temporal thresholds
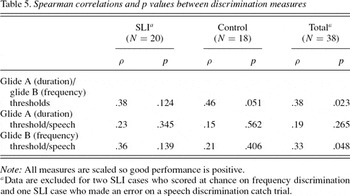
Spearman correlations and p values between discrimination measures
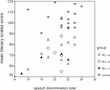
A scatterplot depicting literacy scores in relation to speech discrimination total score, with SLI children subdivided according to performance on Version A of glide discrimination. Group SLI-a could discriminate glides of 20-ms duration; Group SLI-b had a threshold between 21 and 100 ms; and group SLI-c had thresholds of 170 ms or more, outside the control range
 You have
Access
- 22
- Cited by