I. INTRODUCTION
Many semiconductor materials can be grown in the form of nanowires (NWs) by the vapor–liquid–solid (VLS) process using metal nanoparticles as catalysts. This has enabled a wide range of novel applications, such as nanoscale electronic, optical, and chemical-sensing devices,Reference Lieber and Wang1–Reference Schmidt, Wittemann, Senz and Gosele3 and has established semiconductor NWs as important potential building blocks of nanotechnology. However, many fundamental questions regarding the growth mechanisms still need to be answered to achieve better control of the orientation, yield, and quality of the NWs. Much of the studies on the VLS growth mechanism have been focused on Si and Ge NWs grown from Au catalysts, because of the relative simplicity of the Au–Si and Au–Ge phase diagrams and the anticipated compatibility of Si and Ge NWs with existing semiconductor industry.
Most of the existing analyses of the VLS growth are based on the continuum theory of crystal growth.Reference Dubrovskii and Sibirev4–Reference Schwalbach and Voorhees8 This approach has been successful in explaining certain features of NW growth, such as the modification of the chemical driving force of growth through the Gibbs–Thomson effectReference Adhikari, McIntyre, Marshall and Chidsey5, Reference Schwalbach and Voorhees8 and the dependence of energetically favorable orientations on NW diameter caused by surface energies.Reference Schmidt, Senz and Gösele9 However, many challenging and important questions remain to be answered. For example, how does the growth speed depend on NW orientation?Reference Irrera, Pecora and Priolo10 Why some catalyst particles fail to nucleate NWs?Reference Adhikari11 What causes growth anomalies such as kinking (i.e., sudden change of NW orientation during growth) ?Reference Madras, Dailey and Drucker12 What is responsible for the formation of metastable phases, such as hexagonal close-packed Au,Reference Marshall, Goldthorpe, Adhikari, Koto, Wang, Fu, Olsson and McIntyre13 upon growth termination? Answering these questions requires an understanding of the NW nucleation and growth mechanisms at the atomistic level.
Atomistic simulations, such as molecular dynamics (MD) and Monte Carlo (MC), are expected to provide useful insights to the NW growth and nucleation mechanisms. Because thousands of atoms are necessary for a reasonable description of NW growth process, ab initio simulations are prohibitively expensive, and classical MD or MC simulations based on empirical interatomic potentialsReference Kuo and Clansy14, Reference Dongare, Neurock and Zhigilei15 are necessary at present. Until now, Si NW growth has been studiedReference Haxhimali, Buta, Asta, Voorhees and Hoyt16 by a Si single component simulation, because of the absence of Au–Si interatomic potential. We have recently developed a Au–Si interatomic potentialReference Ryu and Cai17 that, for the first time, was fitted to the experimental binary phase diagram. This means that the NW growth process in the atomistic simulations using this model will experience thermodynamic driving forces that are similar to those in the experiments.
In this article, we present the first set of MD simulations of NW growth using this Au–Si potential model. Because the time scale of MD simulations (∼1 ns) is much shorter than the experimentally relevant time scale (∼1 s), here we accelerate the kinetics by considering the growth process at somewhat higher supersaturation or higher temperature conditions than typical experimental conditions. Nonetheless, the simulations reveal interesting trends in the atomistic mechanisms that are expected to be applicable to typical experimental conditions. To simulate the VLS process closer to the eutectic condition, advanced sampling techniquesReference Allen, Warren and ten Wolde18, Reference Auer and Frenkel19 are necessary and will be considered in the future.
We examined the morphology and kinetics of the interface between a Au–Si liquid alloy and a Si crystal at two orientations, {111} and {110}, which are most common in Si NW growth. To examine possible size effects, both infinitely large interfaces on top of bulk Si crystals (subjected to periodic boundary conditions in two directions) and finite-sized interfaces on top of Si NWs are considered. For both bulk crystals and NWs, the {111} surface moves by nucleation and lateral growth of a single two-dimensional (2-D) island, whereas the {110} interface moves by simultaneous growth at multiple sites. This difference is revealed by analyzing the atomistic structure at the interface during growth and is confirmed by the interface velocity v as a function of Si composition x Si in the liquid alloy at a given temperature T. This finding reveals the atomistic origin of the experimental observation that, under identical conditions, <110 > Si NWs growth several times faster than <111 > Si NWs.Reference Irrera, Pecora and Priolo20 We find that the equilibrium shape of the top surface of NWs is curved. Because of nanoscale size effect, the liquidus curve of the NWs is deviated from that of the bulk crystals. This explains the shift of the v(x Si) (at constant T) and v(T) (at constant x Si) curves from bulk Si crystals to Si NWs observed in our MD simulations and is consistent with the experimental observation of deep subeutectic growth of Ge NWs.Reference Adhikari, Marshall, Goldthorpe, Chidsey and McIntyre21 For both bulk crystals and NWs, the v(T) (at constant x Si) curves exhibit a maximum at an intermediate temperature. At high T, v decreases due to the diminishing thermodynamic driving force for crystallization. At low T, v decreases due to the reduced diffusivity in the liquid phase.
The article is organized as follows. Section II describes the atomistic model and simulation setup. Section III discusses MD simulation results for bulk crystals and NWs. A summary and outlook is given in Section IV.
II. SIMULATION SETUP
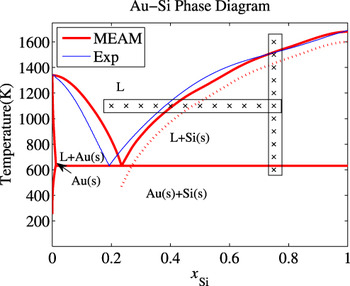
The Au–Si interatomic potentialReference Ryu and Cai17 used in this work was developed based on the modified embedded-atom method (MEAM) formalism.Reference Baskes22 The binary phase diagram of this potential model is shown in Fig. 1. Two series of MD simulations are performed for both bulk Si crystals and NWs. In the first series, the Si composition x Si in the liquid phase varies from 20–75% at temperature T = 1100 K. In the second series, T varies from 600 to 1600 K at x Si = 75%. These conditions are indicated as crosses in Fig. 1.
Binary phase diagram of Au–Si. The experimental phase diagram is plotted in thin line and the prediction from the modified embedded-atom method (MEAM) model is plotted in thick line. L corresponds to the liquid phase. Au(s) and Si(s) correspond to the Au-rich and Si-rich solid phases, respectively. Crosses indicate the temperature and Si concentration in the liquid alloy for the MD simulations in this work. The dotted line represents the estimated liquidus curve for nanowire (NWs).

Two sets of simulation cells are used for bulk Si crystals. The Si crystal with {111} top surface of the larger set has a dimension of 2 repeat distances along the [111] direction (1.88 nm), 4 repeat distances in the [121] direction (5.32 nm), and 6 repeat distances in the [101] direction (4.61 nm) and contains 2304 atoms. The Si crystal with {110} top surface has a dimension of 2 repeat distances along [101] (1.53 nm), 10 repeat distances along [010] (5.43 nm), and 6 repeat distances along [101] (4.61 nm) and contains 1920 atoms. The smaller set of simulation cells is half the size of the larger cells in the [101] direction. The coordinate system is chosen such that the y-axis is parallel to the normal of the top surface and the z-axis is along the [101] direction. Periodic boundary conditions are applied in the x and z directions. To initialize the liquid alloy, additional Au and Si atoms (7488 atoms for the larger cell and half the number for the smaller cell) are randomly positioned within a 5.6-nm-thick layer of the Si crystal, with the fraction of Si atoms specified by x Si.
MD simulations under a few selected T and x Si conditions are performed using the larger cells to analyze the growth mechanism in detail. To extract the surface velocity under all conditions marked in Fig. 1, MD simulations are performed using the smaller cells to save computational time.
For MD simulations of Si NWs, only the smaller simulation cells are used. Periodic boundary conditions are no longer applied in the x direction, but are still applied in the z direction. Hence our NW simulations are quasi-2-D models with a depth of 2.3 nm in the direction where periodic boundary conditions are applied, and a width of 5.32 nm for <111 > NWs and 5.43 nm for <110 > NWs. Full 3-D simulations of NWs with cylindrical cross section are much more time-consuming and will be considered in the future.
MD simulations are performed under the NVT ensemble using the Nosé–Hoover chain thermostatReference Lowe24 and the velocity Verlet algorithm with a time step of 0.5 femto-second. The dimensions of the simulation cell in the direction(s) where periodic boundary conditions are applied are set to the equilibrium size of the bulk Si crystal at the specified temperature to accommodate thermal expansion effects.
III. RESULTS AND DISCUSSIONS
A. Bulk Si crystals
In this section, we examine the morphology and kinetics of {111} and {110} surfaces of bulk Si crystals in contact with a Au–Si liquid alloy.
1. Equilibrium interface structure
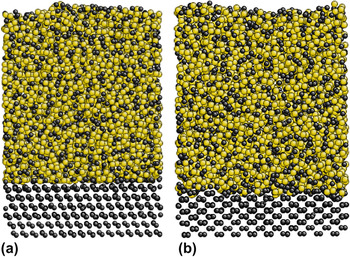
We first performed MD simulations at T = 1100 K and x Si = 40% (in the liquid phase), which is on the Si-rich branch of the liquidus curve of the Au–Si phase diagram. During the MD simulations for 250 pico-seconds, the overall position of the crystal surfaces does not change, as expected. Figures 2(a) and 2(b) show snapshots at the end of the simulations for {111} and {110} crystal surfaces, respectively. In Fig. 2(a), the {111} surface seems to remain atomically flat. In comparison, the {110} surface seems more disordered, with local regions where crystal growth or etching by unit atomic step is observable in Fig. 2(b). This is because even an atomically flat {110} surface has a zigzagged appearance, which promotes formation of surface steps.
Snapshots of equilibrated simulation cells for bulk Si crystals in contact with a Au–Si liquid alloy with Si fraction x Si = 40% at T = 1100 K. (a) Bulk crystal with {111} surface and (b) bulk crystal with {110} surface. Both viewed along the [110] (i.e., z) direction. Si and Au atoms are colored gray and gold, respectively. The images are produced using AtomEye.Reference Li23

2. Driving force for interface motion
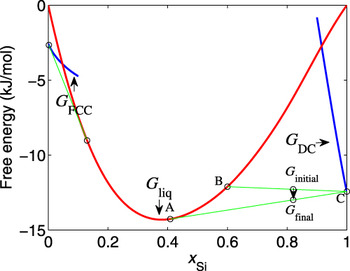
The Si crystal will either grow into the liquid or be etched away by the liquid, depending on whether Si composition x Si of the liquid is above or below the liquidus composition (40% at T = 1100 K). The thermodynamic driving force for crystal growth or etching can be visualized by plotting the free energies of the liquid and solid phases as a function of Si composition for a given temperature, as shown in Fig. 3. The free energy data for the MEAM potential are available from our previous phase diagram calculations.Reference Ryu and Cai17 For example, Fig. 3 plots the Gibbs free energies at T = 1100 K. For a liquid alloy with x Si > 40% in contact with a Si crystal, the Gibbs free energy of the entire system lies on the line BC. The total Gibbs free energy can be reduced to lie on the line AC if the liquid phase lowers its Si composition to 40%. This leads to transport of Si atoms from the liquid phase to the solid phase, that is, crystal growth. Similarly, if the initial Si composition in the liquid phase is less than 40%, the total Gibbs free energy can be reduced if the liquid phase raises its Si composition to 40%, by etching the Si substrate.
The Gibbs free energy of the three phases, G FCC, G DC, and G liq, as functions of the Si composition x Si at T = 1100 K. Common tangent lines are drawn between G FCC(x Si) and G liq(x Si) and between G liq(x Si) and G DC(x Si), showing the two liquidus compositions at 15 and 40%. A liquid with x Si > 40% in contact with a Si substrate can lower the total Gibbs free energy (G initial lying on line BC) of the system by lowering its own Si composition to 40% (G final lying on line AC), causing crystal growth.

3. Growth mechanisms
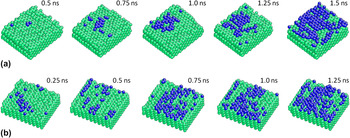
We now examine the kinetics of the {111} and {110} surfaces of bulk Si crystals at T = 1100 K in contact with Au–Si liquids with x Si = 60%. To monitor the evolution of the crystalline phase, a local crystalline order parameter q3 is computed for every Si atom during the simulation.Reference Ghiringhelli, Valeriani, Meijer and Frenkel25 Atoms with q3 > 0.7 are classified as belonging to the crystalline phase. Figures 4(a) and 4(b) show the growth mechanism of the crystalline phase for {111} and {110} surfaces, respectively. For better visualization, only atoms in the crystalline phase are plotted. The atoms belonging to the original bulk crystal are plotted in green, and new atoms joining the crystalline phase are plotted in blue.
Si atoms in the crystalline phase during MD simulations of bulk Si crystal in contact with Au–Si liquid allow at x Si = 60% and T = 1100 K. (a) Crystal with {111} surface grows by 2-D island nucleation and expansion. (b) Crystal with {110} surface experiences simultaneous growth at multiple sites.

The Si crystal with {111} surface grows in a layer-by-layer fashion, through the nucleation of a 2-D island and its lateral expansion to cover the entire surface, as shown in Fig. 4(a). Prior to the successful island nucleation shown in Fig. 4(a), we observed several unsuccessful nucleation events in which small 2-D islands appear and disappear on the {111} surface.
On the contrary, the Si crystal with {110} surface experiences simultaneous growth at multiple sites, as shown in Fig. 4(b). Atoms are also found to arrive at the second and third layers before the first layer covers the surface completely. A closer look at Fig. 4(b) reveals that the atomic attachment to the {110} surface is not completely random. Adatoms tend to form atomic rows along the [110] direction. This suggests that at lower supersaturations, the growth of {110} surface may be controlled by 1-D nucleation and growth of [110] atomic rows. However, under the conditions examined here, the atomic rows form rapidly and are not nucleation controlled.
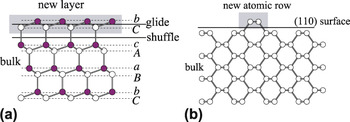
The origin of this mechanistic difference can be traced to the atomistic structures of the {111} and {110} surfaces. As shown in Fig. 5(a), there are two sets of {111} planes in the diamond-cubic crystal structure: the widely separated shuffle-set plane, and the narrowly separated glide-set plane. We find that the {111} surface is always in contact with the liquid alloy at the shuffle-set plane so that each atom on the surface has only one dangling bond. We also observe that every island nucleated on the {111} surface contains two closely spaced layers of atoms [e.g., b and C in Fig. 5(a)] sandwiching a glide-set plane. On the average, every two atoms in the island make only one bond with the substrate. The low bond density between the island and the substrate means that small 2-D islands are unstable because they can easily detach from the surface, and only sufficiently large 2-D islands are stable.
Atomistic structure of the diamond-cubic structure of Si with (a) color online {111} surface and (b) {110} surface, both viewed along the [110] direction.

On the other hand, the {110} surface has a naturally zigzagged appearance, as shown in Fig. 5(b). On the average, each new atom arriving at the surface makes one bond with the substrate, making them more stably attached to the surface. Furthermore, an isolated row of atoms along the [110] direction is quite stable on the {110} surface. Every new atom added to the end of the atomic row forms one bond with the atom at the end of the row and one bond with the substrate. Hence, 1-D atomic rows instead of 2-D islands are identifiable features for {110} growth, as shown in Fig. 4(b).
We observe that the formation of a Si island on the crystal surface leads to a local excess of Au concentration, which tends to etch the newly formed island unless the Au atoms diffuses away sufficiently fast. Hence, we believe the diffusion of Au atoms in the binary liquid plays an important role in determining crystal growth rate.
4. Growth velocity
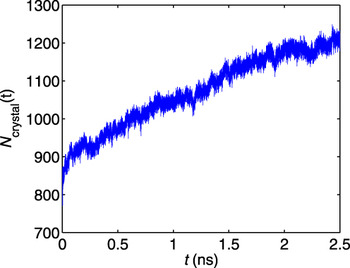
We now examine the dependence of the interface velocity on temperature T and Si concentration in the liquid alloy x Si. Because this requires MD simulations under a wide range of conditions, the smaller simulation cell is chosen to speed up the computation. Figure 6 plots the total number of atoms in the crystalline phase as a function of time for T = 1100 K and x Si = 65% for the {110} surface. Steady-state growth is observed after a transient period of t = 0.25 ns. As the Si crystal grows, the liquid phase is gradually depleted of Si atoms. Prior to t = 1.25 ns, the variation of x Si in the liquid phase is less than 2%. To reduce the error, we run three independent simulations and use the average velocity as our estimate. From the period of 0.25–1.25 ns, the surface velocity at x Si = 65% is estimated to be v = 0.22 ± 0.04 m·s−1.
The total number of atoms in the crystalline phase as a function of time at T = 1100 K and x Si = 65% for a bulk crystal with {110} surface.

Figure 7 shows the Si surface velocity v obtained using this procedure from MD simulations for both {111} and {110} surfaces at T = 1100 K as a function of the ∆x ≡ x Si − x LSi, where x LSi = 40% is the liquidus composition. The v(∆x) curve for the {111} surface is clearly nonlinear and can be fitted by the function |v| = v 0 exp(−a/|∆x|), as shown in Fig. 7. This confirms that the {111} surface grows by nucleation of 2-D islands, whose activation free-energy barrier should be inversely proportionalReference Markov26 to ∆x, assuming that the chemical potential difference of Si in liquid and solid is proportional to ∆x. On the other hand, the v(∆x) curve for the {110} surface can be well fitted to a straight line, confirming that the {110} surface undergoes simultaneous growth at multiple sites. Notice that when ∆x < 0, v also becomes negative, meaning that the Si crystal is etched away by the liquid alloy, consistent with the binary phase diagram.
Average crystal growth speed at T = 1100 K as functions of supersaturation ∆x = x Si-x LSi for bulk Si crystals with {111} and {110} surfaces. The {111} data is fitted to |v| = v 0 exp(−a/|∆x|), with v 0 = 1.0 m·s-1, and a = 0.47. The {110} data is fitted to v = b∆x, with b = 1.1 m·s-1.

Figure 8 shows the Si surface velocity v for both {111} and {110} surfaces at x Si = 75% as a function of T. Because the liquidus line crosses the x Si = 75% line at T 0 = 1500 K, etching (instead of crystal growth) is expected for T > T 0. For both {111} and {110} surfaces, the v(T) curve is nonlinear and can be fitted to an empirical expressionReference Markov26 v = v 0 exp(−c/T)(1 − T 0/T) with an assumption that the chemical potential difference of Si in liquid and solid is proportional to T 0 − T. The exponential term describes the temperature effect on diffusivity in the liquid phase, while the next term captures the temperature effect on the thermodynamic driving force of crystallization. Maximum growth speed is observed at around 250 K below T 0. The {110} surface is observed to move faster than the {111} surface in both Figs. 7 and 8. This is consistent with the differences in their growth mechanisms identified earlier.
Average crystal growth speed as functions of temperature at liquid droplet composition x Si = 75% for bulk Si crystal with {111} and {110} top surfaces. The data are fitted to v = v 0 exp(−c/T)(1−T 0/T), where T 0 = 1500 K, and c = 5800 K. v 0 = 140 m·s−1 for the {111} surface and v 0 = 210 m·s−1 for the {110} surface.

B. Si nanowires
In this section, we examine the morphology and kinetics of {111} and {110} surfaces on top of Si NWs in contact with a Au–Si liquid droplet.
1. Equilibrium interface structure
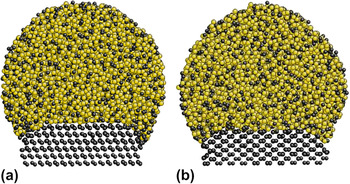
We performed MD simulations at T = 900 K and x Si = 32% (in the liquid phase), which is on the Si-rich branch of the liquidus curve of the Au–Si phase diagram. Figures 9(a) and 9(b) show snapshots at the end of the 250 pico-seconds simulations for Si NWs with {111} and {110} top surfaces, respectively. The cross section of the liquid droplet becomes circular to minimize the free energy. The main difference from Fig. 2 in the surface morphology of the crystals is that the top NW surface becomes curved near the edges for both {111} and {110} orientations. This is consistent with transmission electron microscopy observationsReference Madras, Dailey and Drucker12 and earlier predictions from continuum models.Reference Schwarz and Tersoff27
Snapshots of equilibrated simulation cells for Si NWs at 900 K with the liquid Si fraction x Si = 32%. (a) <111>-oriented NW, and (b) <110>-oriented NW. All the figures are viewed along the [110] orientation. Large spheres are Au atoms and small spheres are Si atoms.

2. Growth mechanisms
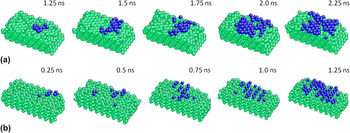
We now examine the kinetics of the {111} and {110} surfaces of bulk Si crystals at T = 1100 K in contact with Au–Si liquids with x Si = 60%. Figures 10(a) and 10(b) show the growth mechanism of the crystalline phase for {111} and {110} surfaces, respectively. Again, only atoms in the crystalline phase are plotted. The atoms belonging to the original bulk crystal are plotted in green, and new atoms joining the crystalline phase are plotted in blue.
Si atoms in the crystalline phase during MD simulations of Si NW in contact with Au–Si liquid allow at x Si = 60% and T = 1100 K. (a) NW with {111} top surface, and (b) NW with {110} top surface.

The Si NW with {111} top surface grows in a layer-by-layer fashion, through the nucleation and expansion of 2-D islands as shown in Fig. 10(a). On the contrary, the Si NW with {110} top surface experiences simultaneous growth at multiple sites, as shown in Fig. 10(b). Growth occurs at multiple sites on the {110} surface simultaneously, through the formation of [110] atomic rows. Therefore, the mechanistic difference between {111} and {110} surfaces identified for bulk Si crystals is also applicable to Si NWs.
3. Growth velocity
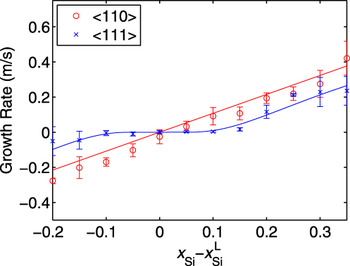
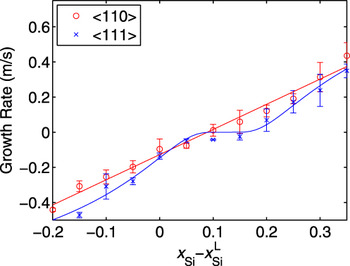
We now examine the dependence of the interface velocity on temperature T and Si concentration in the liquid alloy x Si. Figure 11 shows the velocity v of {111} and {110} surfaces on top of Si NWs at T = 1100 K as a function of the ∆x ≡ x Si – x LSi, where x LSi = 40% is the liquidus composition in the bulk. Because the top surfaces of NWs are curved near the edge, it is more difficult to extract their velocities accurately from MD simulations, leading to larger error bars. Nonetheless, it is clear that v is negative (i.e., NW is etched by the liquid) at ∆x = 0 and that a positive supersaturation (on the order of ∆x ∼10%) is needed to establish equilibrium (i.e., v = 0). This means that the Si-rich branch of the liquidus curve for the NWs is shifted to the right relative to bulk, which implies that the chemical potential in solid phase increases more than that in liquid phase. At a first glance, this seems contrary to the existing models in which the Gibbs–Thomson effect in the NWs is exclusively attributed to the pressure induced by cylindrical side surfaces,Reference Adhikari, McIntyre, Marshall and Chidsey5 whereas our quasi-2-D model has zero curvature in the NW side surface. However, we should not neglect the surface energy cost for NW growth, which increases the chemical potential in solid by ∆μ s=Ω sσ sS/V, where Ω s is atomic volume in solid phase and σ s is surface energy of side wall. S/V is the surface to volume ratio and equals 2/d, where d is the width of NW. When the surface energy contribution is included, ∆μ s is larger than the increase of chemical potential of the liquid phase, ∆μ l=Ω lσ l/r, where r is the radius of curvature in the liquid droplet.
Average growth speed at T = 1100 K as functions of supersaturation ∆x=x Si-x LSi for Si NWs with {111} and {110} top surfaces. The {111} data is fitted to |v| = v 0 exp(−a/|∆x−∆x 0|), with v 0 = 1.1 m·s-1, a = 0.25, and ∆x 0 = 0.12. The {110} data is fitted to v = b |∆x−∆x 0|, with b = 1.43 m·s-1 and ∆x 0 = 0.09.

Because atomistic snapshots (Fig. 10) suggest that the {111} surface moves by 2-D island nucleation and that the {110} surface experiences simultaneous growth at multiple sites, we fit the velocity data using the similar functional forms as those used for bulk crystals. The only difference is the introduction of a parameter ∆x 0 to account for the shift of liquidus curves (see the caption of Fig. 11). From the fitting, the liquidus curve is estimated to shift by ∆x 0 = 12% for the <111 > NW and by ∆x 0 = 9% for the <110 > NW at T = 1100 K.
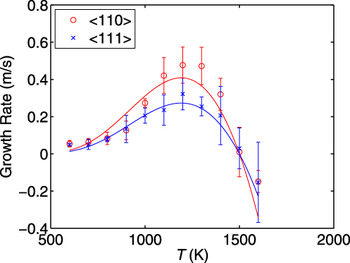
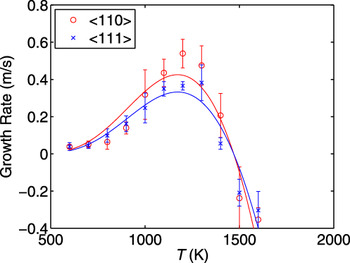
Figure 12 shows the Si NW growth velocities as a function of T at liquid composition x Si = 75%. The temperature at which growth velocity is zero is estimated to be around T 0 = 1470 K, which is about 30 K below the bulk liquidus temperature. The data are fitted to the same functional form as that used for bulk crystals, showing that the same mechanisms limiting growth speeds in bulk crystals also operate in Si NWs.
Average growth speed as functions of temperature at liquid droplet composition x Si = 75% for Si NWs with {111} and {110} top surfaces. The data are fitted to v = v 0 exp(−c/T)(1−T 0/T), where T 0 = 1470 K, and c = 5800 K. v 0 = 150 m·s−1 for the {111} surface and v 0 = 290 m·s−1 for the {110} surface.

IV. SUMMARY
We have performed the first MD simulations of the morphology and kinetics of the interface between Si crystals and Au–Si liquids using a Au–Si potential fitted to the experimental phase diagram. For both bulk crystals and NWs, the {110} surface shows simultaneous growth at multiple sites, whereas the {111} grows by nucleation and expansion of 2-D islands. The dependence of growth speed on Si composition of the liquid phase supports the growth mechanisms identified from simulation snapshots. At a constant liquid composition, the crystal growth speed decreases at high temperature because of reduced thermodynamic driving force for crystallization and decreases at low temperature because of reduced diffusivity in the liquid. The growth speed dependence on liquid composition and temperature shows that the Si-rich branch of the liquidus curve for the NWs is shifted to the right relative to that for the bulk crystal.
A promising direction for future research is to establish a quantitative connection between the growth speeds predicted by the MD simulations with continuum kinetic theories. Large-scale 3-D simulations of NW growth are necessary to quantify the limitations of the quasi-2-D model used in this work. The structure of the curved interface between NW and liquid droplet also needs to be investigated further to understand the atomistic mechanisms of kinking. Ultimately, atomistic simulations need to be performed at typical experimental conditions in which the growth speed is orders of magnitude lower than those considered here. Advanced sampling techniques will be necessary to extend the time-scale limit of conventional MD simulations.
ACKNOWLEDGMENTS
This work is partly supported by the Department of Energy/SciDAC project on Quantum Simulation of Materials and Nanostructures and National Science Foundation/CMMI Nano Bio Materials Program CMS-0556032.