The profitability of a dairy farm is traditionally dependent on the daily milk yield of the dairy cow. The milk quota system, however, implemented in Norway and the EU, limits the amount of milk sold for full price. With such a system it is beneficial to produce a given level of milk at lowest possible cost (Halasa et al. Reference Halasa, Huijps, Østerås and Hojsgaard2007).
The most importantw costs in dairy farming are related to feeding, loss of milk production due to disease and reproductive disorders, labour and treatment of diseased animals (Wolf, Reference Wolf2003).
Disease, in addition to being one of the major costs, is also the focus of society in terms of animal welfare. Associations between high production, increased disease rates and reduced animal welfare made by the public have increased the awareness of health management on dairy farms (Mulligan et al. Reference Mulligan, O'Grady, Rice and Doherty2006). Earlier investigations concluded that there is an association between high milk production and an increased risk of mastitis (Gröhn et al. Reference Gröhn, Erb, McCulloch and Saloniemi1990; Wilson et al. Reference Wilson, González, Hertl, Schulte, Bennett, Schukken and Gröhn2004; Bar et al. Reference Bar, Gröhn, Bennett, González, Hertl, Schulte, Tauer, Welcome and Schukken2007).
Mastitis is defined as an inflammation of the parenchyma of the mammary gland. In approximately 80% of inflamed quarter milk samples, bacteria are found (Sandholm, Reference Sandholm, Sanholm, Honkanen-Buzalski, Kaartinen and Pyörälä1995; Radostits et al. Reference Radostits, Gay, Blood and Hinchcliff2000). Despite different mastitis control strategies it is still the most common disease in dairy herds in many countries (Bradley, Reference Bradley2002; Sviland & Waage, Reference Sviland and Waage2002). Previous research has shown that management influences the incidence of mastitis in dairy production (Dohoo et al. Reference Dohoo, Martin and Meek1984). The goal of day-to-day milk production should be to achieve both the highest possible yield and lowest possible occurrence of disease. Investigations have shown that persistency of the lactation curve, defined as the ability to maintain a high milk yield throughout the lactation, is of great importance to dairy economics (Sölkner & Fuchs, Reference Sölkner and Fuchs1987; Dekkers et al. Reference Dekkers, Hag and Weersink1998) and is influenced by genetic traits for common health disorders (Appuhamy et al. Reference Appuhamy, Cassell, Dechow and Cole2007; Appuhamy et al. Reference Appuhamy, Cassell and Cole2009).
Because the shape of the lactation curve is influenced by management factors (Wood, Reference Wood1969; Tekerli et al. Reference Tekerli, Akinci, Dogan and Akcan2000), knowing whether an association exists between the shape of the curve and the mastitis risk at herd level would be of value in future herd health management. Therefore, the current study was conducted to identify associations between mastitis incidence at herd level and lactation curve characteristics such as production level at onset of lactation (intercept), magnitude and time of peak milk yield, together with slope before peak milk yield and slope after peak milk yield. To investigate whether the association found was truly connected to the shape of the lactation curve rather than total lactation milk yield, a subset of high-yielding lactations was also used in a second analysis. To the authors’ knowledge these associations have not been studied previously.
The objectives were twofold. The first aim was to identify the association between the mastitis incidence at herd level and the characteristics of the lactation curve shape. The second was to identify the possibility of reducing herd level mastitis incidence through management interventions aimed at altering the shape of the lactation curve at herd level.
Materials and Methods
The Norwegian Dairy Herd Recording System
All dairy cows in Norway have an individual health card on which all veterinary diagnoses and treatments are recorded (Østerås et al. Reference Østerås, Solbu, Refsdal, Roalkvam, Filseth and Minsaas2007). Because Norwegian farmers do not have direct access to veterinary drugs, the vast majority of treatments are carried out by veterinarians who are required by law to register disease and medication on the individual health cards (Ministry of Agriculture and Food, 2002). Monthly test-day milk yields are recorded on every farm. These data, along with health card records, are reported regularly by the farmer, the field personnel from the dairy industry, or both, to the Norwegian Dairies Association's central milk recording system database and stored as individual records. Reporting these data is mandatory for members of the Norwegian Dairy Herd Recording System (NDHRS). In 2005, 95% of all the dairy herds, corresponding to 97% of all dairy cows in Norway, were included in the national recording system.
Study population
The study population consisted of NDHRS records from dairy cows that started their lactation after 1 January 2005 and ended their lactation in 2006. The observed test days in this study included those within 305 days in milk (DIM) or before culling if this occurred before 305 DIM. Every dairy cow was allowed to be represented by a maximum of one lactation. Norwegian Red is the most common breed in Norway, constituting 94% of the Norwegian dairy cow population; all other breeds were excluded from the study. After applying these conditions, the material consisted of 14 766 herds and 250 303 lactations.
Individual data were used to count the number of mastitis treatments within each herd; two treatments within 8 d were counted as the same disease case. To generate the herd mastitis incidence, the number of cases was divided by the estimated mean number of 305-d lactations within each herd. The study sample was adjusted by removing the following extreme values: milk weight at test day=0, considered as a missed recording (1·16% of total); herd-size <5 cows (0·92% of total); average daily milk yield per cow <11 kg/d (0·83% of total), considered as an erroneous recording; test-day recordings earlier than 5 DIM, due to the period of colostrum production (0·89% of total); cow reported as sick at test day (0·07% of total); percentage of recruited or culled animals over 100% (1·01% and 1·60% of total respectively), considered to be erroneous recording. Lactations were classified according to mastitis incidence rate in the herd (MA_GRP). Low incidence rate (MA_GRP=1) was <0·07 cases/305-d lactation. High incidence rate (MA_GRP=2) was >0·31 cases/305-d lactation. Classification was done using the upper and lower quartiles of the distribution of herd mastitis incidence rate. First parity, second parity and third or later parities were grouped into three different strata. Finally, lactations with the most common calving season, July–September (37·01%), were selected for the analyses. Thus, the study sample consisted of 623 205 test-day milk yield recordings from 75 869 lactations in 11 569 herds.
Method
The study was performed as a retrospective cohort study with a closed population. A modified Wilmink model (Wilmink, Reference Wilmink1987) was used in a mixed model to parameterize the shape of the lactation curve adjusted for the effects of mastitis and parity. The analysis was run twice with different subsets and model equations.
The first analysis aimed to investigate whether the shape of the lactation curve at herd level was associated with the herd mastitis incidence. To eliminate a possible effect of mastitis on the shape of the lactation curve a subset of lactations with no records of veterinary treatment was selected. This subset consisted of 25 777 lactations either in MA_GRP=1 or in MA_GRP=2. The effect of MA_GRP as well as interaction terms was included in the model as shown in the equation below.
Equation I:

where subscript ijk identifies the i-th test day in the j-th lactation in the k-th herd, Y is milk yield (kg), DIM is the number of days from calving to the test day, lnDIM is the natural logarithm of DIM, MA_GRP is low or high herd mastitis incidence rate, PAR is the parity group and ε is the error term. The beta-values are associated with: the intercept of milk yield (kg) with the y-axis (β0), the slope of the lactation curve before peak milk yield (β1), the slope of the lactation curve after peak milk yield (β2), the interaction effect of MA_GRP with the intercept (β3), the interaction effect of PAR with the intercept (β4), the interaction effect of MA_GRP with the slope before peak milk yield (β5), the interaction effect of PAR with the slope before peak milk yield (β6), the interaction effect of MA_GRP with the slope after peak milk yield (β7) and the interaction effect of PAR with the slope after peak milk yield (β8).
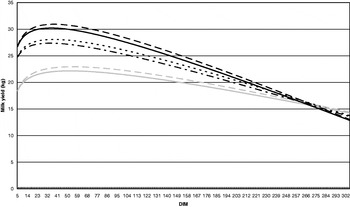
The intercept and β-values found when running the model were used in the equation to generate the lactation curves from low and high mastitis incidence rate herds (Fig. 1). These values and their se were also used directly as parameters for the milk yield at the onset of lactation (β0) and the slope before (β1) and after (β2) peak milk yield, which were compared between MA_GRP classes using confidence intervals. Finally, the β-values were used for calculation of peak milk yield (−β1/β2) and the day of peak milk yield [β0+(β1∗ln(peak milk yield))+(β2∗peak milk yield)].
Estimated lactation curves of lactations with no records of veterinary treatment from Norwegian dairy cattle with calving season July–September during 2005 and 2006: 12 226 first parity lactations from herds with high herd mastitis incidence rate (MA_GRP=2, >0·31 cases/305-d lactation) ( ) and from herds with low herd mastitis incidence rate (MA_GRP=1, <0·07 cases/305-d lactation) (
 ), 6567 second parity lactations from herds with high herd mastitis incidence rate (MA_GRP=2, >0·31 cases/305-d lactation) (▪▪▪▪) and from herds with low herd mastitis incidence rate (MA_GRP=1, <0·07 cases/305-d lactation) (▬ ▪ ▬) and 9821 third or later parity lactations from herds with high herd mastitis incidence rate (MA_GRP=2, >0·31 cases/305-d lactation) (▬ ▬) and from herds with low herd mastitis incidence rate (MA_GRP=1, <0·07 cases/305-d lactation) (▬▬).

The model was run using PROC MIXED (SAS Institute Inc., Cary NC 27513, USA, 2003) with unique lactation ID, test-day milk record as the repeated effect and the random effect of natural logarithm of DIM. A spatial power correlation matrix, SP(POW), was chosen after evaluating different relevant matrices according to the model fit.
The second subset consisted of 34 839 high-yielding lactations, selected from the top 25% of average daily yield throughout the lactation period. These lactations had either one or more records of veterinary treatment of mastitis (MA=1), or no record of veterinary treatment (MA=0). All milk yield records appearing after the first mastitis case were deleted. The effect of mastitis was included in the model as shown in the equation below.
Equation II:

where subscript ijk identifies the i-th test day in the j-th lactation in the k-th herd, Y is milk yield (kg), DIM is the number of days from calving to the test day, lnDIM is the natural logarithm of DIM, MA is no records or records of veterinary treatment of mastitis, PAR is the parity group and ε is the error term. The beta-values are associated with; the intercept of milk yield (kg) with the y-axis (β0), the slope of the lactation curve before peak milk yield (β1), the slope of the lactation curve after peak milk yield (β2), the effect of MA on the intercept (β3), the interaction effect of PAR with the intercept (β4), the interaction effect of MA with the slope before peak milk yield (β5), the interaction effect of PAR with the slope before peak milk yield (β6), the interaction effect of MA with the slope after peak milk yield (β7) and the interaction effect of PAR with the slope after peak milk yield (β8).
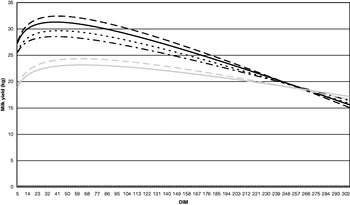
The intercept and β-values found when running the model were used in the equation that generated the lactation curves from lactations with and without cases of veterinary treated mastitis (Fig. 2). These values and their se were also used directly as parameters for the milk yield at the onset of lactation (β0) and the slope before (β1) and after (β2) peak milk yield which were compared between MA classes using confidence intervals. Finally, the β-values were used for calculation of peak milk yield (−β1/β2) and the day of peak milk yield [β0+(β1*ln(peak milk yield))+ (β2*peak milk yield)].
Estimated lactation curves of high yielding lactations (>25·24 kg milk/d on average for lactation) from Norwegian dairy cattle with calving season July–September during 2005 and 2006: 2343 first parity lactations with records of veterinary treatment of mastitis only () and no records of veterinary treatments (), 4700 second parity lactations with records of veterinary treatment of mastitis only (▪▪▪▪) and no records of veterinary treatments (▬ ▪ ▬) and 7555 third or later parity lactations with records of veterinary treatment of mastitis only (▬ ▬) and no records of veterinary treatments (▬▬).

The model was run using PROC MIXED (SAS Institute Inc., 2003) with unique lactation ID, test-day milk record as the repeated effect and the random effect of natural logarithm of DIM. A spatial power correlation matrix, SP(POW), was chosen after evaluating different relevant matrices according to the model fit.
Results
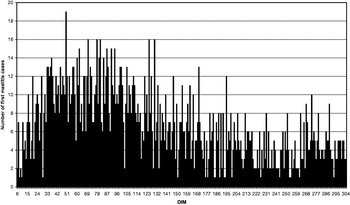
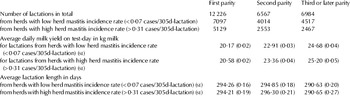
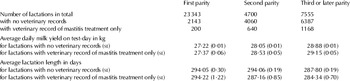
The herds used in the study sample had component feed consisting of 41·9% concentrate, 41·1% grass silage, 14·7% pasture and 2·3% other feedstuffs. Descriptive statistics of Subset 1 are given in Table 1 and of Subset 2 in Table 2. The distribution of the occurrence of the first mastitis case of the lactations in Subset 2 is shown in Fig. 3.
Distribution of the occurrence of first mastitis case in 2008 lactations with record of mastitis treatment only from 5 DIM until 305 DIM from Norwegian dairy cattle with calving season July–September during 2005 and 2006. All these cases have at least one test-day recording before the mastitis occurred.

Descriptive statistics of lactations with no records of veterinary treatment and calving season July–September in Norwegian dairy cattle during 2005 and 2006 from all herds, herds with low mastitis incidence rate (MA_GRP=1) and herds with high herd mastitis incidence rate (MA_GRP=2)

Descriptive statistics of high yielding lactations (>25·24 kg milk/d on average for lactation) with records of veterinary treatment of mastitis only or no records of veterinary treatment and calving season July–September in Norwegian dairy cattle during 2005 and 2006

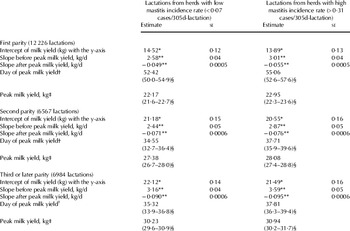
Using Subset 1, the lactation curve parameters (β1, β2 and β3) were compared between lactations from herds with low herd mastitis incidence rate (MA_GRP=1, <0·07 cases/305-d lactation) and high herd mastitis incidence rate (MA_GRP=2, >0·31 cases/305-d lactation) (Table 3 and Fig. 1). Lactation curves from herds with high herd mastitis incidence rate had a lower milk yield intercept (P<0·05), a steeper slope before peak milk yield (P<0·01) and a faster decline after peak milk yield (P<0·01) compared with lactation curves from herds with low herd mastitis incidence rate across all parity groups. Peak milk yield and the day of peak milk yield did not differ between lactations from herds with low and high mastitis incidence rate for any of the parity groups.
Lactation curve parameters of Norwegian dairy cows calving during July–September of 2005 and 2006. Parameters were estimated from test-day milk yield data of lactations without records of veterinary mastitis treatment from herds with high (MA_GRP=1) and low (MA_GRP=2) mastitis incidence rate

† − slope before peak milk yield / slope after peak milk yield
‡ starting milk yield + [slope before peak milk yield*ln(peak day)] + (slope after peak milk yield*peak day)
§ interval calculated from 95% lower and upper confidence limits of estimates
* estimates within same row differ (P<0·05) ** estimates within same row differ (P<0·01)
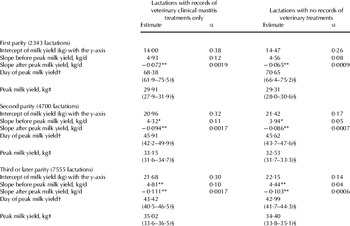
Using Subset 2, the lactation curve parameters (β1, β2 and β3) of high-yielding cows were compared between lactations with records of veterinary treatment against mastitis and lactations with no records of veterinary treatments (Table 4 and Fig. 2). The lactation curves of treated cows in the second parity lactation had a steeper slope before peak milk yield (P<0·05) compared with lactations of cows with no records of veterinary treatment. This was also found for third or later parity lactations (P<0·01). For all parities, the lactation curve of treated cows had a faster decline after peak milk yield (P<0·01) compared with that of untreated cows. Peak milk yield and the day of peak milk yield did not differ between lactations with and without mastitis cases.
Lactation curve parameters of high yielding (>25·24 kg milk/d on average for lactation) Norwegian dairy cows calving during July–September of 2005 and 2006. Parameters were estimated from test day milk yield data of lactations without records of veterinary mastitis treatment and lactations with records of veterinary mastitis treatment only

† – slope before peak milk yield / slope after peak milk yield
‡ starting milk yield + [slope before peak milk yield*ln(peak day)] + (slope after peak milk yield*peak day)
* estimates within same row differ (p<0·05) ** estimates within same row differ (p<0·01)
§ interval calculated from 95% lower and upper confidence limits of estimates
Discussion
The results of the analyses of the current study indicated that the shape of the lactation curve was a better indicator for mastitis risk at herd level than magnitude of milk yield at peak production. Herd level variables such as management, feeding strategy, breeding goals, milk yield and milking management are factors that may influence the shape of the lactation curve and the incidence of herd mastitis. The current study aimed to use the shape of the lactation curve to mirror the effect of such management factors. We consider feeding strategy to be the most important of these variables under Norwegian conditions.
Our approach, which involves herd level analysis on lactation curve shape and mastitis incidence rate, might suggest that our conclusions are based on ecological fallacy. Earlier research shows that high yield is associated with an elevated mastitis risk (Gröhn et al. Reference Gröhn, Wilson, González, Hertl, Schulte, Bennett and Schukken2004; Bar et al. Reference Bar, Gröhn, Bennett, González, Hertl, Schulte, Tauer, Welcome and Schukken2007). The high herd milk yield in the current study might be due to effective management of the dairy farm, utilizing every drop of milk that is produced, together with herd parity composition, herd culling strategy or both. These findings are not necessarily the same at lactation level. To investigate this relationship, we chose to sample high-yielding lactations and compare the lactation curves of lactations with and without data on mastitis treatment. Our findings at herd level were verified in the lactation level approach. Thus, the shape of the lactation curve was also a better indicator for mastitis risk at the individual level than magnitude of milk production at the peak of production.
The shape of the lactation curve is known to be influenced by individual traits such as genetics, parity, calving season and disease (Wood, Reference Wood1969). By using only Norwegian Red, which is governed by a strict national breeding programme, the genetic material in the current study was limited and the variation was taken care of by using a large study population. In statistical analyses only, parity was checked for by stratification and calving season was adjusted for by including calvings in July through to September. In accordance with numerous earlier studies (Gröhn et al. Reference Gröhn, Wilson, González, Hertl, Schulte, Bennett and Schukken2004; Bar et al. Reference Bar, Gröhn, Bennett, González, Hertl, Schulte, Tauer, Welcome and Schukken2007; Hagnestam et al. Reference Hagnestam, Emanuelson and Berglund2007) we also observed an effect of treatment for clinical mastitis on the shape of the lactation curve. This, however, was not the aim of the current study, so we have refrained from reporting those results.
A lactation curve with high persistency, hence a lactation curve with a slow decline in milk production after peak yield, was found to be associated with lactations with no records of veterinary treated mastitis in the current study. These lactation level findings in the current study partly concur with two earlier reports (Appuhamy et al. Reference Appuhamy, Cassell, Dechow and Cole2007; Appuhamy et al. Reference Appuhamy, Cassell and Cole2009). In these studies genetic traits for mastitis were found to be negatively correlated with the persistency of milk yield. The studies also describe, however, genetic traits for mastitis early in lactation being positively correlated with persistency of milk yield. Considering that most of the mastitis cases in the material of the current study occur early in lactation (Fig. 3), the result of the current study was in disagreement with these earlier studies. Furthermore, persistency of milk yield is also found to be of positive value in earlier studies on economic output in dairy farms (Sölkner & Fuchs, Reference Sölkner and Fuchs1987; Dekkers et al. Reference Dekkers, Hag and Weersink1998). This concurrence can partly be explained by the cost of disease, due to veterinary treatment and to loss of milk. Results from the current and earlier studies therefore would lead us to recommend the inclusion of persistency of milk yield in breeding programmes, but with the awareness of the antagonistic relationship between early occurrence of mastitis and persistency of milk yield.
A modified Wilmink model was used to parameterize the lactation curve in the current study (Wilmink, Reference Wilmink1987). This was a linear model with a limited number of parameters which directly describe characteristics of the lactation curve shape (Chang et al. Reference Chang, Gianola, Heringstad and Klemetsdal2004). The assumptions of the model were satisfied when evaluated by the qq-plot, the normality of the residuals and the predicted v. residuals plot. Potential confounding of correlation between test-day milk yields and clustering within lactation was taken care of by running the model with repeated measurements within lactation nested within herd ID. Several correlation matrices were evaluated, but in the final models the spatial power correlation matrix SP(POW) was chosen because it gave the lowest value using the Akaike information criterion.
Using data from the NDHRS might create some concerns about misclassification bias in terms of erroneous or omitted recordings. This affects not only the omitting of lactations with cases of disease, but also the calculation of the herd mastitis incidence used in the study. Furthermore the current study used observations from herds in the first and fourth quartiles of herd mastitis incidence rate. There is a potential risk of these groups being most affected by invalid data, because of increased or decreased motivation for treating clinical mastitis. Even if there are no validations of the NDHRS database the authors feel confident that misclassification is minimized by high herd membership, thorough reporting routines and the long history of the database.
No geographical, economic or management-related criteria were used in the selection process of the study sample used in the current study. Therefore the results can be implemented in all Norwegian dairy cows. Applying the results to an even broader population would imply certain restrictions in regard to differences in breed, milk yield, milk quota system, climate, feeding strategies and health situations.
The conclusion from the current study is that there is a herd level association between the shape of the lactation curve of disease-free cows and the herd mastitis incidence rate. An association at lactation level between the shape of the lactation curve in high-yielding disease-free cows and the occurrence of mastitis treatments later in the current lactation was also found.
In the short term these results can be used in the daily herd management on dairy farms. With automatic milking systems becoming more common on the modern dairy farm, the day-to-day milk yield, and hence the lactation curve, can be easily monitored. By applying changes to feeding and management the lactation curve may be adjusted in a favourable direction in terms of mastitis risk.
In the long term, the results of the current study could be included in the national breeding programme of Norwegian Red cows. The ultimate goal would be to breed a sustainable dairy cow with a lactation curve shape which is found to have a low risk of mastitis.
To test the suggested applications of the current study results, a controlled clinical trial where cows are randomly assigned to different management strategies should be conducted. This would indicate whether practical management decisions based on the shape of the lactation curve can be used to change the herd mastitis incidence rate.
Access to the production and health data used in this study was granted by the Norwegian Dairy Herd Recording System (NDHRS) and the Norwegian Cattle Health Services (NCHS) under agreement number 003/2007. The study was financially supported by grants from (Norges forskningsråd) the Research Council of Norway (56%), (Forskningsmidler over jordbruksavtalen) Agricultural Agreement Research Fund and (Fondet for forskningsavgift på landbruksprodukter) Foundation for Research Levy on Agricultural Products (together 44%).