I. INTRODUCTION AND BACKGROUND
Powder bed based additive manufacturing (AM) processes using both lasers and electron beam have demonstrated the ability to fabricate complex geometric components with significant performance improvement through weight reduction and design optimization at reduced costs and time to market. Among all powder AM processes, the electron beam melting (EBM) process is considered attractive for several reasons. Reference Antonysamy1 Due to the inherent nature of vacuum processing, the impurity pick up level is low from the atmosphere, which is critical when fabricating materials such as Ti–6Al–4V where the oxygen content strongly influences mechanical properties. The electron beam can be moved across the powder bed without any inertia. As a result, it is possible to control the molten pool size, depth, and velocity. Additionally, the electron beam can be defocused and rapidly scanned over the surface of the powder bed, resulting in nearly planar heat input over the surface. This scan strategy is utilized to preheat the powder bed and maintain a nearly uniform temperature in the component for the duration of the build. Conventional preheat temperatures for Ti–6Al–4V are ∼600 °C, but can reach up to 1100 °C for other materials.
Extensive research has been conducted on the application of the EBM process for Ti–6Al–4V. Reference Al-Bermani, Blackmore, Zhang and Todd2 The research has shown that the mechanical properties of these builds can be manipulated by modifying the build temperature, process parameters, and scan strategies. These variations affect thermal gradients (G denoted in the units of K/m), liquid–solid interface velocities (V denoted in the units of m/s), peak temperatures (T p), cooling rates (R denoted in the units of K/s), and number of thermal gyrations (n c), which in turn control the solidification structure, crystallographic texture, and final microstructure that evolves from solid-state decomposition. It is interesting to note that these five parameters govern spatial variation of defects such as porosity, heterogenous microstructure, and heterogenous mechanical properties in any AM process used. Reference Wang, Williams, Colegrove and Antonysamy3–Reference Makiewicz5 EBM technology has been applied to Inconel 718, but a thorough background of superalloy metallurgy is an important prerequisite to understand the results.
A. Overview of microstructure evolution in Inconel 718
To provide context to the observed microstructures in Inconel 718, a brief review of expected microstructures in Inconel 718 is presented here. The microstructure of Inconel 718 is dominated by a FCC γ Nickel FCC matrix dispersed with age-hardening precipitates including ordered (L12) γ′ (Ni3Al), BCT (D022) γ″ (Ni3Nb), orthorhombic δ (Ni3Nb), hexagonal Laves (Fe2M), HCP η (Ni3Ti), and various metal carbides with either FCC or cubic structures. Reference Geddes, Leon and Xiao6 The overall microstructure, including phases present, morphology, distribution, orientation, etc. is directly related to the initial fabrication technology and subsequent post processing conditions. Typically, Inconel 718 is utilized in either the cast or wrought processing condition followed by post processing to generate the optimized microstructure for the specific use or application.
Cast superalloys have three standard casting conditions: equiaxed, columnar grain, and single crystal. Porosity can be an issue in cast parts, with interior pores removable via hot isostatic pressing (HIP) and surface pores repairable via welding. Reference Donachie and Donachie7 Cast Inconel 718 can have a tendency to form Laves phase, which is associated with decreased mechanical performance due to a brittle nature. Wrought material is typically equiaxed, with exact grain size and morphology determined by processing conditions and heat treatment. Heat treatments are guided by experimental TTT diagrams, which exist in the literature. 8 If the heat treating processing to produce wrought product is not carefully controlled, Laves phase may form as well. The formation of Laves phase generally occurs in heavily segregated regions, where the Nb concentration is higher. Reference Schirra, Caless and Hatala9 During solidification, dendrites form and cause Nb and other constituents to segregate to the interdendritic regions. In general, segregation within the γ matrix is a common phenomenon in both wrought and cast material, and can be related to grain boundaries and interfaces.
A thorough review of Inconel 718 metallurgy was conducted by Radavich,
Reference Radavich10
which explains the role of solute segregation during solidification as a key to understanding phase evolution. Inconel 718, after homogenizing and heat treatment, produces nanoscale, “sandwich-like” morphology due to co-precipitation of γ' and γ″.
Reference Miller, Babu and Burke11
The heat treatments applied are important to the character of the δ phase presence too, as overaging from heat treatment of 718 results in the
 $\gamma '' \to \delta$
transformation. The δ-phase is incoherent with the γ matrix and forms along (111) planes or at grain boundaries, and it can cause reduced strength. The δ solvus temperature is key to grain size control in wrought 718, as the δ phase frequently lies on grain boundaries.
B. Application of AM to Inconel 718
Extension of the EBM process to Inconel 718 is attractive for both aerospace and energy applications in terms of reducing the expensive casting, forging, and heat treatment operation. However, most of the AM research has revolved around the laser AM process. Reference Gu, Meiners, Wissenbach and Poprawe12,Reference Chaudhary13 Most of this research focuses on either developing thermal models or characterizing microstructure and properties. Reference Zhang, Li and Deceuster14–Reference Tabernero, Lamikiz, Martínez, Ukar and Figueras20 Recently, the role of heterogenous properties in Inconel 718 builds was pointed out by hardness mapping, electron backscatter diffraction imaging (EBSD), and electron microscopy. Reference Makiewicz5,Reference Tian21 Makiewicz characterized the effect of laser melted thermal build history for Inconel 718. For laser-based processes, the relationship of solidification and subsequent beam passes is the important consideration. After melting, subsequent laser beam passes create thermal cycling within the aging temperature range. This leads to hysteresis in precipitate formation and was quantified via scanning electron microscopy (SEM) image analysis. This work was done to explain variation of microhardness in the build direction. All the above work also demonstrates that the optimization of additively manufactured Inconel 718 can be achieved by using the large body of welding metallurgy literature Reference Cieslak, Headley and Romig22–Reference Lippold, Kiser and DuPont25 in nickel alloy systems.
Strondl et al. performed pioneering research on EBM processing of Inconel 718. Reference Strondl, Fischer, Frommeyer and Schneider26–Reference Strondl, Milenkovic, Schneider, Klement and Frommeyer28 This work characterized fully dense EBM Inconel 718 using x-ray diffraction (XRD), transmission electron microscopy (TEM), and EBSD. XRD showed “very sharp” (100) texture in the build direction, and this texture remained pronounced after post-process heat treatment. EBSD was performed in tandem with energy dispersive spectrometer (EDS) to identify δ phase precipitates (<10 µm in length), which confirmed the (100) texture and the expected orientation between the matrix and δ phase. Previous TEM work by Strondl et al. has shown γ″ precipitates sized 5–10 nm, with some 50–100 nm precipitates at low angle grain boundaries. Some large precipitates (0.2–2 µm) were found to be multiple phases packed together. Some γ′ precipitates were identified, sized 2–5 nm. The γ′ precipitates were always found adjacent to γ″ precipitates. Atom probe measurements were taken to reveal the composition at locations corresponding to the identified precipitates. The presence or absence of microstructural heterogeneity was never discussed by Strondl et al. However, recent research by Unocic et al. Reference Unocic, Kolbus, Dehoff, Dryepondt and Pint29 has shown heterogenous microstructure in the axial direction of an Inconel 718 sample used for tensile testing produced by EBM. In this sample, coarser precipitates were observed close to the top of the build and finer precipitates close to the bottom of the build. Similarly, grain coarsening has been observed in Ti–6Al–4V EBM parts, with coarser grains at the top of the build. Reference Mireles, Terrazas, Medina and Wicker30 It is interesting to note that, irrespective of microstructural gradients in the build direction, most of the published research focus on following standard mechanical property testing that is developed for homogenous microstructures. Very few literature sources are providing as-fabricated thermal build histories for AM produced parts, and no sources that have related them to mechanical properties.
C. Motivation
The work presented in this paper seeks to rationalize the heterogenous microstructure observed in previous work. The effect of thermal history is explored through examination of tensile specimens, microstructure, and process temperature data. As-fabricated properties, while treated by some as irrelevant, are important because there are manufacturers considering the use of as-fabricated parts. Thermal calculations are applied to previously measured results, with the goal of providing a pathway to get homogenous or engineered microstructure. Further mechanical tests are presented to demonstrate the importance of the thermal process to mechanical properties, specifically cool down rate.
II. EXPERIMENTAL PROCEDURES
A. Typical EBM processing details
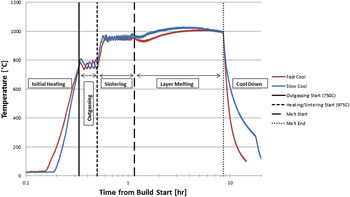
An Arcam A2 EBM machine (Sweden) was used to produce the material tested in this paper. Inconel 718 rotary atomized powder was used by Unocic et al., while gas atomized powder was used to produce the material tests presented in this paper. Experimental build temperature readings, where given, were taken from a thermocouple in contact with the center of the underside of the stainless steel build substrate. Temperature reading at the substrate during the processing stages is frequently used as a rough average of the temperature of the bulk-solidified material in the build volume, because of the poor thermal conductivity of powders that surround the processed region. The readings from this thermocouple were compiled by the machine log file generator. These log files were used to infer information about the temperature of the build volume. A typical thermal profile is shown in Fig. 1. An in-depth description of the relationship of the build process to the thermal history is provided.
Typical thermal cycles measured below the stainless steel substrate during electron beam processing with slow and fast cooling conditions.

Initial heating and outgassing: In this stage, a more diffuse beam scan is used to heat the substrate. Outgassing is set to hold for a certain length of time (15–30 min) after reaching the desired outgassing temperature (750 °C). Thermal oscillation occurs, as the beam is cycled on and off to maintain the temperature using the thermocouple readings from the build substrate.
Sintering of powder under substrate: Heating resumes after outgassing and continues until the desired sintering temperature is reached (975 °C). This is held for a set sintering time (30 min). Again, thermal oscillation occurs, as the beam is cycled on and off to maintain the temperature using the thermocouple readings from the build substrate.
Layer melting: An iterative process is engaged for raking powder, powder preheating, powder melting, and melt post-heating. It is noteworthy that the characteristics of this process may change the above-mentioned five parameters (G, V, R, T p, and n c) that control the microstructure evolution. For example, variable solidification rates (G and V) may occur throughout the build, including the effect of melt-reheating, as subsequent layers are melted.
Cool down: This processing stage is indeed often ignored while discussing the EBM processing in the literature. When the final layer is melted, all processes are stopped, and the machine begins to cool down. There are two ways to cool samples in the system: fast and slow. The “fast” cool down is done by injecting helium gas into the build chamber to act as an inert convective medium for thermal transport. The “slow” cool down can be thought of as a vacuum cool; the vacuum in the build chamber is held, and the part is cooled only by surface radiation to the build chamber and conduction to the rest of the system. The effect of fast versus slow cool was studied, with the effect on the thermal readings is shown in Fig. 1. It is important to note that the time-axis scale is logarithmic and the cooling process in vacuum is very slow taking 10–20 h. The effect of these cool down processes may lead to large variations in the microstructure of Inconel 718, and is explored in this paper.
B. EBM processing details for production of tensile samples
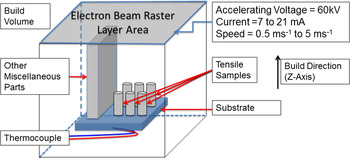
Additional processing details of the 718 tensile samples built by EBM by Unocic et al. Reference Unocic, Kolbus, Dehoff, Dryepondt and Pint29 are reported here. The Inconel 718 tensile specimens were built in the Arcam A2 with rotary-atomized powder. These specimens were built along with other taller miscellaneous parts. The taller parts continued to build, even after the tensile specimens were completed. This indeed subjects the tensile specimens to remain at the build temperature (950–1000 °C) until all parts were finished building. The setup for this build is shown in Fig. 2. The build details are summarized in Table I.
The build setup for the produced tensile specimens from Unocic et al. Reference Cieslak23

EBM process parameters used for making tensile samples used by Unocic et al. Reference Unocic, Kolbus, Dehoff, Dryepondt and Pint29

C. Characterization methodologies
Specimens were analyzed using light optical microscopy (LOM), SEM equipped with an energy dispersive x-ray spectrometer, and scanning-transmission electron microscopy (STEM) using Philips model CM200 equipped with a Schottky field emission gun, equipped with an x-ray EDS, and operated at 200 kV. For SEM characterization, specimens were mounted and polished using standard metallographic techniques. TEM specimens were electropolished using an electrolyte consisting of methanol with 5% perchloric and 35% 2-n-butoxyethanol at −40 °C and 15 V.
III. RESULTS AND DISCUSSIONS
A. Microstructure gradients in tensile samples
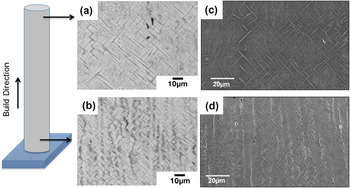
The microstructures observed in the tensile sample have been previously published by Unocic et al. Reference Unocic, Kolbus, Dehoff, Dryepondt and Pint29 Additional TEM details are presented here, without reproducing all the microstructures. The tensile properties of the as-fabricated samples were close to those of wrought materials. The failure locations of these tensile specimens were analyzed in follow-up work by Unocic et al. Reference Unocic, Kolbus, Dehoff, Dryepondt and Pint31 The authors noted that cracking occurred along the Nb, Ti, and Mo-enriched interdendritic region. It is well known that these elements play an important role as precipitates in Inconel 718, and are of interest in the formation of δ-phase along the solidification grain boundaries. LOM images on material taken from the top and the bottom of the tensile specimen are shown in Figs. 3(a) and 3(b). These images show coarser δ-phase at the top of the specimen and finer δ-phase at the bottom of the specimen. In addition, the bottom regions show the presence of etching contrast that corresponds to segregation along the columnar solidification dendrites. This suggests that there are spatially varying thermal cycling within the tensile specimens along the build direction. Finally, both the bottom and top regions show preferred orientation of the large δ-phase at ∼45° to the vertical direction of columnar grain growth. It is interesting to note that these aligned δ-phases appear to form within the FCC grains and not at the solidification grain boundaries.
(a) Etched LOM image and (c) SEM image parallel to build direction (XZ plane) from the top of the tensile specimen, (b) etched LOM image and (d) SEM image parallel to build direction from the bottom of the tensile specimen.

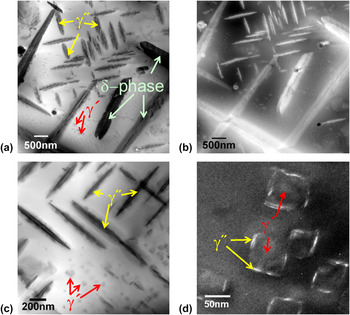
TEM was used to characterize phases present in Inconel 718 produced by EBM. An example of the bright field (BF) and dark field (DF) STEM images of the microstructure of as-fabricated specimen is shown in Fig. 4. The sample was prepared from the bottom of the cylinder from a cross-section perpendicular to building direction (XY). TEM analysis indicated that the orientation of grains in the XY plane was close to the [001] zone axis within 4–5° of tilt. Three different types of precipitates were found and confirmed via electron diffraction analysis: γ′, γ″, and δ-phase (other phases like Laves phase and carbides were not in the area of interest for characterization). The largest precipitates with the morphology of long platelets were confirmed to be δ-phase. Cuboidal precipitates were identified as γ′ and its average size was 60 nm. The γ″ phase appeared in two different sizes. Larger γ″ with an average size of 65 nm was rod shape, while disc shape (35 nm) γ″ was formed on γ′ surfaces. Both γ′ and γ″ were present within the γ matrix near the δ-phase. δ-phase was present within the matrix and at the grain boundaries, where δ normally forms first at the grain boundaries. In general, the precipitation of δ-phase within grain interiors takes place when metastable γ″ transform to stable δ-phase, which is expected at high temperature. Dehmas et al. Reference Dehmas, Lacaze, Niang and Viguier32 studied the formation of δ-phase directly from the FCC matrix, above the γ″ solvus temperature using XRD and TEM and refuted the need for preferential nucleation and growth of δ-phase on the γ″. Additionally, small quantities of Laves, η, and σ phases were observed in the dendritic grain boundaries of the sample.
(a) BF STEM, (b) high angle angular DF image (Z-contrast image), (c) higher magnification of BF STEM, and (d) DF image.

B. Correlation of thermal profiles to microstructure evolution
This paper seeks to rationalize the previously observed microstructure evolution [strong columnar growth, segregation along the dendrite boundaries, Reference Unocic, Kolbus, Dehoff, Dryepondt and Pint31 tendency to form δ-phase and complex fine-scale γ′ and γ″ microstructure (Fig. 4) and spatial variation (Fig. 3)]. To explain these microstructure variations, the thermal history of the build must be considered at the locations of microstructure analysis. However, it is not possible to measure thermal profiles in all the stages due to accessibility within the Arcam machine. Available temperature measurements are only from the bottom of the SS304 substrate. Therefore, the following assumptions were made to extract thermal profiles from the melting and cool down stages shown in Fig. 1.
1. Melt-stage thermal cycle and columnar solidification
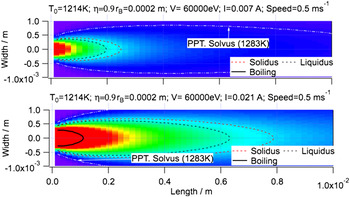
As mentioned earlier, the melt processing occurs by rastering electron beam rapidly across the whole surface at high speeds (Fig. 2). In the literature, there have been some attempts to model this using finite element methods including the consideration of powder sintering. Reference Shen and Chou33 However, extension of these models to the present samples proved difficult due to spatially varying scans and lack of thermophysical properties of porous powder bed and transients in powder sintering. To address this difficulty, the scan process was simplified as a steady state welding heat source that has been placed periodically with an offset of 200 µm. The thermal cycle for each scan was calculated using the following equation. Reference Babu, David, Vitek, Mundra and DebRoy34,Reference Ion, Easterling and Ashby35 This methodology is similar to the approach used by Wang et al. Reference Wang, Williams, Colegrove and Antonysamy3
 $$T = {T_0} + {{\eta {Q \mathord{\left/ {\vphantom {Q V}} \right. \kern-\nulldelimiterspace} V}} \over {2\pi \lambda \sqrt {t\left( {t + {t_0}} \right)} }}{\rm{exp}}\left\{ { - {1 \over {4a}}\left[ {{{{{\left( {z + {z_0}} \right)}^2}} \over t} + {{{{\left( y \right)}^2}} \over {t + {t_0}}}} \right]} \right\}\quad .$$
In the above equation, T 0 is the preheat temperature, Q is the net heat input in Watts (here voltage × current), V is the welding velocity, λ is thermal conductivity, t is the time, y is the distance along the width of the powder bed, z is the distance along thickness powder bed. Furthermore, a is thermal diffusivity, t 0 is given by (r b 2/4a), r b is the radius of the heat source, and z 0 is defined as ((r b/e)(πar b/V))0.5. Using physical parameters for nickel, typical thermal profiles were estimated as shown in Fig. 5.
Calculated spatial temperature variations in Inconel 718 for two different beam current used by EBM process while keeping all other parameters constant. The data can be used for estimation of the solidification grain structure by calculating the temperature gradient and liquid–solid interface velocity.

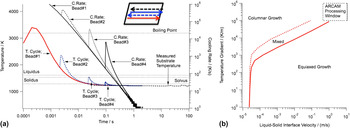
By placing the above steady state thermal profile in a given location in the powder bed, it is possible to estimate the thermal excursion during the successive melt stages of each scan or bead. These estimates are shown in Fig. 6(a). In addition, typical temperature gradient and liquid–solid interface velocities for the tensile test build were calculated and overlaid with the solidification map for Inconel 718. These maps were originally published by Nastac et al. Reference Nastac, Valencia, Tims, Dax and Lora36 The analyses show that for most of the conditions, the solidification conditions will be in the columnar grain region or mixed regions. This is in agreement with columnar growth observed in the top and bottom of the builds shown in Fig. 3.
(a) Typical calculated thermal cycles for successive bead in a typical layer melting stage. The data show the rapid reduction in peak width and reduction in cooling rate over many orders of magnitude as the melt cools from a temperature close to the boiling point to the liquidus. (b) The data were used to estimate the Arcam processing window typical to that of the tensile test building with reference to a solidification map.

The Arcam processing window sits at a “critical point” in the thermal gradient versus liquid–solid interface velocity map as shown in Fig. 6(b), and could explain why columnar grain structure forms. The thermal conditions of the build may be more complex than a simple thermal gradient during solidification; upon cool down, helium is injected into the system. The top of the build volume then becomes a convective boundary, while the bottom of the systems remains conductive. When under vacuum, radiative loss from the top surface is very significant. Upon cool down and the loss of the applied heat source, a thermal “sandwich” may develop, with the middle of the build volume remaining at a higher temperature than either the bottom or the top. Currently, there are no process models to capture these complex transients.
2. Rationalization of segregation during solidification
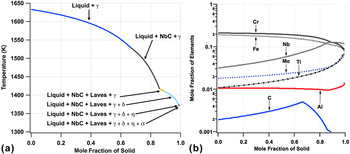
Simulation of solidification segregation Reference Babu37 was performed using the commercial software Thermocalc, 38 which is based on the Calphad methodology. Reference Lukas, Fries and Sundman39 The Scheil module of the software predicts phase evolution during the solidification process and estimates solute redistribution between the solid and the solidifying liquid phases. A Nickel database (TTNi7) was used for the simulations. Figure 7(a) shows the expected phases during the solidification process and their respective formation temperatures. The solidification state temperature is predicted to be 1361 °C with the formation of γ matrix at the dendrite core. The γ matrix gets steadily depleted in Nb, Mo, Ti, and C because of alloy partitioning as solidification proceeds [Fig. 7(b)]. When the solidifying system has ∼35% liquid remaining in the matrix, formation of NbC phase is predicted from the C and Nb enriched liquid. In the final stages of solidification, Nb enrichment of the remaining liquid leads to the formation of delta phase at the dendrite boundaries. A small fraction of η, σ, and Laves phases are also predicted.
(a) Expected phases during the solidification process and their respective formation temperatures, and (b) composition changes as solidification proceeds.

The segregation of Nb, Mo, and Ti to the interdendritic regions is in agreement with follow-up work by Unocic et al. Reference Unocic, Kolbus, Dehoff, Dryepondt and Pint31 Some η, σ, and Laves phases were observed in the dendritic grain boundaries of the samples, which is in line with the small fraction predicted by this simulation. This simulation shows that γ′ and γ″ are not formed in solidification, but the compositional segregation they require is achieved; these phases, which are the most important for precipitate hardening of Inconel 718, will be largely controlled by either a hold (aging) period or post process cool down.
3. Phase evolution during extended hold
During the layer melting process stage, the bottom layers of the samples will be held at high temperature near or just above the substrate temperatures for extended periods. Therefore, it may be conceivable to predict the phase fraction assuming equilibrium conditions. Thermodynamic phase stability analysis was performed to determine stable phases expected between 1400 °C and 700 °C in IN718 using the TTNi7 database. Figure 8 shows the fractions of various phases expected in this temperature range. At the top of the build, where the average temperature is expected to be 1000 °C (1273 K), the predicted phases are γ-matrix and δ-phase. In contrast, that the bottom of the build, which has an average hold temperature of 965.09 °C (1238 K), the phases predicted are again γ-matrix and δ-phase. Although this is in agreement with the observed δ-phase, the characterization results also indicated the presence of γ′ and γ″ precipitates in the matrix. This suggests that high temperature phase stability analysis is inadequate to describe the formation of microstructure evolution. For this reason, continuous cooling diagram for Inconel 718 was used to study the formation of various phases during the additive process.
Calculated equilibrium volume fraction of different phases in Inconel 718.

4. Microstructure evolution during continuous cooling conditions
The CCT diagram for IN718 was developed using a thermodynamic and materials property modeling software called JMatPro. Reference Saunders, Guo, Li, Miodownik and Schille40 Such diagrams have been used previously for Ni-based alloys with good correlation to experimental results. Reference Saunders, Guo, Li, Miodownik and Schille41 The thermocouple data from the tensile specimen log file are plotted on a CCT curve in Fig. 9(a) as denoted by “bottom layer”. It is assumed that the thermocouple is in isothermal equilibrium with the bottom of the build. It is harder to make an assumption about the thermal profile of the top of the build. Two assumptions are graphed in Fig. 9(a): the isothermal build volume assumption and the same solidification rate assumption. The isothermal build volume case assumes that the entire build volume is in isothermal equilibrium with the thermocouple. The same solidification rate case assumes that the top layer will solidify at the same rate as the bottom layer, and all thermal data are shifted to match the starting temperature. For both the top and the bottom of the specimen, it is assumed that solidification occurs so quickly that the thermal profile is quenched to the build volume or layer temperature; the given curves start from bulk temperature instead of melting temperature. The thermocouple data acquired for the bottom of the build were translated in time to correspond to when the top layer was melted; the Time After Layer Completion is the time after the melt of the given layer occurred.
(a) Cooling curves are shown for the tensile specimens and (b) theoretical microstructural evolution at given locations.

The evolutions of the microstructure for the same solidification rate case (T1–T5) and for the bottom case (B1–B3) are related to the thermal history in Fig. 9(b). While a CCT diagram is not an accurate assumption due to nonlinear cooling rates, it is helpful to understand how differences in thermal history may qualitatively contribute to the microstructure. When considering the bottom of the sample (B1–B3), it is worth noting that there is a local minimum in temperature. This local minimum indicates that cooling diagrams alone cannot model precipitate formation in EBM; precipitate dissolution models must be included iteratively and require a completely new way of modeling growth and dissolution as done by Makiewicz Reference Makiewicz5 for laser deposited Inconel 718.
If the isothermal build volume assumption is considered, Nb may be consumed in γ″ formation and limit δ formation and growth. In the case of the same solidification rate assumption, δ phase formation prior to γ″ may allow δ precipitates a jump start in growth, leading to coarser precipitates than the bottom. In situ monitoring of AM parts, paired with more robust thermal analysis, is necessary to rationalize the exact mechanisms for the microstructure. It should be noted that when fast cool down is engaged (it was not for the specimens analyzed here), the addition of convective cooling at the surface of the part must be considered as well.
C. Results on the effect of rapid cooling rate
Based on the analyses presented in this paper, it was postulated that changing the cooling rate of the builds could modify the precipitate distribution. This hypothesis was evaluated with tensile test samples made with two different cool down conditions. Two specimens for each rate were tested and averaged to obtain the results in Table II. The samples were produced using gas atomized powder and machined to ASTM E8/E8M Standard for round specimens, within guidelines for small samples. 42 The gauge diameter was 2.54 mm (0.1 in.) and the grip diameter was 7.62 mm (0.3 in.), with total length up to 80 mm (3.15 in.) depending on material constraints to accommodate space for an extensometer. These results show that ductility is much improved in the fast cool down, at the expense of ultimate tensile strength (UTS). The elongation in the slow cool down is lower, but the UTS is improved. These data suggest that the extra time spent at temperature during a slow cool down is an effective aging technique for precipitate hardening of the material. It is important to note that the data presented here do not represent a best-case scenario for as-built properties, as powder quality and build parameters were not fully optimized during this experiment.
Results of tensile tests done samples made with fast and slow cool down condition (thermal profiles were shown in Fig. 1). The orientations of the samples were horizontal for both conditions.

While there may be some constraints on the ways in which axial variation can be controlled, the use of the EBM process to change the solidification rate and then modify the microstructure is proposed. This capability of independent control of solidification and solid-state phase transformation is unique for EBM in contrast to other AM processes and traditional processes including welding or casting. However, to improve control over microstructure, reliable build time and build temperature predictions or measurements are crucial. Further work is required, and is in progress, to realize a priori control (using path, current, and velocity) over thermal cycle optimization to produce desired microstructure and mechanical properties, both in bulk and locally.
IV. CONCLUSIONS
The work in this paper demonstrates that material made in an EBM process can be subjected to different thermal cycles, both axially and in bulk, leading to heterogenous microstructure. Specific conclusions with reference to Inconel 718 are as follows:
-
(i) Microstructure gradients can occur by the coarsening of δ-phase precipitates.
-
(ii) A complex evolution of γ′, γ″, and δ can occur within EBM deposited Inconel 718, depending on the extended hold temperature and cooling conditions.
-
(iii) Using thermal cycles and results of computational thermodynamic models that calculate the solidification microstructure and kinetics of precipitation (e.g., CCT diagram), process parameter selection for EBM can be guided.
-
(iv) For identical process and geometrical conditions, different mechanical properties were achieved by varying cool down rate.
These results suggest a path forward for the engineering of precipitate evolution through in situ heat treatment using the EBM AM process. There is also a need to re-evaluate the way mechanical testing is performed on EBM material; if precipitate formation can vary axially, it stands to reason that mechanical properties will as well. The gage length of a vertical tensile sample may not be representative of the tensile strength of material from either grip section. Future work should seek to explore the phase variation in samples produced from both short and long hold times. Additionally, vertical mechanical testing should take care to report the location of the gage length with respect to the build orientation, and the axial variation of mechanical properties should be explored.
Current work on EBM microstructure and mechanical property testing does not adequately address the effect of thermal history on as-built parts. With more thermal data from in situ monitoring, a more accurate quantification of phase formation is possible. The EBM process has been shown here to have the capabilities, if properly used, to engineer the mechanical properties of metal.
ACKNOWLEDGMENTS
At ORNL, Donald L. Erdman, Frank Medina, Tracie M. Lowe, Tom Geer, and Tyson L. Jordan assisted with the experimental work. Research sponsored by the U.S. Department of Energy, Office of Energy Efficiency and Renewable Energy, Advanced Manufacturing Office, under contract DE-AC05-00OR22725 with UT-Battelle, LLC. This research was also supported by fellowship funding received from the U.S. Department of Energy, Office of Nuclear Energy, Nuclear Energy University Programs. Additional support provided by the U.S. Assistant Secretary for Energy Efficiency and Renewable Energy, Advanced Manufacturing Office (Combined Heat and Power) and by the Center for Nanophase Materials Sciences (CNMS), which is sponsored by the Scientific User Facilities Division, Office of Basic Energy Sciences, U.S. Department of Energy. Research is also sponsored by Laboratory Directed Research and Development (LDRD) Programs at Oak Ridge National Laboratory (ORNL). Notice: This manuscript has been authored by UT-Battelle, LLC, under Contract No. DE-AC05-00OR22725 with the U.S. Department of Energy. The United States Government retains and the publisher, by accepting the article for publication, acknowledges that the United States Government retains a nonexclusive, paid-up, irrevocable, world-wide license to publish or reproduce the published form of this manuscript, or allow others to do so, for United States Government purposes.