Introduction
During recent years, the use of molecular markers for detecting polymorphisms at DNA level has been playing an increasing role in animal genetics studies.
The aim of this study was to develop an assay, to be inserted in a context of traceability in beef processing, for sustaining high quality of products in order to be competitive in the market. One of the problems that high-quality meat producers have to deal with constantly is the identification and protection of their products from competitors who utilize lower quality products of non-specialized breed derivatives.
For this purpose, three different known methods for allelic discrimination studies were compared, in order to identify the most rapid tool to verify the presence of a point mutation in the Myostatin (MSTN) gene in meat samples of Piedmontese cattle breed.
Piedmontese is a typical Italian beef breed known as a ‘double-muscled’ breed because of the particular hypertrophism of muscle mass. The ‘double-muscled’ trait, which is also present in other economically important beef breeds, is controlled by the MSTN gene; it codes for a growth factor involved in the muscle development: the Myostatin protein, a negative regulator of myogenesis (Lee and McPherron, Reference Lee and McPherron2001). This beef breed is also characterized by a pronounced aptitude in producing meat of excellent quality due to a specific mutation in the MSTN gene, that differs from those described in other double-muscled breeds (Grobet et al., Reference Grobet, Martin, Poncelet, Pirottin, Brouwers, Riquet, Schoeberlein, Dunner, Ménissier, Massabanda, Fries, Hanset and Georges1997; McPherron and Lee, Reference McPherron and Lee1997; Fahrenkrug et al., Reference Fahrenkrug, Casas, Keele and Smith1999), consisting of a point mutation at nucleotide 938, with a G to A transition (C313Y) located on the third exon of the MSTN gene, which is on Chromosome 2 (Kambadur et al., Reference Kambadur, Sharma, Smith and Bass1997).
A number of genotyping methods have been described in the literature for detection of several known MSTN gene mutations (Antoniou and Grosz, Reference Antoniou and Grosz1999).
The first method tested in this work was a fluorescent PCR-based assay, and represents the most widely used method due to its practical use, consisting of a simple PCR followed by a denaturing gel electrophoresis, for allele size determination (Fahrenkrug et al., Reference Fahrenkrug, Casas, Keele and Smith1999).
The SNaPshot methodology, by single nucleotide primer extension, was the second method that was tested and required a PCR amplification of the gene region of interest, followed by thermal cycling with an unlabeled primer that anneals to the PCR product template immediately 5′ to the position of interest on the template. The reaction contains only dideoxynucleotide triphosphate (ddNTP) terminators so that during thermal cycling, the DNA polymerase can extend the primers by only one base (ddNTP), which is complementary to the template strand, at the site of interest. In this case, the primer is extended by a fluorescently labeled ddNTP terminator so that the products can be separated and detected by electrophoresis.
The last method tested was a real-time PCR assay that differs from classical approaches in the use of fluorescent probes. In fact, the identification of the single nucleotide polymorphism (SNP) is performed by using two labeled probes, in addition to two primers, that are fully complementary to two possible nucleotides (Capoferri et al., Reference Capoferri, Bongioni, Galli and Aleandri2006), all in a single step.
Material and methods
Animals and samples
A total of 104 meat samples, declared to be of Piedmontese breed, were collected in butcher’s shops of an association named ‘Consorzio di tutela della Razza Piemontese’ (COALVI), whose aim is to guarantee meat quality certification.
As controls, 20 DNA samples, collected earlier from a population of bulls registered in the Herd Book of Piedmontese breed, were used. Another 20 DNA samples were collected from conventional phenotype animals (not double-muscled) registered in the Herd Book of Holstein Friesian breed. The DNA samples came from the ‘Istituto Spallanzani’ DNA bank and were stored in liquid nitrogen. The modality of the sampling ensured to collect control samples with the following known genotypes: mutated homozygous (mh/mh), heterozygous (mh/+) and wild type (+/+).
DNA extraction
Genomic DNA was extracted from 40 mg of frozen muscle tissue by a laboratory modification of the manufacturer’s protocol of the GENOMIX Extraction Kit (Talent, Trieste, Italy). After thawing, the samples were washed and resuspended in cold phosphate buffered saline. Two lyses steps were carried out using a specific ‘Lysing Solution’ and proteinase K, at two different temperatures and times: 45°C in oven shaker to dissolve the samples completely, followed by 30 min incubation at 68°C in thermoblock.
The aqueous phase containing the DNA was separated by 5 min centrifugation at 15 000 × g in chloroform. The DNA recovered was collected the first time by 15 min centrifugation at 8500 × g in a ‘precipitation solution’ and the second time by centrifugation at 8500 × g for 10 min with an ‘ionic exchange solution’ and 100% ethanol.
The DNA samples were washed with 70% ethanol, dried under vacuum and finally resuspended in a volume of 1× Tris–EDTA buffer (10 mmol Tris–HCl, 1 mmol EDTA) to a final concentration of about 20 ng/μl. At the end of the extraction, the DNA concentration was detected by GeneQuant II spectrophotometer (Pharmacia Biotech, Cambridge, UK).
Fluorescent PCR
The 104 meat samples of Piedmontese breed were analyzed by a classical approach using the methodology based on fluorescent PCR, described by Fahrenkrug et al. (Reference Fahrenkrug, Casas, Keele and Smith1999), with minor modifications.
Briefly, the genomic DNA was amplified by an allele-specific PCR assay using two primers specific for the two alleles, mutated and wild type, labeled with the fluorochrome 6-FAM and HEX, respectively, with the following sequences: primer forward mutated 5′AAG GCC AAT TAC TGC TCT GGA GAA CA 3′ corresponded to position 913 to 938, primer forward wild type 5′GCC AAT TAC TGC TCT GGA GAA CG 3′ corresponded to position 916 to 938, and one unlabeled primer (reverse) common to both the alleles 5′GGG GCC GGC TGA ACC TCT 3′ corresponded to position 997 to 975.
In order to be more specific, the primers were designed to have allele-specific bases at their 3′, and included a mismatch at the penultimate base.
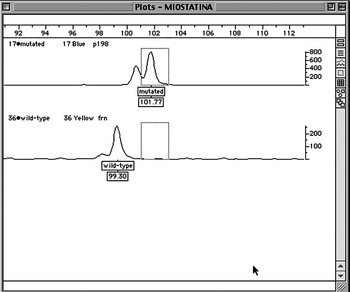
After dilution, the PCR products were separated on a 5% LongRanger™ gel (BIOSPA, Milan, Italy) by electrophoresis, using the AB377 Sequencer (Applied Biosystems, Foster City, CA, USA). The length and the emission spectra of the PCR products were dependent on the genotype of the animal. The data analysis was performed by Genotyper software (Applied Biosystems) and two types of fragments were expected: single fragments of 99 bp for the wild type genotype, single fragments of 102 bp for the mutated genotype (Figure 1) and both the fragments for the heterozygote genotype.
Genotyper software analysis. The figure represents the plot image of the fragments expected, respectively, for the mutated and the wild-type genotype, for the C313Y point mutation in the Myostatin gene.

SNaPshot
A 101 bp region of the MSTN gene, containing the point mutation, was amplified by PCR using the same primers utilized for fluorescent PCR described by Fahrenkrug et al. (Reference Fahrenkrug, Casas, Keele and Smith1999), with the exception that they were not labeled. PCR mixes consisted of 1× PCR buffer containing 1.5 mmol MgCl2 (Applied Biosystems), 30 μM of each deoxyribonucleotide triphosphate (dNTP), 0.5 μM of each primer, 0.5 Unit AmpliTaq Gold (Applied Biosystems) and 20 ng of genomic DNA template in a final reaction volume of 10 μl. The PCR was performed in GeneAmp 9700 PCR System (Applied Biosystems) under the following conditions: 10 min at 95°C, 30 cycles of 1 min at 94°C, 30 s at 68°C, 1 min at 72°C and 4 min at 72°C for the final extension.
The amplification product was purified by QIAquick PCR Purification Kit (QIAGEN GmbH, Hilden, Germany) to remove dNTPs and primers.
For single nucleotide primer extension, 5 μl of SNaPshot Reaction Mix (Applied Biosystems), 3 μl PCR product and 0.2 μmol/l of primer in a 10 μl final reaction volume were used. The SNaPshot primer was 5′GGC CAA TTA CTG CTC TGG AGA AT 3′, with a 23-base length, that with the addition of either the wild-type (G, blue signal) or mutant (A, green signal) base, migrates at 24 bases during electrophoresis. Reactions were subjected to 25 cycles: 10 s at 96°C, 5 s at 50°C and 30 s at 60°C. To remove the unincorporated ddNTPs, 0.3 μl of calf intestinal phosphatase (CIP) was then added to each reaction and incubated at 37°C for 1 h, followed by heat inactivation at 75°C for 15 min.
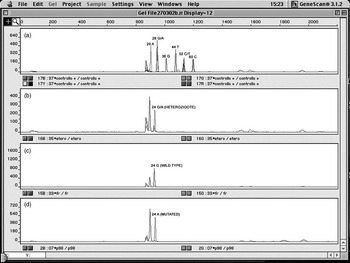
The extended products were separated by 5% LongRanger™ gel (BIOSPA) on 377 DNA sequencer (Applied Biosystems) and the results were analyzed using GeneScan software (Applied Biosystems). The plots obtained are shown in Figure 2.
SNaPshot genotyping. Examples of SNaPshot results: (a) control primers electropherogram results, (b) heterozygous result (mh/+) showing a peak (G) and a peak (A) at 24 bases resulting from extension of the primer, (c) wild-type result (+/+) showing a peak (G) and (d) mutated result (mh/mh) showing a peak (A).

Real-time PCR by minor groove-binder probes
Primers and probes were designed using Primer Express 2.0 software (Applied Biosystems) on the Bovine MSTN gene sequence (GenBank accession no. AF019620), according to the parameters required for real-time PCR applications.
The primer pairs were designed flanking the mutation site on exon 3 of the MSTN gene common for the two phenotypes, wild type and mutated. Two minor groove-binder (MGB) probes, one specific for the mutated allele (MUT) and the other specific for the wild-type allele (WT), were designed with the mutation site in the middle of the nucleotide sequence and were labeled by 6-FAM fluorochrome. The sequences of primers and probes are shown in Table 1.
Primers and probes sequences for the Myostatin mutation (underlined) in the Piedmontese cattle breed

WT = wild-type allele; MUT = mutated allele.
The region of genomic DNA containing the mutation was amplified in a PCR reaction volume of 25 μl under the following conditions: 20 ng of genomic DNA, 12.5 μl of 2× TaqMan Universal PCR Master Mix (Applied Biosystems), 200 nM of specific probe and 300 nM of each primer.
The samples were processed by GeneAmp 5700 SDS instrument (Applied Biosystems). After two initial steps consisting of 2 min at 50°C and 10 min at 95°C, the samples were amplified by 40 cycles of 15 s at 95°C and 1 min at 60°C.
Each sample was divided into two aliquots and analyzed differently with wild type and mutated probe.
During the PCR amplification, if a target sequence was present, the specific probe annealed to the template between the two primers. Afterwards, the reporter dye was cleaved by the 5′ nuclease activity of the Taq polymerase, causing an increase of fluorescence intensity. The increase in signal was collected and analyzed by the SDS software during the process. At the end of amplification, different values of fluorescence intensity (Rn) were obtained for each sample.
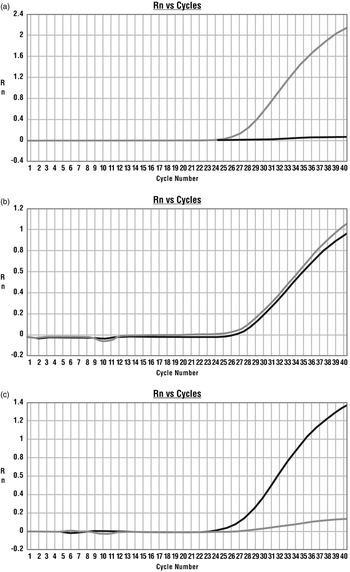
The genotype of each meat sample was determined using endpoint fluorescence measurements, defined as ΔRn, by comparing both signals derived from the two relative aliquots; substantial increase of fluorescence in WT probe (Figure 3a) or MUT probe (Figure 3c), indicated homozygosity for WT (+) or MUT (mh) specific allele, while an increase in both the signals (Figure 3b) indicated heterozygosity (mh/+).
Real-time PCR results: (a) amplification plot of homozygous wild-type (+/+) sample (gray line) amplified by real-time PCR using the wild-type probe and the mutated probe, (b) amplification plot of heterozygous (mh/+) sample amplified by real-time PCR using the wild-type probe and the mutated probe, and (c) amplification plot of homozygous mutated (mh/mh) sample (black line) amplified by real-time PCR using the wild-type probe and the mutated probe.

Results and discussion
Application of the three methods produced consistent results among the 104 meat samples analyzed in this work: 98 samples resulted to be homozygous for the mutation (mh/mh), five samples resulted to be heterozygous (mh/+) and one sample was found to be homozygous wild type (+/+). Results of the control analyses, performed with the three methods, confirmed the genotypes expected for all the samples.
Different techniques, such as PCR restriction fragment length polymorphism (RFLP), single strand conformational polymorphism (SSCP), oligonucleotide ligation assay (OLA) and fluorescent primer-based PCR assay, are described in the literature for the identification of mutations in MSTN gene (Dunner et al., Reference Dunner, Miranda, Amigues, Cañon, Georges, Hanset, Williams and Ménissier2003). However, most of these techniques require several procedural steps involving handling operations, running time for sample processing and risks of laboratory errors.
Concerning the three methods used in this study, considerable differences in the time required for samples preparation were found. In particular, the SNaPshot assay required about 5 h to obtain the results, while it took 3 h with the fluorescent PCR and only 2 h with real-time PCR.
In general, the genotype assessment by GeneScan, for the SNaPshot, is influenced by several variables, such as sample quality, background and unspecific peaks, which can lead to misinterpretation of the results. In the classical PCR approach by labeled primers, the number of procedural steps is reduced. Nevertheless, one amplification step followed by an electrophoresis run is still necessary before the analyses of results can be performed by Genotyper software. Contrastingly, the real-time PCR allows the amplification and genotyping to be carried out in a single tube, leading to an important reduction both in the time required for the analyses and in the manipulation of samples. The MGB probes represent a generation of probes with a chemical structure that, stabilizing the probe–target complex, allows the use of shorter fluorogenic probes and also increases oligonucleotide melting temperature (T m), with a high level of mismatch discrimination.
In this work, the real-time PCR proved to be efficient to investigate the presence or absence of the mutation C313Y in the MSTN gene typical of the Piedmontese breed. In this breed, the presence of the mutation either in heterozygous or homozygous condition induces a detectable effect (Bellinge et al., Reference Bellinge, Liberles, Iaschi, O’Brien and Tay2005). In fact, as reported by Casas et al. (Reference Casas, Keele, Shackelford, Koohmaraie, Sonstegard, Smith, Kappes and Stone1998), animals inheriting a single copy of the mutant mh allele from a crossbred Piedmontese sire, show the same improving characteristics concerning meat production: higher proportion of lean meat and less connective tissue, which contributes to its tenderness as compared to animals receiving no copies of the mutant mh allele. Furthermore, this technique revealed to be effective in discriminating between homozygous and heterozygous double-muscled individuals allowing us to identify five samples heterozygous for the mutation (mh) and one sample homozygous for the wild type (+).
The molecular genetic approach, could benefit the muscle-based food industry, where, due to the sensible decrease in meat consumption registered during recent years, it is necessary to regain confidence of more demanding consumers, who ask for guarantees about quality and safety. In this context, real-time PCR would provide valid support for products of superior quality.
In this study, the Piedmontese breed was used as a model for the application of this assay. Similarly, this approach can be used for the identification of mutation in other economically important ‘double-muscled’ cattle breeds such as Belgian Blue and Charolais. Moreover, the use of a rapid DNA test for the identification of homozygous or heterozygous double-muscled individuals, at an early stage of life, could be very helpful for breeders to plan programmed mating.
Acknowledgements
The authors thank Dr Roberto Puglisi of the Istituto Sperimentale Italiano Lazzaro Spallanzani, for revising the paper and Dr Marco Bona of Associazione Nazionale Razza Piemontese Italiana (A.N.A.Bo.Ra.Pi.), for the collaboration.