





1. Introduction
Incentivizing behavior is a foundational principle of experimental economics. Providing sufficiently high monetary incentives that are linked to the outcome variable has been argued to eliminate other motivations that could bias behavior (Plott, Reference Plott1986; Smith, Reference Smith1982; Svorenčík & Maas, Reference Svorenčík and Maas2016). While scholars in other behavioral sciences have long advocated for critical reflection on the use of monetary incentives (seeHertwig & Ortmann, Reference Hertwig and Ortmann2001, for a relevant discussion), this perspective has only recently gained traction among economists. This is largely due to a recent series of preference-elicitation studies that report little or no difference between measures obtained under incentivized and non-incentivizedFootnote 1 conditions. For example, the meta-analysis by Matousek et al. (Reference Matousek, Havranek and Irsova2022) on time preferences concludes that “it does not matter systematically for the reported discount rates whether experiments use real or hypothetical rewards” (p. 320). Moreover, Brañas-Garza et al. (Reference Brañas-Garza, Jorrat, Espín and Sánchez2023) draw on cross-country studies with field and online experiments to demonstrate that time preferences under real and hypothetical monetary incentives are largely comparable. Similarly, Falk et al. (Reference Falk, Becker, Dohmen, Huffman and Sunde2023) validate a survey module that uses hypothetical monetary incentives, across several preference dimensions. They conclude that these hypothetical measures offer a good compromise and apply this module in one of the largest global preference studies to date (Falk et al., Reference Falk, Becker, Dohmen, Enke, Huffman and Sunde2018).
A common feature of preference-based choice tasks is that non-incentivized conditions link behavior to monetary rewards even though these are only hypothetical. For instance, Brañas-Garza et al. (Reference Brañas-Garza, Jorrat, Espín and Sánchez2023) elicit choices between smaller, sooner and larger, later hypothetical monetary rewards to measure participants’ time preferences. The use of such hypothetical incentives is less common in other behavioral tasks, where non-incentivized conditions typically make no mention of monetary rewards beyond the participation fee. Reviewing a wide range of behavioral tasks, Camerer and Hogarth (Reference Camerer and Hogarth1999) find that, unlike in preference-based choice tasks, real monetary incentives affect behavior more systematically in tasks involving judgment, learning, memory and recall, or real-effort provision. The disparity between these two types of non-incentivized conditions raises the question of whether linking behavior to hypothetical incentives differs from not mentioning any link to monetary rewards and how both compare to real ones.
Addressing this research question tests whether people can effectively internalize hypothetical incentives, treating them as motivationally similar to real ones – a potential explanation for the observed similarity between real and hypothetical incentives in preference-based choice tasks. To this end, we conduct two complementary studies using pre-registered real-effort experiments based on a decoding task (Sillamaa, Reference Sillamaa1999a). Real-effort tasks enable a clear comparison between settings in which performance is linked to monetary rewards and settings in which incentives are not mentioned. This comparison is not feasible in preference-based choice tasks where monetary outcomes must be specified by design. To the extent that preference-based choice tasks involve some degree of effort, we would expect to see some trace of this internalization ability in a standard real-effort task. Beyond testing this hypothesis, establishing whether hypothetical incentives can motivate effort has practical implications, potentially offering experimenters a cost-effective alternative to real monetary incentives across a broader range of behavioral tasks.
In Study 1 we compare effort provision across three conditions: real 10-pence piece-rate incentives (Real), hypothetical 10-pence piece-rate incentives (Hypothetical), and no mention of incentives (No-Incentives). In all three conditions, participants received a  $\unicode{x00A3} \,1$ participation fee that is not linked to their output. Hypothetical is identical to Real, except that participants are explicitly informed, and repeatedly reminded, that the piece rate for solving items is hypothetical and does not affect their final payment. We find that Hypothetical increases effort only marginally relative to No-Incentives, an increase that is not significant at the 5% level (Cohen’s
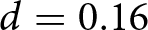 $d = 0.16$). Real, by contrast, generates substantially larger and statistically significant effects, relative to both No-Incentives (
 $d = 1.66$) and Hypothetical (
 $d = 1.41$).
While large effects are not uncommon when comparing performance-contingent pay to flat compensation, in a comparable design, DellaVigna and Pope (Reference DellaVigna and Pope2018) report Cohen’s d = 1.0, our effect is on the larger side. The magnitude replicates in Study 2, which finds even larger effects for Real (Cohen’s d = 2.3) and weaker effects for Hypothetical (Cohen’s d = 0.09).
In Study 2 we introduce four treatments that systematically vary base pay and piece-rate parameters across the three incentive conditions. The four additional treatments allow us to identify the following boundary conditions: First, even a ten-fold increase of the hypothetical piece rate has negligible impact. Second, substantially raising the base pay to £ 3.20, matching the average total compensation in Study 1’s Real, generates a modest but statistically significant increase in effort under No-Incentives. Third, this higher base pay increases responsiveness to Hypothetical: participants receiving £ 3.20 upfront with a £ 1.00 hypothetical piece rate solve significantly more items than their counterparts in No-Incentives with the same high base pay. Fourth, this high base pay hypothetical variant is substantially less cost-effective than the real condition. A real piece rate of only £ 0.01 under low base pay induces higher effort and requires only one-third of the total cost.
To decompose the treatment effects on real effort provision into interpretable parameters, we develop and estimate a structural model of costly effort. We build on DellaVigna and Pope (Reference DellaVigna and Pope2018)’s core framework of costly effort choice, in which individuals maximize utility from monetary piece rates and non-monetary motivation (such as gift-exchange reciprocity), minus a convex cost of effort. We extend this model by incorporating a parameter that captures how nominal piece-rates are internalized when they are hypothetical. The net effect of hypothetical piece-rates on optimal effort provision is the product of this parameter and the nominal piece-rate.
The structural estimates reveal that participants internalize hypothetical piece rates at just above 0.1% at the low base pay. This point estimate declines further when the hypothetical piece rate increases. Within our tested parameter range the net effect on effort remains positive, but this pattern implies a boundary condition: excessively high hypothetical piece rates could reduce net effort if internalization declines faster than the nominal piece rate increases. For example, a £ 1,000 hypothetical piece rate is likely dismissed as implausible, so internalization fails and further nominal increases backfire. Furthermore, the model-mediated analysis reveals two distinct channels through which raising the base pay increases effort. First, it increases non-pecuniary motivation substantially: participants reciprocate by providing additional effort in a way that is consistent with ‘gift exchange’ (DellaVigna & Pope, Reference DellaVigna and Pope2018; DellaVigna et al., Reference DellaVigna, List, Malmendier and Rao2022; Gneezy & List, Reference Gneezy and List2006). Second, it significantly increases participants’ responsiveness to hypothetical incentives. However, despite this increase, internalization remains very low, staying below 0.3%.
Both model-free and model-mediated analysis converge on the same conclusion: while linking effort to hypothetical incentives can generate some improvements over not referencing any incentives at all, this strategy remains a poor substitute for real monetary rewards. Although our primary evidence comes from a real-effort setting in which effort and performance are tightly linked, our exploratory analysis indicates why our conclusions extend more broadly. We find that in No-Incentives and Hypothetical, the share of participants who exert only minimal effort, i.e., solving no more than one item, is more than three times higher compared to Real. This concentration of minimal-effort responses suggests not merely low motivation but, as Rydval and Ortmann (Reference Rydval and Ortmann2004) observe in a related context, outright refusal to engage with the task. Furthermore, participants in both No-Incentives and Hypothetical conditions exhibit significantly higher error rates on a comprehension question which was administered after the introduction of incentives.Footnote 2 In contrast, error rates in the practice round for the decoding task, administered before participants learned their incentive condition, show no systematic differences. Returning to our initial motivation, these patterns provide little support for the hypothesis that participants efficiently internalize hypothetical incentives — even when the task requires only minimal effort. Therefore, the null effects between real and hypothetical incentives in preference-based choice tasks likely have a different explanation.
Although our main result clearly supports the use of real monetary incentives, in many experimental settings, e.g., medical decision-making tasks or high-stakes preference elicitation, implementing incentive-compatible payments is sometimes not possible. In these cases, our results offer practical guidance. Generous participation fees can partially substitute incentive compatible payments, producing more effortful, higher-quality responses even when the incentives related to the task must remain hypothetical.
2. Background on real-effort tasks
We investigate whether individuals internalize hypothetical monetary incentives as motivationally equivalent to real ones, using effort provision as our primary dependent variable. We focus on effort to address this fundamental question because insights related to effort extend beyond tasks explicitly designed to measure it. Even when experimental tasks are not explicitly designed to measure effort, ensuring high-quality data requires participants to engage meaningfully with the task – for example, by reading instructions carefully, considering trade-offs thoughtfully, and performing calculations accurately. This focus on effort is consistent with Smith (Reference Smith1982), who formalizes the principle that monetary incentives must dominate subjective costs, including the cognitive effort required for thinking, calculating, and acting, in order to ensure control over participant preferences.
Two primary methodological approaches dominate experimental research on effort provision: stated-effort and real-effort paradigms (see Carpenter & Huet-Vaughn, Reference Carpenter and Huet-Vaughn2019; Charness et al., Reference Charness, Gneezy and Henderson2018, for reviews). In stated-effort paradigms, participants report intended effort levels, with higher stated effort corresponding to greater monetary rewards but also to increased costs (often affecting other participants’ payoffs), as in gift-exchange (Fehr et al., Reference Fehr, Kirchsteiger and Riedl1993) or tournament (Nalbantian & Schotter, Reference Nalbantian and Schotter1997) settings. In real-effort paradigms, participants engage in tangible tasks with outcomes determined by actual performance. Carpenter and Huet-Vaughn (Reference Carpenter and Huet-Vaughn2019) classify real-effort tasks into motor tasks such as counting (Abeler et al., Reference Abeler, Falk, Goette and Huffman2011) or moving a slider (Gill & Prowse, Reference Gill and Prowse2012), and cognitively demanding tasks such as solving puzzles (Charness & Villeval, Reference Charness and Villeval2009) or arithmetic problems (Niederle & Vesterlund, Reference Niederle and Vesterlund2007).
We employ a real-effort paradigm based on a decoding task (e.g., Drobner & Orhun, Reference Drobner and Orhun2025; Lévy-Garboua et al., Reference Lévy-Garboua, Masclet and Montmarquette2009; Sillamaa, Reference Sillamaa1999a; Sillamaa, Reference Sillamaa1999b). Recent work by Dutcher et al. (Reference Dutcher, Salmon and Saral2024) demonstrates that stated-effort and real-effort paradigms can produce similar results when opportunity costs are properly controlled, underscoring that both approaches offer valuable insights for different research questions. Our choice of a real-effort paradigm reflects a specific design requirement: the need to create a clean comparison between conditions where incentives are not mentioned at all versus conditions where they are framed as hypothetical. Stated-effort paradigms and preference-based choice tasks inherently tie decisions to monetary outcomes – whether hypothetical or real – making this distinction not possible.
The remaining features of our experimental design are guided by prior literature examining how varying levels of incentives influence real effort provision. This literature reports mixed findings (Bonner et al., Reference Bonner, Hastie, Sprinkle and Young2000). Specifically, Erkal et al. (Reference Erkal, Gangadharan and Koh2018) and Dorner and Lancsar (Reference Dorner and Lancsar2023) summarize that some studies report no impact of monetary incentives on effort provision (e.g., Araujo et al., Reference Araujo, Carbone, Conell-Price, Dunietz, Jaroszewicz, Landsman, Lamé, Vesterlund, Wang and Wilson2016), others document a positive association (e.g., Abeler et al., Reference Abeler, Falk, Goette and Huffman2011; De Quidt et al., Reference De Quidt, Haushofer and Roth2018; DellaVigna & Pope, Reference DellaVigna and Pope2018; Goerg et al., Reference Goerg, Kube and Radbruch2019; Jenkins Jr et al., Reference Jenkins, Mitra, Gupta and Shaw1998), while a third group finds a non-monotonic relationship (e.g., Ariely et al., Reference Ariely, Gneezy, Loewenstein and Mazar2009; Gneezy & Rustichini, Reference Gneezy and Rustichini2000; Pokorny, Reference Pokorny2008).
Variation in piece-rate magnitude is a key moderator of this heterogeneity and central to our investigation. DellaVigna and Pope (Reference DellaVigna and Pope2018), for example, report Cohen’s  $d = 1.0$ when comparing a 10-cent piece rate to no incentives, and
 $d = 0.7$ for a 1-cent piece rate versus no incentives. Likewise, in Experiment 3 of De Quidt et al. (Reference De Quidt, Haushofer and Roth2018), real effort differs substantially across piece-rate levels: Cohen’s
 $d = 1.1$ when comparing a 4-cent piece rate to no incentives, and
 $d = 0.7$ for a 1-cent piece rate versus no incentives (pooling over demand treatments). We extend this work by systematically varying both piece-rate magnitudes and base pay levels across real, hypothetical, and no-incentive conditions. In doing so, we incorporate insights from prior literature identifying a range of additional moderators such as intrinsic motivation, skill, time pressure, and opportunity costs that affect effort provision.
First, we use a real-effort task with low intrinsic motivation. Tasks with high intrinsic motivation can confound the relationship between monetary incentives and effort through complex, often non-monotonic interactions – monetary rewards may crowd out intrinsic motivation, or intrinsic motivation may substitute for extrinsic incentives (Deci et al., Reference Deci, Koestner and Ryan1999). We chose the decoding task, which Carpenter and Huet-Vaughn (Reference Carpenter and Huet-Vaughn2019) characterize as having low intrinsic motivation. Second, the decoding task imposes minimal cognitive skill demands which have been shown to compete with incentives in effort provision tasks (Camerer & Hogarth, Reference Camerer and Hogarth1999; Rydval & Ortmann, Reference Rydval and Ortmann2004). Third, we impose no time constraints. Ariely et al. (Reference Ariely, Gneezy, Loewenstein and Mazar2009) report evidence consistent with backfiring due to choking under (time) pressure, finding that increasing incentives from low to very high decreased performance in some of their tasks. The generality of this pattern is, however, an open question: Enke et al. (Reference Enke, Gneezy, Hall, Martin, Nelidov, Offerman and Van De Ven2023) find that very high stakes do not reduce performance but increase response times across four cognitive-bias tasks. While our decoding task differs from both settings, we adopt a precautionary approach and remove time pressure, ensuring that choking through this channel cannot confound our comparisons. Fourth, we allow participants to stop working at any time, ensuring that opportunity costs translate into credible outside options. Without such options, effort responds weakly to incentives: Dutcher et al. (Reference Dutcher, Salmon and Saral2024) report Cohen’s  $d = 0.8$ with an outside option versus
 $d = 0.3$ without; Goerg et al. (Reference Goerg, Kube and Radbruch2019) find a similar pattern (
 $d = 0.7$ vs.
 $d = 0.1$). This point is further supported by Erkal et al. (Reference Erkal, Gangadharan and Koh2018), Eckartz (Reference Eckartz2014), and Corgnet et al. (Reference Corgnet, Hernán-González and Schniter2015).
We close this section with two important clarifications. First, the experimental design choices discussed above follow insights from prior literature to maximize participants’ responsiveness to incentive variation. These choices do not, however, guarantee elimination of moderating factors, nor is elimination our goal. For example, though we selected the decoding task for its low intrinsic motivation, Dorner and Lancsar (Reference Dorner and Lancsar2023) use a similar task and find evidence of intrinsic motivation. Nonetheless, our treatment comparisons are designed such that moderating factors remain constant across the conditions being compared, securing causal identification. Second, we do not explicitly measure the extent to which moderators such as opportunity costs (Dutcher et al., Reference Dutcher, Salmon and Saral2024) or intrinsic motivation (Dorner & Lancsar, Reference Dorner and Lancsar2023) are present in our setting. Measuring these factors and investigating heterogeneity in effort responses across our three incentive conditions would be an interesting extension for future research.
3. Methods
This section describes the experimental design and the structural modeling approach used to investigate participants’ effort provision under different incentive schemes. Section 3.1 outlines the main experimental task and explains how effort was measured, followed by a description of the treatment conditions that varied the type and size of incentives participants received. We then detail the participant recruitment, randomization, and procedural aspects of our investigation. Section 3.2 introduces our structural model of costly effort, which extends DellaVigna and Pope (Reference DellaVigna and Pope2018) to incorporate responsiveness to hypothetical incentives, and describes the estimation protocol used to recover the structural parameters.
3.1. Experimental design
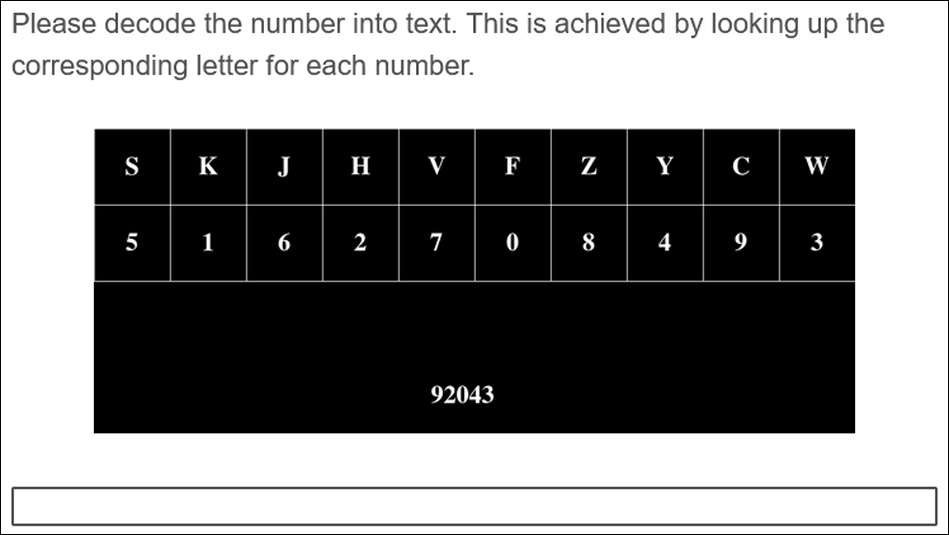
We develop an experimental design to test how effort provision responds to real monetary incentives, hypothetical monetary incentives, and no mention of monetary incentives. The primary outcome variable in our study is the number of correctly solved items in a decoding task, which we use as a proxy for effort  $e$. Participants could complete up to 25 decoding items. Each item required translating a five-digit number into text using a provided decoding key, as illustrated in Figure 1. Participants faced no time constraint. All participants were required to complete the first item. After each subsequent item, participants decided whether to continue or stop.Footnote 3 Before learning about their specific incentive condition, participants completed a practice round of the decoding task. Besides the number of correctly solved decoding items, our experimental design also tracks the number of attempted decoding items and time spent on the decoding task. This allows us to consider alternative measures of effort as robustness checks (see Appendix A.3).
Sample item of decoding task

We employed a between-subjects design in which participants were assigned to one of seven treatments. Across all treatments, the base pay is a real participation fee that is always paid out. Treatments differ in (i) the magnitude of the base pay, (ii) the magnitude of the piece-rate incentive, and (iii) whether the piece-rate incentive is real or hypothetical. The seven treatments comprise three categories based on incentive type. In Real treatments, participants received a base pay and a piece-rate bonus per correctly solved item that was paid out. In Hypothetical treatments, participants received a base pay and a piece-rate bonus per correctly solved item, but were informed this piece-rate bonus was hypothetical and would not be paid out. In No-Incentives treatments, participants received only a base pay with no mention of bonus payments for solving the decoding task. To mitigate potential selection effects stemming from differences in base payments across treatments, the study was advertised with a uniform participation fee of £ 1. Participants in treatments with higher base payments were informed of the higher amount during the experiment. Table 1 provides excerpts from the instructions that highlight the treatment differences. Complete experimental instructions are provided in Appendix B.
Summary of treatments

Table 1 Long description
Payment conditions are listed by Category, Treatment, Base Pay, Piece Rate, and Description. Under No-Incentives, No-B100 has base pay pound 1.00 and no piece rate, and No-B320 has base pay pound 3.20 and no piece rate; only No-B100 includes a description stating there is no bonus for decoding tasks. Under Hypothetical, Hyp-B100-P10 has base pay pound 1.00 and piece rate pound 0.10, Hyp-B100-P100 has base pay pound 1.00 and piece rate pound 1.00, and Hyp-B320-P100 has base pay pound 3.20 and piece rate pound 1.00; only Hyp-B100-P10 includes a description stating the per task bonus is hypothetical and not credited to a Prolific account. Under Real, Real-B100-P1 has base pay pound 1.00 and piece rate pound 0.01, and Real-B100-P10 has base pay pound 1.00 and piece rate pound 0.10; only Real-B100-P1 includes a description stating the per task bonus is credited to a Prolific account. Across categories, base pay appears at two levels, pound 1.00 and pound 3.20, while piece rates appear as none, pound 0.01, pound 0.10, and pound 1.00.
Note: Treatments indicate payment conditions, where “B” denotes the base pay amount and “P” denotes the piece rate.
To ensure that participants fully understood the incentive scheme specific to their treatment, we incorporated two design features. First, before beginning the task, participants were required to correctly answer a comprehension-check question about both the incentive structure and the nature of the task. Second, after submitting an answer to each item in the decoding task, they were reminded of their incentive scheme before deciding whether to continue.
We collected data for the seven treatments in two pre-registered studies on Prolific, using a sample from the UK. Data were collected in three waves and subjects were randomly assigned to one of the treatments included in the respective wave. The distribution of participants’ demographic characteristics is presented in Appendix A.1 and shows that the experimental treatment groups are well balanced. Study 1 was carried out in wave 1 that took place in August 2024. It included the treatments No-B100, Hyp-B100-P10, and Real-B100-P10 (pre-registration). Study 2 was carried out in two waves. Wave 1 took place in August 2025. It included a direct replication of the treatments of Study 1 and additionally introduced the treatments No-B320 and Hyp-B100-P100 (pre-registration). Wave 2 took place two weeks later. There, we collected data for two additional treatments, Hyp-B320-P100 and Real-B100-P1 (pre-registration). We recruited approximately 300 participants in each treatment within each study, yielding a total sample size of 901 participants in Study 1 and 2,116 participants in Study 2.
3.2. Structural model
We extend the model of costly effort from DellaVigna and Pope (Reference DellaVigna and Pope2018) to incorporate responsiveness to hypothetical incentives. Individuals choose effort level  $e$ to maximize utility net of effort costs. For each unit of effort, individuals receive utility from a monetary piece rate
 $p$ as well as a non-monetary component
 $s \gt 0$. The former represents standard performance incentives, while the latter captures intrinsic motivation, sense of duty, or gratitude for the participation fee.
We assume a convex cost of effort function  $c(e)$ with
 $c'(e) \gt 0$ and
 $c''(e) \gt 0$ for all
 $e \gt 0$. Individuals solve:
 \begin{equation}
\max_{e\geq0} \quad (s+p)e-c(e).
\end{equation}
We adopt the power cost function  $c(e)=k e^{1+\gamma}/(1+\gamma)$, which features a constant elasticity of effort
 $1/\gamma$ with respect to the marginal benefit of effort. This yields the first-order condition:
 \begin{equation}
c'(e) = ke^{\gamma} = s+p,
\end{equation}
with optimal effort:
 \begin{equation}
e^* = \left(\frac{s+p}{k}\right)^{1/\gamma}.
\end{equation}
We extend this framework to allow for partial internalization of hypothetical incentives, i.e., the extent to which participants treat hypothetical rewards as motivating real effort. Let  $I_{\text{Hyp}}$ and
 $I_{\text{Real}}$ denote indicator variables for hypothetical and real incentive treatments, respectively. The extended first-order condition becomes:
 \begin{equation}
c'(e) = ke^{\gamma} = s + \beta \cdot p \cdot I_{\text{Hyp}} + p \cdot I_{\text{Real}}.
\end{equation}
The parameter  $\beta$ captures the efficiency of hypothetical incentives relative to real incentives. We impose no restrictions on
 $\beta$ during estimation: values in
 $[0,1]$ indicate partial internalization (with
 $\beta=0$ representing complete disregard and
 $\beta=1$ representing full equivalence with real incentives), while
 $\beta \gt 1$ would indicate hypothetical incentives are more effective than real ones, and
 $\beta \lt 0$ would indicate a backfiring effect where hypothetical rewards reduce effort below baseline.
When  $I_{\text{Hyp}}=0$, equation (4) reduces to the standard model. When
 $I_{\text{Hyp}}=1$, the hypothetical piece rate contributes
 $\beta p$ to the marginal benefit, allowing us to estimate the efficiency of hypothetical incentives.
Following DellaVigna and Pope (Reference DellaVigna and Pope2018), we recover the structural parameters  $(k, \gamma, s)$ using average observed effort
 $\bar{e}$ in three treatments with varying real piece rates but equal participation fee (£ 1.00): No-B100 (
 $p=0$), Real-B100-P1 (
 $p=0.01$), and Real-B100-P10 (
 $p=0.10$). From equation (4) with
 $I_{\text{Hyp}}=0$ and
 $I_{\text{Real}}=1$, these three moments exactly identify the structural parameters via the first-order condition
 $ke^{\gamma} = s + p$. Given convexity, this system has a unique solution, which we solve numerically. We denote the baseline non-pecuniary motivation as
 $s_L$ to distinguish it from the elevated motivation
 $s_H$ under high participation fees, yielding estimates
 $(\hat{k}, \hat{\gamma}, \hat{s}_L)$. Confidence intervals for all structural parameters are derived via bootstrap with 1,000 draws, resampling participants within each treatment.
Given the core parameter estimates, we calculate the responsiveness to hypothetical incentives and the effect of increased participation fees. Rearranging equation (4) under hypothetical incentives ( $I_{\text{Hyp}}=1$,
 $I_{\text{Real}}=0$) yields
 $\beta = (ke^{\gamma} - s)/p$. For treatments with low participation fee (£ 1.00), we substitute the core estimates
 $(\hat{k}, \hat{\gamma}, \hat{s}_L)$ and
 $\bar{e}$ from Hyp-B100-P10 (piece rate £ 0.10) and Hyp-B100-P100 (piece rate £ 1.00) to recover
 $\hat{\beta}_{LL}$ and
 $\hat{\beta}_{LH}$.Footnote 4 We impose no restrictions on
 $\beta$, allowing for values below zero (backfiring effects) or above one (hypothetical incentives more effective than real).
Next, we isolate the effect of increasing the participation fee from £ 1.00 to £ 3.20 using No-B320, which features the higher participation fee but no piece rate. With  $p=0$, equation (4) simplifies to
 $s_H = ke^{\gamma}$. Using the core parameter estimates
 $(\hat{k},\hat{\gamma})$ and
 $\bar{e}$ from No-B320, we recover
 $\hat{s}_H$. Following DellaVigna and Pope (Reference DellaVigna and Pope2018), we interpret the increase
 $\Delta s = s_H - s_L$ as a gift-exchange effect: participants reciprocate the (unexpected) participation fee increase through higher effort.
Finally, for Hyp-B320-P100, which combines high participation fee (£ 3.20) and high hypothetical piece rate (£ 1.00), we rearrange equation (4) to yield  $\beta = (ke^{\gamma} - s)/p$. We substitute the core estimates
 $(\hat{k},\hat{\gamma})$, the higher motivation parameter
 $\hat{s}_H$, and
 $\bar{e}$ from Hyp-B320-P100 to recover
 $\hat{\beta}_{HH}$. This allows us to test whether higher non-pecuniary motivation enhances responsiveness to hypothetical incentives.
4. Results
We organize the results into two parts. In Section 4.1, we report all pre-registered treatment comparisons and additional exploratory analyses, without imposing any theoretical framework.Footnote 5 In Section 4.2, we present the structural estimation results from our model of costly effort.
4.1. Treatment Effects
Figure 2 presents decoding scores, i.e., the number of correctly solved items, across all treatments.Footnote 6 Bars display mean scores with their 95% confidence intervals from Study 2. Individual observations are overlaid as semi-transparent points to show the underlying distributions; diamonds indicate Study 1 means.
Decoding scores by treatment

Fig. 2 Long description
The bar graph has the title text, NO INCENTIVES, HYPOTHETICAL and REAL. The horizontal axis label is, Treatment. The vertical axis label is, Decoding Score. The vertical axis shows labeled ticks at 0, 5, 10, 15, 20 and 25. There are seven vertical bars with overlaid points and a diamond marker on each bar. Under NO INCENTIVES, the treatments are, No dash B100 and No dash B320. Under HYPOTHETICAL, the treatments are, Hyp dash B100 dash P10, Hyp dash B100 dash P100 and Hyp dash B320 dash P100. Under REAL, the treatments are, Real dash B100 dash P1 and Real dash B100 dash P10. Bar heights by treatment, read against the vertical axis ticks: No dash B100 is slightly above 5. No dash B320 is slightly below 10. Hyp dash B100 dash P10 is around 7. Hyp dash B100 dash P100 is around 8. Hyp dash B320 dash P100 is around 12. Real dash B100 dash P1 is around 14. Real dash P100 dash P10 is around 22. Each bar includes an error bar with caps near the top of the bar. Each bar also has many small circular points spread vertically from near 0 up to near 25 and a diamond marker positioned above the bar top.
Unless stated otherwise, reported  $p$-values derive from two-sided Wilcoxon rank-sum tests. In Study 1, real incentives generate substantially higher effort: participants in Real-B100-P10 solve 21.8 items on average, compared to 8.6 in No-B100 and 10.1 in Hyp-B100-P10, more than doubling output in both cases (Cohen’s
 $d = 1.66$ and
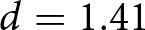 $d = 1.41$; both
 $p \lt 0.001$). Hypothetical incentives yield a small increase over the no-incentives baseline (
 $d = 0.16$,
 $p = 0.091$), significant only at the 10% level.
In Study 2, we replicate these findings and introduce four additional treatments. Participants in Real-B100-P10 again achieve the highest decoding scores, more than tripling output relative to No-B100 (21.8 vs. 6.3; Cohen’s  $d = 2.30$) and Hyp-B100-P10 (21.8 vs. 7.0; Cohen’s
 $d = 2.09$; both
 $p \lt 0.001$). Hypothetical incentives again yield minimal effects: scores in Hyp-B100-P10 exceed No-B100 by only 0.7 items (Cohen’s
 $d = 0.09$,
 $p = 0.747$), an effect smaller than in Study 1 and not significant even at the 10% level.
Next, we test whether effort in non-incentivized conditions can be increased by raising hypothetical piece rates, raising base pay, or combining both. Raising the hypothetical piece rate tenfold from £ 0.10 to £ 1.00 produces minimal change: Hyp-B100-P100 yields 7.8 items versus 7.0 in Hyp-B100-P10 (Cohen’s  $d = 0.10$,
 $p = 0.256$). Increasing base pay alone from £ 1.00 to £ 3.20 modestly increases effort: No-B320 yields 9.6 items versus 6.3 in No-B100 (Cohen’s
 $d = 0.39$,
 $p \lt 0.001$). The best-performing hypothetical condition combines high base pay with high piece rates: Hyp-B320-P100 yields 11.7 items versus 9.6 in No-B320 (Cohen’s
 $d = 0.23$,
 $p = 0.005$). Yet in an exploratory analysis we find that even this combination underperforms a real £ 0.01 piece rate at a fraction of the cost: Real-B100-P1 yields 13.9 items at an average total cost of approximately £ 1.14 per participant, versus 11.7 items at £ 3.20 in Hyp-B320-P100, though this difference is significant only at the 10% level (Cohen’s
 $d = 0.22$,
 $p = 0.053$).
Although Study 2 confirms Study 1’s core finding, that real monetary incentives elicit two to three times more effort than any other condition, performance in No-B100 and Hyp-B100-P10 declined between Study 1 (August 2024) and Study 2 (August 2025), whereas Real-B100-P10 remained remarkably stable (Figure 2). This divergence accounts for the larger treatment effects observed in Study 2 compared to Study 1.
Looking at the distribution of individual observations in Figure 2 reveals further differences across treatment categories. In No-Incentives and Hypothetical conditions, nearly one-third of participants solve at most one item (29.4% and 31.2% respectively), compared to only 9.6% in Real ( $\chi^2$-test vs. Real: both
 $p \lt 0.001$). The pattern reverses at maximum effort: 56.3% of Real participants solve at least 24 items, compared to 16.1% and 19.8% in No-Incentives and Hypothetical (
 $\chi^2$-test vs. Real: both
 $p \lt 0.001$).
Before proceeding to the decoding task, participants were required to (a) solve a practice decoding item and (b) correctly answer a comprehension check question. Error rates in the practice round for the decoding task, administered before participants learned their incentive condition, show no systematic differences: 5.3% in No-Incentives, 5.1% in Hypothetical, and 5.3% in Real (all pairwise  $p \gt 0.46$).
In contrast, error rates in the comprehension check question, administered after participants learned their incentive condition, vary significantly across treatment categories 33.4% in No-Incentives, 28.7% in Hypothetical, and 18.6% in Real ( $\chi^2$-test:
 $p \lt 0.001$ for Real vs. both other categories; Hypothetical vs. No-Incentives,
 $p = 0.052$).Footnote 7 In Appendix A.4.2, we unpack the comprehension check error rates by treatment and by incentive-related versus task-related items. The analysis shows that the effect is largely driven by errors on incentive-related items: 29.3% in No-Incentives, 22.7% in Hypothetical, and 11.6% in Real (
 $\chi^2$-test:
 $p \lt 0.001$ for Real vs. both other categories; Hypothetical vs. No-Incentives,
 $p = 0.004$).
4.2. Structural estimation
Table 2 presents the structural parameter estimates. The cost function exhibits moderate curvature ( $\hat{\gamma} = 5.06$), yielding an elasticity of effort with respect to the piece rate of approximately
 $1/\hat{\gamma} = 0.20$. A tenfold increase in piece rates thus raises effort by approximately 58.5% (
 $10^{0.20} = 1.585$), consistent with the observed increase when raising the real piece rate from £ 0.01 to £ 0.10 under low base pay. This remains well below the proportional response that would occur under linear costs. However, the elasticity in our decoding task is notably higher than DellaVigna and Pope (Reference DellaVigna and Pope2018)’s estimate of
 $1/\gamma = 0.03$ in a button-pressing task, where a tenfold piece-rate increase raised effort by less than 10%.
Structural parameter estimates

Table 2 Long description
Structural parameter estimates are reported with columns for, Estimate, and, 95 percent CI, grouped into cost function parameters, non pecuniary motivation, and responsiveness to hypothetical incentives. Cost function parameters list curvature, gamma, at 5.06 with a 95 percent CI from 4.10 to 6.25, and level, k, at 1.65 times 10 to the minus 8 with a 95 percent CI from 4.59 times 10 to the minus 10 to 3.10 times 10 to the minus 7. Non pecuniary motivation lists s sub L at 1.80 times 10 to the minus 4 with a 95 percent CI from 3.43 times 10 to the minus 5 to 6.98 times 10 to the minus 4, and s sub H at 1.52 times 10 to the minus 3 with a 95 percent CI from 4.65 times 10 to the minus 4 to 3.86 times 10 to the minus 3. The difference between s sub H and s sub L is 1.34 times 10 to the minus 3 and has no 95 percent CI shown. Responsiveness to hypothetical incentives lists beta sub L L at 1.26 times 10 to the minus 3 with a 95 percent CI from minus 1.01 times 10 to the minus 3 to 5.05 times 10 to the minus 3, beta sub L H at 3.81 times 10 to the minus 4 with a 95 percent CI from 3.68 times 10 to the minus 5 to 1.20 times 10 to the minus 3, and beta sub H H at 2.77 times 10 to the minus 3 with a 95 percent CI from 6.37 times 10 to the minus 4 to 6.24 times 10 to the minus 3.
Notes: Cost function parameter estimates  $\hat{k}$,
 $\hat{\gamma}$, and non-pecuniary motivation estimate
 $\hat{s}_L$ recovered from three moments – average effort in No-B100, Real-B100-P1, and Real-B100-P10 – under a power cost function.
 $\hat{s}_H$ calculated from treatment mean No-B320 using
 $\hat{k}$ and
 $\hat{\gamma}$.
 $\hat{\beta}_{LL}$ and
 $\hat{\beta}_{LH}$ calculated from treatment means Hyp-B100-P10 and Hyp-B100-P100 using
 $\hat{k}$,
 $\hat{\gamma}$, and
 $\hat{s}_L$.
 $\hat{\beta}_{HH}$ calculated from treatment mean Hyp-B320-P100 using
 $\hat{k}$,
 $\hat{\gamma}$, and
 $\hat{s}_H$. Confidence intervals derived via bootstrap with 1,000 draws, then taking 2.5th and 97.5th percentiles.
 $\Delta \hat{s}$ computed from point estimates.
At low base pay and a £ 0.10 hypothetical piece rate, participants internalize approximately 0.13% of the nominal incentive ( $\hat{\beta}_{LL}$). Increasing the hypothetical piece rate to £ 1.00 reduces the point estimate of this rate to roughly one-third, approximately 0.04% (
 $\hat{\beta}_{LH}$). However, the confidence interval for
 $\hat{\beta}_{LL}$ includes zero while that for
 $\hat{\beta}_{LH}$ does not, indicating greater variance in responses to the lower hypothetical piece rate. Because the tenfold increase in
 $p$ outweighs the threefold decline in
 $\beta$, the product
 $\beta \cdot p$ still increases, so higher hypothetical piece rates raise effort within our tested range of
 $p$.
Increasing base pay from £ 1.00 to £ 3.20 raises non-pecuniary motivation from  $\hat{s}_L = 1.80 \times 10^{-4}$ to
 $\hat{s}_H = 1.52 \times 10^{-3}$, an approximately eightfold increase. For comparison, DellaVigna and Pope (Reference DellaVigna and Pope2018) estimate a roughly sixfold increase in non-pecuniary motivation. However, this disparity could be explained by the fact that in their case, participants experienced an increase in base pay of 40 cents compared to £ 2.20 in our case. Higher base pay also raises responsiveness to hypothetical incentives. Holding the hypothetical piece rate fixed at £ 1.00, the internalization parameter increases from
 $\hat{\beta}_{LH} = 3.81 \times 10^{-4}$ to
 $\hat{\beta}_{HH} = 2.77 \times10^{-3}$, an approximately sevenfold increase. Thus, higher base pay increases both baseline effort and participants’ responsiveness to hypothetical piece rates.
Appendix Figure A5 illustrates the structural model by inverting it to plot predicted effort as a function of total per-participant budget under real piece-rate incentives, hypothetical piece-rate incentives, and base pay only. This counterfactual analysis is subject to linearity assumptions on how non-pecuniary motivation and internalization vary with base pay.
5. Conclusion
A core tenet of experimental economics holds that behavior should be sufficiently incentivized, yet recent evidence suggests that real and hypothetical incentives may yield similar outcomes in certain contexts such as choice-based preference tasks. In this paper we test whether framing incentives in hypothetical terms can stimulate real effort. We conduct two pre-registered studies using a standard real-effort task. Study 1 compares three incentive structures: real monetary incentives, hypothetical monetary incentives, and no mention of incentives. Study 2 replicates Study 1 and introduces additional treatments that systematically varied base pay and piece-rate magnitude within these incentive structures.
We find that although hypothetical incentives can generate some additional effort compared to providing no mention of incentives, they fall substantially short of the effort induced by real incentives, even when their nominal value is radically inflated. In the absence of real piece rates, substantially raising the base pay increases effort modestly, especially when combined with high hypothetical piece rates. However, this strategy remains cost-ineffective as even minimal real piece rates achieve significantly higher effort at a fraction of the total cost.
To decompose these treatment effects into interpretable parameters, we extend a model of costly effort, incorporating a parameter that captures responsiveness to hypothetical incentives, and estimate it structurally. Participants internalize hypothetical piece rates at extremely low rates, with evidence suggesting this rate declines further as hypothetical piece rates increase. Raising base pay substantially increases non-pecuniary motivation, consistent with gift-exchange reciprocity toward the experimenter. Higher base pay also amplifies responsiveness to hypothetical incentives. This analysis identifies and qualitatively characterizes interactions between base pay, hypothetical piece-rate magnitude, and the rate at which participants internalize hypothetical incentives. Measuring these interactions quantitatively would require pinpointing the functional forms that govern them, which remains an open question. As a first step, we impose linearity on how non-pecuniary motivation and internalization vary with base pay and trace out the resulting budget-constrained counterfactuals (Appendix Figure A5), which further illustrate that real piece-rate incentives are more cost-effective than increases in base pay. Because these functional forms are assumed rather than identified, fully answering the question would require additional treatments that introduce further variation in piece rates and base pay levels.
Another important question concerns the extent to which our findings generalize beyond real-effort tasks. Two features of our results speak to this. First, the stark increase in effort induced by real monetary incentives replicated consistently across both studies. This combination of magnitude and robustness constitutes a necessary condition for generalizing a finding beyond the immediate experimental context. Second, even though our findings come from a real-effort task, when effort is broadly defined to account for the time and cognitive resources that participants invest, our results become relevant across task types.
One possible objection is that preference-based choice tasks might require significantly less effort than ours; though whether they do is itself an empirical question. More importantly, it is worth asking whether there exists a minimum effort threshold below which data quality deteriorates in such tasks. Some features of our exploratory analysis may offer a useful starting point for this investigation: our results suggest that when real incentives were absent, a substantial share of participants exerted minimal effort, solving at most one item, and showed higher error rates on the comprehension check. However, since both analyses are exploratory, these patterns require further investigation. Future research could systematically assess the minimum level of effort different task types require to yield high-quality data (including instruction comprehension, genuine introspection, and accurate calculations) and examine whether hypothetical incentives can reliably sustain this baseline engagement. Thus, while we refrain from drawing strong conclusions about why some preference-based choice studies find null effects between hypothetical and real incentives, our results provide clear evidence that when experimental tasks impose real costs, real incentives matter.
Supplementary material
The supplementary material for this article can be found at https://doi.org/10.1017/eec.2026.10068
Acknowledgement
This study was pre-registered on AsPredicted and received IRB approval from the German Association for Experimental Economic Research e.V. (Certificate No. rAf5iJta).
Conflict of interest
The authors have no conflict of interest.
Ethics approval
This study received IRB approval from the German Association for Experimental Economic Research e.V. (Certificate No. rAf5iJta).
Replication package
The replication materials for this study are available at https://doi.org/10.5281/zenodo.22695799.



 Open access

