Introduction
This paper analyses satisfaction with daily activities of retirees aged 65 and over in 11 European countries. The focus is on improving comparability across countries and socio-economic groups, accounting for the fact that differences between reported satisfaction levels may reflect genuine differences in the quality of daily activities, but can also be due to differences in reporting styles across societal groups or cultures, referred to as DIF or differential item functioning (Holland and Wainer Reference Holland and Wainer1993). The paper applies the technique of anchoring vignettes as a tool to correct for the latter type of difference, following King et al. (Reference King, Murray, Salomon and Tandon2004): respondents are not only asked to evaluate their own daily activities, but also those of hypothetical persons briefly described in the vignettes. Systematic differences in the evaluations of the same hypothetical individuals by respondents in different cultures or socio-economic groups are used to identify differences in response scales.
The technique of anchoring vignettes has been applied to self-assessments of satisfaction with other important domains of quality of life. Although we do not know of any studies that show that DIF is more important for older age groups, the method has become particularly popular in the analysis of wellbeing of the 50+ age group, and anchoring vignettes have been included in several large socio-economic surveys that cover the older part of the population. Bago d'Uva, O'Donnell and Van Doorslaer (Reference Bago d'Uva, O'Donnell and Van Doorslaer2008) analyse self-assessed health of the 50+ in 11 European countries using vignettes in the Survey of Health, Ageing and Retirement (SHARE), while Bago d'Uva et al. (Reference Bago d'Uva, Lindeboom, O'Donnell and Van Doorslaer2011) do the same for the 50+ in England, using the English Longitudinal Study of Ageing (ELSA). Other examples of studies using vignettes in SHARE are: Vonkova and Hullegie (Reference Vonkova and Hullegie2011) on health; Angelini, Cavapozzi and Paccagnella (Reference Angelini, Cavapozzi and Paccagnella2011) on work disability in the age group 50–65; Sirven, Santos-Eggimann and Spagnoli (Reference Sirven, Santos-Eggimann and Spagnoli2012) on health-care responsiveness; Angelini et al. (Reference Angelini, Cavapozzi, Corazzini and Paccagnellaforthcoming) on life satisfaction; and Bonsang and van Soest (Reference Bonsang and van Soest2012a , Reference Bonsang and van Soest2012b ) on social contacts of the 65+ and on job and income satisfaction, respectively. These studies typically find that correcting for response-style differences substantially changes the conclusions about cross-country differences. Satisfaction with daily activities has not, to our knowledge, been analysed in this way.
The next section contextualises the topic of the paper by discussing a number of existing studies showing the importance of (satisfaction with) daily activities for quality of life and life satisfaction of older age groups. The Methods section presents the concept of anchoring vignettes along with the associated econometric model and discusses its advantages and limitations for improving international comparability of subjective wellbeing measures. The Data section presents the data from the SHARE and the variables that are used for the empirical analysis. The Results section presents estimation results and additional calculations based upon these results that confirm what was found for other domains: correcting for response-style differences changes the conclusions about the cross-country ranking of the genuine quality of daily activities among retirees aged 65 and over in Europe. On the other hand, the correction does not affect the conclusion that, keeping health and demographics constant, there is no significant effect of age on satisfaction with daily activities. The final section draws some conclusions and mentions limitations and topics for further research.
Daily activities, life satisfaction and quality of life of older age groups
This study contributes to the growing literature on life satisfaction and satisfaction with important domains of life of older age groups. Many studies have shown that self-assessed measures of satisfaction with life and its domains are useful and contain relevant information to measure actual wellbeing of the adult population in general. For example, Van Praag and Ferrer-i-Carbonell (Reference Van Praag and Ferrer-i-Carbonell2008) and Van Praag, Frijters and Ferrer-i-Carbonell (Reference Van Praag, Frijters and Ferrer-i-Carbonell2003) use a conceptual framework whereby satisfaction with life in general can be seen as an aggregate of the qualities of several domains of life, such as health, financial situation, social contacts and family life, and work or other daily activities. The influential report by Stiglitz, Sen and Fitoussi (Reference Stiglitz, Sen and Fitoussi2010), commissioned by the French president Sarkozy, emphasises the importance of comparability of such measurements across populations and socio-economic groups for designing efficient economic and social policies. Frijters (Reference Frijters2000) finds that satisfaction with leisure activities is an important component of life satisfaction, and Van Praag, Frijters and Ferrer-i-Carbonell (Reference Van Praag, Frijters and Ferrer-i-Carbonell2003) find that satisfaction with leisure has larger predictive value for non-workers than for workers in Germany. A similar result is found by Van Praag and Ferrer-i-Carbonell (Reference Van Praag and Ferrer-i-Carbonell2008) for the United Kingdom, where, moreover, satisfaction with leisure use appears to have a stronger effect on satisfaction with life than satisfaction with the amount of leisure (though both are significantly positive).
The study of quality of life and life satisfaction of the older part of the population has become a core topic in the economics and the social sciences of ageing. Gwozdz and Sousa-Poza (Reference Gwozdz and Sousa-Poza2010) find that life satisfaction in Germany strongly declines after age 65, and that this decline can be primarily attributed to the decline in perceived health. Motel-Klingebiel, Von Kondratowitz and Tesch-Römer (Reference Motel-Klingebiel, von Kondratowitz and Tesch-Römer2004) emphasise the similarity of age tendencies of quality of life and social contacts across modern European countries. Higgs et al. (Reference Higgs, Hyde, Wiggins and Blane2003) emphasise that quality of life in early old age not only measures health but also has a sociological dimension. They measure quality of life using the CASP 19 index, involving 19 Likert-scaled items which cover four theoretical domains: Control, Autonomy, Self-realisation and Pleasure.
For those aged 65 and over who in most countries rarely participate in the labour market, it has been shown that daily activities are among the most important factors driving life satisfaction (Mannell and Dupuis Reference Mannell, Dupuis and Birren1996). In a study for Spain, Fernández-Ballesteros, Zamarrón and Ruíz (Reference Fernández-Ballesteros, Zamarrón and Ruíz2001) conclude that an activity index, based upon physical activity level, satisfaction with these activities and social relationships, has a stronger impact on life satisfaction than other single factors such as health or demographic variables. Chen (Reference Chen2001) finds that daily activities have an important effect on satisfaction with life after retirement and Nimrod (Reference Nimrod2007) emphasises the importance of the specific nature of leisure activities for retirees' life satisfaction. Gabriel and Bowling (Reference Gabriel and Bowling2004) find that engaging in hobbies, solo leisure activities and social leisure activities are among the main quality of life themes. McGuinn and Mosher-Ashley (Reference McGuinn and Mosher-Ashley2001) emphasise that self-generated leisure activities with others increase the life satisfaction of older people in long-term care facilities, while activities provided by the facility do not have a noticeable effect. Prieto-Flores et al. (Reference Prieto-Flores, Moreno-Jiménez, Fernandez-Mayoralas, Rojo-Perez and Forjaz2012: table 4) find that satisfaction with leisure activities significantly contributes to life satisfaction of 65 and older residents of the Madrid province of Spain, but the effect is smaller than the effects of satisfaction with family, neighbourhood, finances or health. Finally, Klumb and Maier (Reference Klumb and Maier2007) find that the nature of daily activities is associated with survival in a German sample of persons aged 70 and over. They distinguish three types of activities: activities considered regenerative (resting, self-maintenance), productive activities that could also be outsourced to others (housework, gardening, helping others, etc.) and consumptive activities (meeting friends, physical exercise, reading, etc.) that cannot be outsourced. In particular, they find a strong positive association of longevity with consumptive activities such as socialising or reading a novel, suggesting a psycho-social pathway through quality of life.
Methods
The chopit model
We use the chopit model introduced by King et al. (Reference King, Murray, Salomon and Tandon2004) and applied in many other studies using anchoring vignettes. The ordinal nature of self-assessed satisfaction with daily activities s i (varying from 1 (very dissatisfied) to 5 (very satisfied)) is taken into account using an ordered response model: a latent satisfaction variable (s i *) is defined as:
 $$s_i ^* = X_i \beta + \varepsilon _i. $$
Here X i is a vector of explanatory variables including country dummies, gender, years of education, health, age, etc., and β is a vector of unknown parameters. The error term ε i is assumed to be drawn from a standard normal distribution, independent of X i . Reported satisfaction s i is a categorical variable based upon the latent variable s i *:
 $$s_i = j\quad {\rm if}\quad \tau _i^{\,j - 1} \lt s_i ^* \leqslant \tau _i^j, $$
If the thresholds between categories are the same for all respondents (τ i j =τj for all i, j) then this gives the standard ordered probit model for ordered categorical outcomes. In the chopit model, however, the thresholds are allowed to vary with respondent characteristics X i :
 $$\eqalign{\tau _i^1 & = X_i \gamma ^1, \cr \tau _i^j & = \tau _i^{\,j - 1} + \exp (X_i \gamma ^j ),j = 2,3,4.} $$
The exponential is taken to make sure that the thresholds are increasing with j for all possible values of X i . The vectors γ 1, γ 2, γ 3, γ 4 consist of unknown parameters. To identify β, γ 1, … , γ 4, additional information is used in the form of vignette evaluations V i k (k=1, … , L), where L is the number of different vignettes evaluated by each respondent (in our study, L=2). These are modelled as follows:
 $$\eqalign{& V_i ^{*k} = \theta ^k + \nu_i ^k, \cr & V_i ^k = j\quad {\rm if}\quad \tau _i^{\,j - 1} \lt V_i ^{*k} \leqslant \tau _i^j,} $$
where V i k is the evaluation of vignette k by respondent i, and the ν i k are error terms, assumed to be normally distributed with mean 0 and variance σ v 2, independent of each other, of ε i and of X i .
Identifying assumptions
There are two main identifying assumptions underlying this model. The first is response consistency: a given respondent uses the same scales τ i j for self-reports and vignette evaluations. The second assumption is vignette equivalence: there should be no systematic differences in the interpretation of a given vignette between respondents with different characteristics X i (so that V i *k does not vary with X i ).
Most of the applications of anchoring vignettes take these assumptions for granted. They have been tested in some recent studies on different domains of wellbeing or other survey measures with subjective ordinal scales, but not for vignettes of daily activities. Van Soest et al. (Reference Van Soest, Delaney, Harmon, Kapteyn and Smith2011) test response consistency in a subjective measure of drinking behaviour (with answers mild, …, excessive) using reported drinking behaviour on an objective scale (one drink, two or three drinks…) as a benchmark. They find that response consistency is formally rejected, but the corrections for response-style differences using the vignettes still take the subjective evaluations much closer to the objective benchmark. Vonkova and Hullegie (Reference Vonkova and Hullegie2011) consider objective and subjective measures of several domains of health (mobility, breathing, cognition) and find that corrections using vignettes help to increase the correlation between the subjective and objective measure for breathing and mobility but not for cognition. Bonsang and van Soest (Reference Bonsang and van Soest2012b ) do not formally test response consistency or vignette equivalence, but do conclude that a correction for response-style differences brings the cross-country ranking of satisfaction with income more in line with the ranking of income per capita.
Bago d'Uva et al. (Reference Bago d'Uva, Lindeboom, O'Donnell and Van Doorslaer2011) analyse subjective health in various domains and introduce tests for the joint hypothesis of vignette equivalence and response consistency that do not require an objective measure, exploiting the fact that corrections using different (subsets of the) vignettes should give similar corrections if the assumptions are satisfied. Their conclusions are also mixed. Kapteyn, Smith and van Soest (Reference Kapteyn, Smith and van Soest2013) use similar tests in their analysis of income satisfaction in the United States of America and the Netherlands. They also find that the test formally rejects the identifying hypotheses. They conclude, however, that using different subsets of the vignettes leads to very similar corrections (although statistically different), suggesting that the corrections, although imperfect, are still a useful tool to improve the comparisons. We will perform a similar analysis here, exploiting the fact that we have two vignettes for daily activities, leading to similar conclusions: the identifying assumptions are not literally satisfied, but the results suggest that the corrections go in the right direction.
Counterfactuals
To illustrate the implications of differences in reporting styles, the estimates of the chopit model will be used to simulate counterfactual distributions of satisfaction with daily activities. First, we simulate satisfaction levels for all respondents using the thresholds estimated for their own country of residence. The resulting distributions in all countries should be similar to the observed distributions in the data if the model is well specified. The second simulation produces the hypothetical (‘counterfactual’) distribution of satisfaction in each country using the thresholds that a similar respondent in the benchmark country (Germany, the country with the largest number of observations)Footnote 1 would use. This simulation, therefore, shows the differences across countries that remain when cross-cultural differences in evaluation norms (thresholds) are eliminated. The differences between the (ranking of) the distributions of the two simulations will be informative on how differences in reporting styles affect the cross-country comparison of satisfaction with daily activities.
A third simulation produces the hypothetical (‘counterfactual’) distribution of satisfaction in each country using German thresholds but also the German equation for genuine satisfaction (that is, setting the country dummies of the main equation to zero). As a result, the only source of cross-country differences is the cross-country variation in the distribution of the covariates X, so this simulation shows which differences in genuine satisfaction are explained by differences in covariates such as health status, income, etc.
Data
The sample
The empirical analysis is based on data from the COMPARE sample, where COMPARE is the acronym of the project ‘A Toolbox for Improving the Comparability of Cross-national Survey Data with Applications to SHARE’ funded by the European Commission in its Sixth Framework Programme. The COMPARE sample is part of the second wave (2006–2007) of the Survey of Health, Ageing and Retirement in Europe (SHARE). SHARE includes extensive survey information on health, employment, financial situation, family and activities of a representative sample of the 50+ populations in 15 European countries (Börsch-Supan et al. Reference Börsch-Supan, Brugiavini, Jürges, Mackenbach, Siegrist and Weber2005, Reference Börsch-Supan, Brugiavini, Jürges, Kapteyn, Mackenbach, Siegrist and Weber2008). When designing the survey, probability samples have been carefully drawn in each country (Börsch-Supan, Hank and Jürges Reference Börsch-Supan, Hank and Jürges2005). The COMPARE sample is a representative sub-sample of SHARE in 11 countries where respondents were asked self-assessments and vignette evaluations of satisfaction with different domains of life (for details, see van Soest Reference Van Soest, Börsch-Supan, Brugiavini, Jürges, Kapteyn, Mackenbach, Siegrist and Weber2008).
The total COMPARE sample includes 7,513 individuals in Belgium, the Czech Republic, Denmark, France, Germany, Greece, Italy, the Netherlands, Poland, Spain and Sweden. For the analysis, we restrict our sample to individuals aged 65 and over (3,305 observations) who report not doing paid work (3,200 observations).Footnote 2 Among these, 2,846 individuals answered the questions about satisfaction with daily activities and the corresponding vignettes. After deleting observations with missing or unreliable values for the explanatory variables used in the analysis, the final sample includes 2,660 individuals.
Satisfaction with daily activities
The question about satisfaction with daily activities is asked as follows:
Self-assessment:
How satisfied are you with your daily activities?
Very dissatisfied/Dissatisfied/Neither satisfied nor dissatisfied/Satisfied/Very satisfied
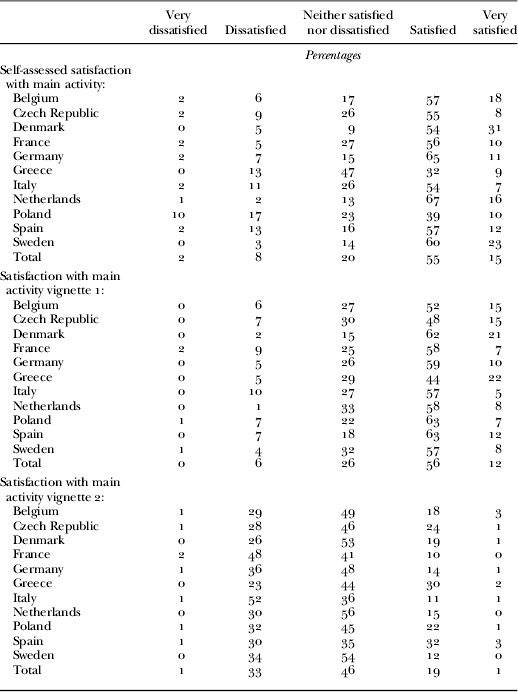
The distribution of reported satisfaction with daily activities is reported in the first panel of Table 1. In all countries, many respondents report that they are satisfied with their daily activities. Denmark and Sweden have the largest share of older individuals reporting that they are very satisfied. At the other end, 27 per cent of the 65+ retirees in Poland report they are not or not at all satisfied with their daily activities.
Distribution of self-assessed satisfaction with main activity and vignettes

Note: COMPARE sample; non-working individuals aged 65 or older.
Immediately after this self-assessment, respondents were asked to report the satisfaction of two hypothetical individuals, described as follows:
Vignette 1
Mike has been retired for five years. He quit his job as soon as he could. He enjoys spending most of his time with friends and family and watches TV when he sometimes gets bored. How satisfied do you think Mike is with his daily activities?
Very dissatisfied/Dissatisfied/Neither satisfied nor dissatisfied/Satisfied/Very satisfied
Vignette 2
Sally has been retired for five years. Although she enjoys spending time with her children and grandchildren, she still misses the contacts with her colleagues and would have liked to keep working. How satisfied do you think Sally is with her daily activities?
Very dissatisfied/Dissatisfied/Neither satisfied nor dissatisfied/Satisfied/Very satisfied
The second and third panels of Table 1 show that the distributions of the vignette evaluations vary substantially across the 11 countries. For example, Danish respondents often give quite positive ratings (‘very satisfied’ or ‘satisfied’) to the first vignette. This suggests that the higher self-reported level of satisfaction observed in Denmark may (partly) be due to differences in response scales (DIF). Greek respondents are very positive about the second vignette. Italian respondents tend to give negative evaluations for both vignettes, suggesting that self-assessments underestimate the Italians' actual satisfaction with daily activities compared to other countries.
Explanatory variables
In addition to country dummies, the econometric model includes socio-demographic characteristics such as gender, age, marital status and years of education. Income is measured as the logarithm of reported monthly net household income last month, adjusted by PPP (Purchasing Power Parity).Footnote 3 To control for health we construct a health index following the strategy of Bound et al. (Reference Bound, Schoenbaum, Stinebrickner and Waidmann1999), using a linear combination of objective health variables that best predicts self-reported overall health. This health index avoids the reporting bias in self-reported health. It is obtained by estimating an ordered probit model with self-reported overall health as the dependent variable and a large set of detailed objective health indicators as explanatory variables. From the estimation results, we compute the predicted latent variable and define it as our health index, where higher values indicate better health.Footnote 4 Moreover, we added several variables related to family ties: the number of children, a dummy for individuals having a co-residing child and the (log of the) number of annual contacts with children.Footnote 5 A potentially important activity for older individuals consists of looking after grandchildren. We therefore include an additional dummy ‘Looking after grandchildren’ that is equal to 1 if the respondent reports having looked after his or her grandchildren during the last 12 months in the absence of the parents.
To measure the involvement of the older individuals in non-professional activities, we added a set of dummies related to different types of activities. Following Klumb and Maier (Reference Klumb and Maier2007), these can be distinguished in productive activities: ‘Doing voluntary or charity work’, ‘caring for a sick or disabled adult’ and ‘providing help to friends or neighbours; and consumptive activities: ‘attending an educational or training course’, ‘going to a sport, social or other kind of club’, ‘taking part in activities of a religious organisation’ and ‘taking part in a political or community-related organisation’. The data do not provide information on how much time is spent on these activities. Nor do they contain information on regenerative activities (and it seems safe to assume that everyone spends at least some time on activities like resting or self-maintenance).
Since the vignettes refer to the last job, we considered as additional explanatory variables the time lapse since retirement, dummies describing the previous profession of the individual (according to the International Standard Classification of Occupations ISCO-1 digit classification; dummies were also added for being a home-maker and missing information on the last job). These variables turned out to be insignificant in both the baseline and the chopit model and are therefore not included in our final specifications.Footnote 6
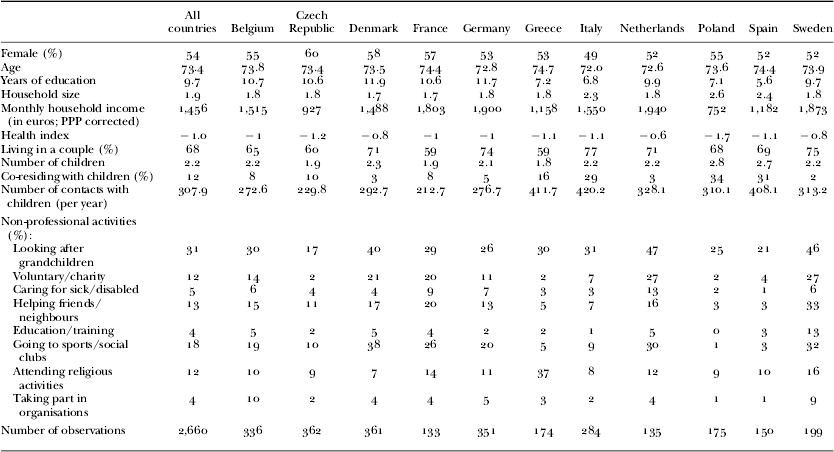
Table 2 presents the country-specific means of the explanatory variables. The large differences across countries in many of these variables are in line with existing findings based upon the first wave of SHARE administered in 2004; see, for example, Hank (Reference Hank2007) for co-residence and contacts with children, Hank and Buber (Reference Hank and Buber2009) for looking after grandchildren, and Hank and Stuck (Reference Hank and Stuck2008) for voluntary or charity work, caring for a sick or disabled person, and helping family, friends or neighbours. These studies are not directly comparable and give different means than in Table 2 mainly because we study a specific age group and a different set of countries, but the general finding of huge cross-country variation is the same.
Descriptive statistics

Notes: COMPARE sample; non-working individuals aged 65 and older. PPP (Purchasing Power Parity).
Results
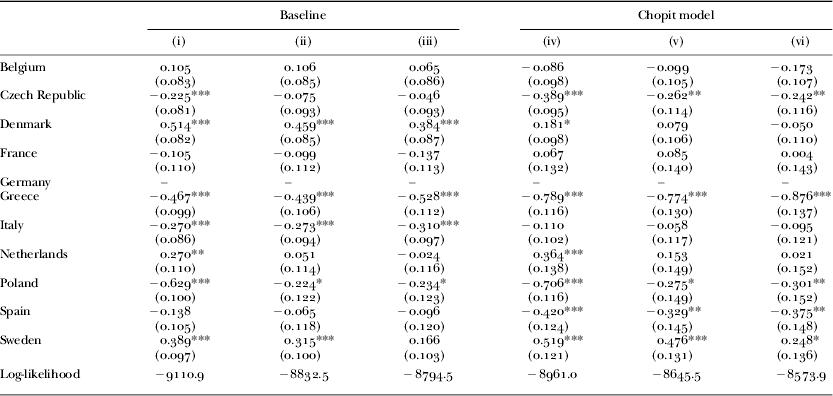
Table 3 presents the parameters of the country dummies estimated for several ordered probit and chopit specifications. Columns (i) to (iii) are standard ordered probit models for self-assessed satisfaction with daily activities with thresholds that do not vary across countries or with individual characteristics; the other columns are the estimates of the corresponding β parameters in Equation (1) of the chopit model. Columns (i) and (iv) are the results of specifications where X includes country dummies only. Germany is taken as the benchmark. Column (i) shows that the 65+ in Denmark, Sweden and the Netherlands report the highest satisfaction with their daily activities. Respondents from Poland, Greece, Italy and the Czech Republic report the lowest satisfaction levels. Comparing with the results of the chopit model in column (iv), however, shows that the ranking of the countries is strongly affected by differences in response styles across countries. Denmark changes from first to third position, after Sweden and the Netherlands. At the lower end the position of Greece and Poland compared to other countries including the benchmark (Germany) decline further in the ranking. This is also the case for the Czech Republic and Spain. On the other hand, the difference between Italy and Germany largely vanishes. These shifts in the country ranking are in line with what we saw in the sample distributions of the vignette evaluations in Table 1. For example, Danish respondents tend to give positive ratings, and correcting for this worsens the position of Denmark. Italians, on the other hand, tend to give rather negative evaluations, and correcting for this improves the rank of Italy.
Satisfaction with daily activities

Notes: COMPARE sample; non-working individuals aged 65 or older. Standard errors are given in parentheses. Number of observations: 2,660. Columns (i) and (iv): models where X contains country dummies only; columns(ii) and (v): X also contains basic demographics, household income and health; Columns (iii) and (vi): children related variables are added to the X of columns (ii) and (v). See text for details.
Significance levels: Estimate is significantly different from zero at the * 10 per cent, ** 5 per cent, *** 1 per cent level.
Columns (ii) and (iii) (for probit) and columns (v) and (vi) (for chopit) present the results for models including additional controls. Models (ii) and (v) add gender, age, years of education, partnership status, (the log of) household size, (the log of) household income and the health index. In models (iii) and (vi), we also include children-related variables: the number of children, a dummy indicating whether the individual co-resides with one of their children and the (log of) number of annual contacts with all the children. We also include a set of dummies indicating whether or not the respondent is involved in several types of activities.
For the chopit model, introducing the standard control variables affects the coefficients on the country dummies (column (v)). The most noticeable changes are found in the two Central European countries and in the Netherlands. The dummies for the Netherlands and Poland are no longer significant at the 5 per cent level, implying that, keeping socio-economic and health variables constant, there are no significant differences in satisfaction between these countries and Germany. This suggests that the difference in genuine satisfaction (corrected for DIF) between Germany and the Netherlands or Poland can mainly be explained from differences in demographics, income and health. Satisfaction of a Czech respondent remains significantly worse than that of a similar German respondent, but the difference is smaller than the difference in the model with country dummies only in column (iv). Greece remains the country with the worst satisfaction levels.
Finally, comparing columns (v) and (vi) shows that the involvement in non-professional activities can explain a substantial part of the difference in satisfaction with daily activities between Germany and Sweden.
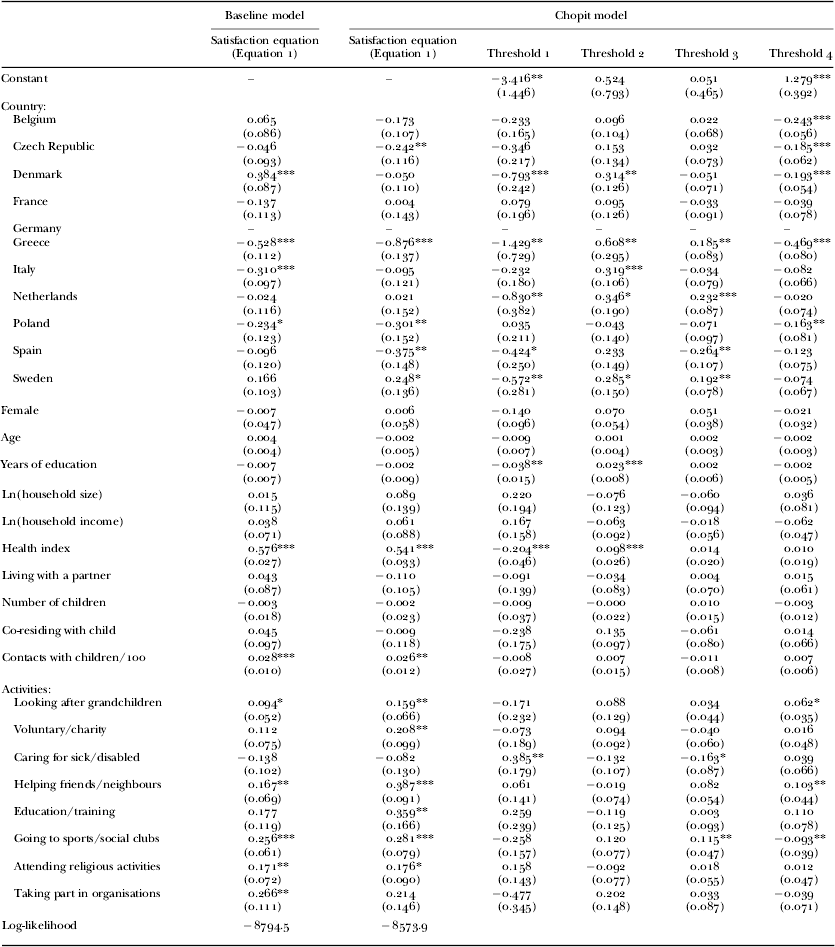
Table 4 presents the parameter estimates for the ordered probit (first column) and the chopit model (second and further columns) including all the explanatory variables (the model for which the coefficients on the country dummies are in columns (iii) and (vi) of Table 3). For the chopit model, the second column of Table 4 presents the estimates of β in the equation for genuine satisfaction, while the remaining columns show the threshold parameters γj, j=1,2,3,4.
Determinants of satisfaction with daily activities

Notes: COMPARE sample; non-working individuals aged 65 and older. Standard errors are given in parentheses. Number of observations: 2,660.
Significance levels: Estimate is significantly different from zero at the * 10 per cent, ** 5 per cent, *** 1 per cent level.
Most of the parameter estimates in the first and second columns are similar and do not differ significantly. The corrections for DIF mainly affect the coefficients on the country dummies, not those on individual and family characteristics or productive or consumptive activities. Satisfaction with daily activities is found to be unrelated to age, gender, education or income. Some of these results are different from those of Palomar Lever (Reference Palomar Lever2004) and Van Praag, Frijters and Ferrer-i-Carbonell (Reference Van Praag, Frijters and Ferrer-i-Carbonell2003) for adults of all ages. On the one hand, Palomar Lever (Reference Palomar Lever2004) finds a positive effect of income on satisfaction with leisure activities for Mexican adults, while Van Praag, Frijters and Ferrer-i-Carbonell (Reference Van Praag, Frijters and Ferrer-i-Carbonell2003) find no significant effect of income on satisfaction with leisure in Germany. On the other hand, the latter find that men are significantly more satisfied with leisure than women, a significantly negative effect of education, and a significant U-shaped age pattern that would imply an increasing age effect for the age range that we consider. These differences confirm that the determinants of satisfaction with daily activities for the 65+ can be quite different from the factors that drive satisfaction with leisure for a general adult population, justifying a separate analysis of the 65 and over group.
The health index has a strong and significant positive impact on satisfaction with daily activities, implying that health problems are an important impediment for (satisfaction with) daily activities. Remarkably, age has no significant effect at all once we control for health – it has a consistently negative effect in specifications that do not control for age. There is a negative association between age and satisfaction with daily activities, but apparently, this is explained by the decline in health at older ages and the impact of this on the quality of the daily activities.
Family composition variables typically have only small effects. The number of contacts with children is positive and marginally significant. A stronger and significant positive effect is found for looking after grandchildren. In fact, as expected, satisfaction with daily activities is positively related to participation in most non-professional activities, especially helping friends or neighbours, attending training or educational courses, going to a sports or social club, and taking part in religious activities. Although not directly comparable, this is broadly in line with Chen (Reference Chen2001) who finds a strong positive and significant effect of leisure activities on satisfaction with life of the 60+ in Taiwan. Consumptive activities like going to a sports or social club tend to have a larger effect than productive activities like caring for a sick or disabled person, supporting the argument of Fernández-Ballesteros, Zamarrón and Ruíz (Reference Fernández-Ballesteros, Zamarrón and Ruíz2001) that consumptive activities have a positive influence on longevity through a psycho-social pathway. On the other hand, helping friends and neighbours, usually characterised as a productive activity, has the strongest effect. Perhaps this is because older individuals derive inherent utility from this activity and the social interaction it involves so that it is more similar to a consumptive activity rather than a purely productive activity that could be outsourced.
Comparing with estimates using only one vignette
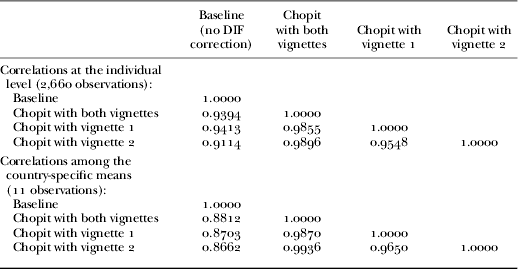
As explained in the Methods section, one way of checking whether the anchoring vignettes are a valid way of correcting for response scale differences is to perform the same estimations using different subsets of the vignettes. Since we have two vignettes, the subsets in this case contain one vignette only. Table 5 presents the correlations between predicted genuine satisfaction levels (
 $X_i \hat \beta $
in Equation (1) in the Methods section) using four different models: the baseline ordered probit model not correcting for DIF, the chopit model presented above using both vignettes, and two chopit models using either vignette 1 or vignette 2. Correlations are presented at the individual level (top panel) as well as for the country-specific means (bottom panel).
Correlations between the predictions of genuine quality with daily activities for four different models

Notes: COMPARE sample; non-working individuals aged 65 and older. DIF: differential item functioning.
The correlation between the predictions of the first two models is 0.939 at the individual level and 0.881 at the country level, again illustrating that most of the change due to correcting for DIF relates to the cross-country comparison. The models using only one vignette give predictions that are strongly correlated with each other and with the model correcting for DIF using both vignettes. Particularly at the country level, the correlation between the final two models (0.965) is much larger than any correlation with the predictions that do not correct for DIF (0.866, 0.870 and 0.881). Even though the correlation may not be perfect (it should be insignificantly different from 1 if the assumptions of vignette equivalence and response consistency are satisfied), this suggests that both vignettes correct in the same direction and probably both help to correct for response scale differences.
Counterfactuals
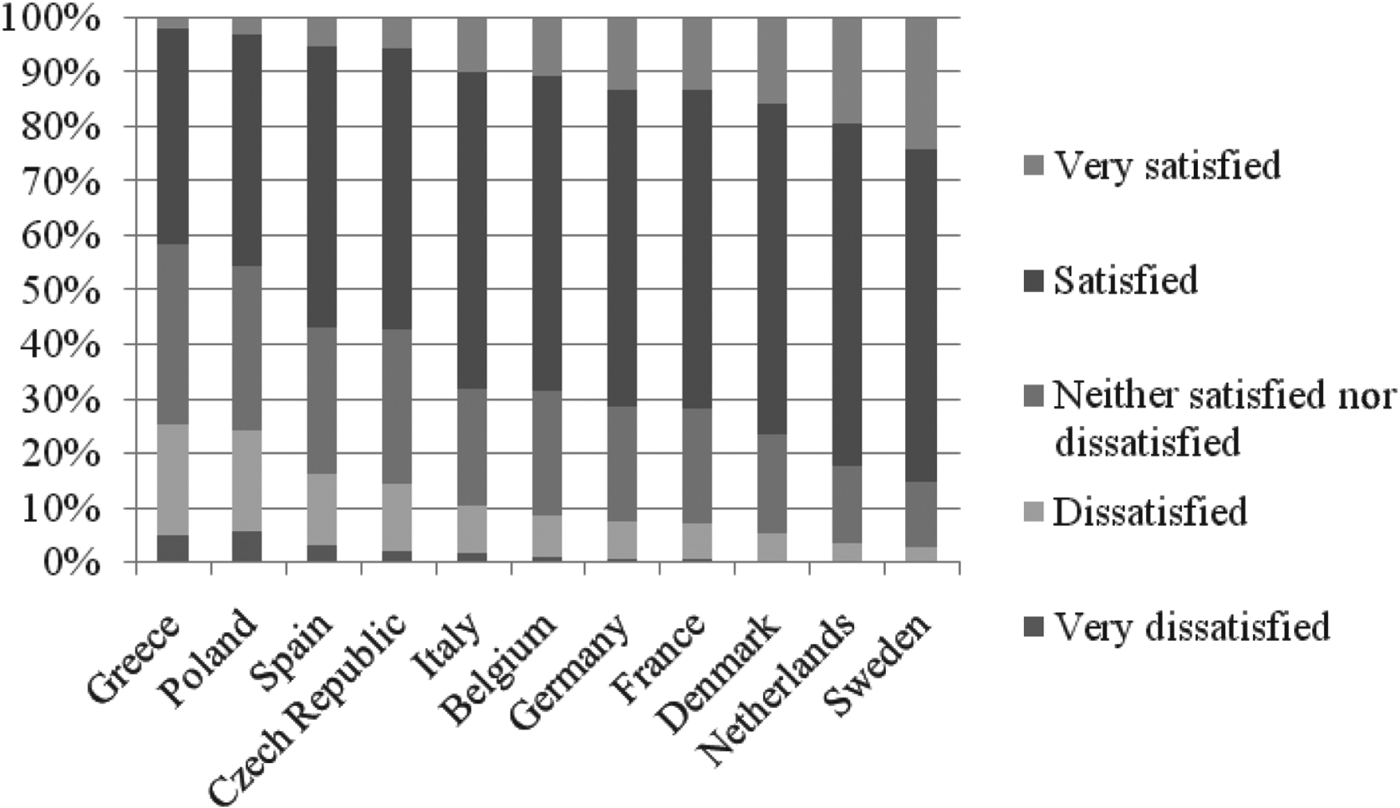
As explained in the Methods section, we perform several simulations to show what the estimates of the chopit model imply for cross-country differences in satisfaction with daily activities. First, we simulate satisfaction levels for all respondents using the estimates of their own country-specific thresholds (see Figure 1). As expected, the resulting distributions are similar to the observed distributions in the data, indicating that the model is able to reproduce the observed distribution of self-assessed satisfaction with daily activities.
Predicted distribution of satisfaction with daily activities using actual thresholds.

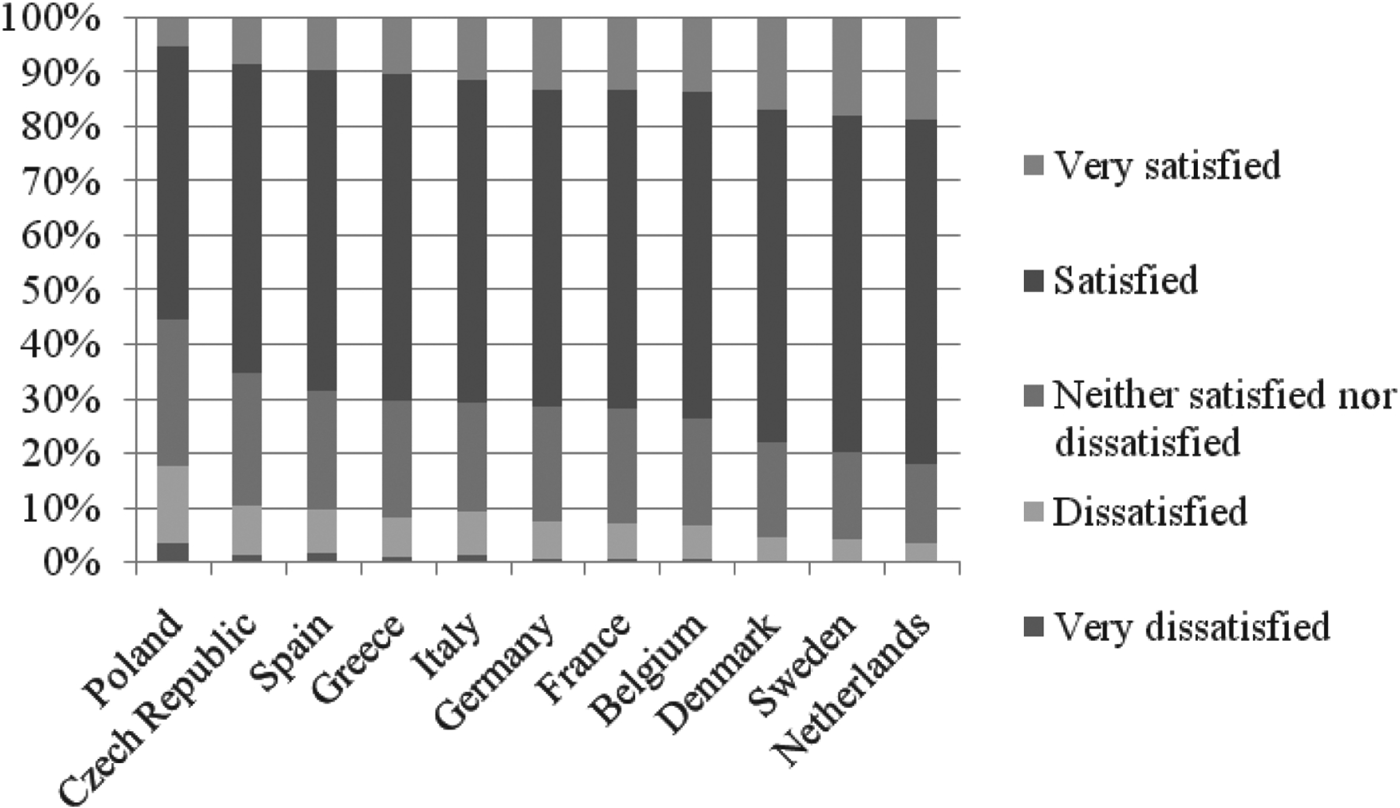
To illustrate the consequences of cross-country differences in reporting behaviour, the second simulation (presented in Figure 2) produces the counterfactual distributions of satisfaction using the thresholds of a similar respondent in Germany, showing remaining cross-country differences after eliminating cross-cultural differences in evaluation norms. The results are largely in line with the country dummies in Table 3, but not completely. The conceptual difference is that the country dummies corresponding to the best performing model in columns (iii) and (vi) of Table 3 should be interpreted as cross-country differences with all the explanatory variables kept constant, whereas in the simulations we use the actual values of the covariates for each respondent in each country. For example, going to a sports or social club is more common in Denmark and Sweden than in any other country (Table 2) and has a significant positive effect on satisfaction with social activities (Table 4). This increases (genuine) average satisfaction with daily activities in Denmark and Sweden (irrespective of response scales) compared to other countries.
Predicted distribution of satisfaction with daily activities using German thresholds.

Correcting for differences in response scales changes the cross-country ranking of the distributions. Denmark seems the most satisfied country in Figure 1, but is outperformed by Sweden and the Netherlands in Figure 2 (after the correction). The reason is, as discussed before, the fact that Danish respondents tend to use very positive evaluations. Using their own thresholds, 83 per cent of Danish respondents are satisfied or very satisfied, but using German thresholds, this would fall to 76 per cent. France moves in the opposite direction: using their own (rather negative) evaluations, only 66 per cent of the French are satisfied or very satisfied (seventh in the country ranking), but using German thresholds, this would increase to 72 per cent (rank four). Nothing changes for Poland and Greece: they remain the countries with the lowest satisfaction with daily activities.
The simulation presented in Figure 3 produces the counterfactual distribution of satisfaction in each country using German thresholds as well as the German equation for genuine satisfaction (that is, setting the country dummies in the main equation to zero), so that the only remaining source of cross-country differences is that in the distribution of the covariates X. Figure 3 shows that the first position is now held by the Netherlands while Sweden and Denmark come second and third, respectively. The Netherlands does so well because the Dutch 65+ often participate in various satisfaction-enhancing activities (volunteer or charity work, going to sports or social clubs, looking after grandchildren), but particularly also because they have fewer health problems than any other country (the highest average health index). Poland and the Czech Republic are at the bottom end, largely because these are the countries where health problems are most common. Greece jumps from the last to the eighth position. Apparently the reason that the Greeks do poorly after correcting for differences in reporting behaviour is not due to their health, activities or other characteristics, but in the way these characteristics map into satisfaction with daily activities (the unexplained or ‘residual’ component of the difference with the other countries; the difference between Figures 2 and 3).
Predicted distribution of satisfaction with daily activities using German thresholds and the German satisfaction equation.

Conclusion
This paper analyses the satisfaction with daily activities of retirees aged 65 and older in 11 European countries. On average, older Europeans report that they are quite satisfied with their daily activities, but there are substantial differences across European countries: respondents from Northern countries tend to report a high level of satisfaction while the lowest levels are found in Central and Southern European countries. Our analyses show the effects of differences in reporting behaviour, using the method of anchoring vignettes which has been recently applied to many domains of wellbeing of older population groups.
Our main finding is that correcting for response-style differences affects the country ranking of satisfaction with daily activities. For instance, Denmark drops from the first to the third place once we control for differential item functioning and the ranking of Poland and Greece declines even further. Health, as well as the involvement in taking care of grandchildren and (other) non-professional activities, is found to be an important determinant of satisfaction with daily activities and explains part of the difference in satisfaction between countries.
Correcting for response scale differences has much less effect on the estimates of what drives within-country differences in satisfaction with daily activities between socio-demographic groups than it has on the cross-country differences. For example, whether correcting for response scale differences or not, we find that once we use the rich information on physical and mental health to control for the respondents' health, age no longer affects satisfaction with daily activities. The older the people are, the less satisfied they are with their activities, but this is largely explained by health and other factors, and not an effect of age itself.
The vignette corrections require identifying assumptions that have not been tested in the current context. Our results suggest that the assumptions are formally rejected by the data but that vignettes still help to improve cross-country comparison so that they better reflect differences in the genuine quality of life. Future work could focus on further validation of the vignette approach, possibly after improving the content of the vignettes. A broader topic of future research could be to combine the analysis with that of several other domains in order to have more insight into differences across the older populations in European countries in a comprehensive set of domains of wellbeing.
Acknowledgements
We are grateful to the Deputy Editor, two anonymous reviewers, Simon Rottke and other participants of the Netspar 2013 pension workshop in Frankfurt for useful comments. This paper uses data from SHARE release 2.5.0, as of 24 May 2011. The SHARE data collection has been primarily funded by the European Commission through the Fifth Framework Programme (project QLK6-CT-2001-00360 in the thematic programme Quality of Life), through the Sixth Framework Programme (projects SHARE-I3, RII-CT-2006-062193; COMPARE, CIT5-CT-2005-028857; SHARELIFE, CIT4-CT-2006-028812) and through the Seventh Framework Programme (SHARE-PREP, 211909; SHARE-LEAP, 227822). Additional funding from the US National Institute on Aging (U01 AG09740-13S2, P01 AG005842, P01 AG08291, P30 AG12815, Y1-AG-4553-01 and OGHA 04-064, IAG BSR06-11, R21 AG025169) as well as from various national sources is gratefully acknowledged (see www.share-project.org for a full list of funding institutions).