


INTRODUCTION
Wheat is one of the major sources of food in many countries, including Pakistan. It is produced in irrigated as well as rainfed areas of the country. It contributes 12.5% to the agriculture and 2.6% to GDP of the country (Government of Pakistan, 2011–2012). The demand for wheat is likely to increase continuously because of population pressure. In spite of higher yield potential, however, average grain yield of wheat in Pakistan is much lower than those produced in most of the countries of the world (Government of Pakistan, 2009–2010). The factors which may cause reduction in the yield of wheat in Pakistan may be delayed sowing, imbalance use of fertilizer, shortage and mismanagement of irrigation water, old and traditional methods of sowing, low genetic potential of varieties and, above all, climatic factors, which may sometimes cause serious reduction in yield (Abbas et al., Reference Abbas, Sheikh, Sabir and Nighat2005). Among these factors, proper sowing time, fertilizer application rate and climate change are the most important variables affecting wheat production (Njuguna et al., Reference Njuguna, Munene, Mwangi, Waweru and Akuja2010). Therefore, it becomes imperative to investigate the potential impacts of these factors on wheat production by collecting field data so that viable decisions can be made.
Information needs, however, for agricultural decision-making at all levels are increasing rapidly due to increased demands of agricultural products and increased pressures on land, water and other natural resources (Jones et al., Reference Jones, Hoogenboom, Porter, Boote, Batchelor, Hunt, Wilknes, Singh, Gijsman and Ritchie2003). The collection of new data through traditional field research methods is not enough to meet these new challenges. Whereas traditional experiments are conducted at particular points in time and space domain, making results site- and season-specific, time consuming and expensive. Unless new data and research findings using computer simulation models are put into formats that are relevant and easily accessible, decisions cannot be made effectively.
Using computer models is one of the options to simulate different management and climatic scenarios for developing the most suitable and site-specific strategies (Bakhsh et al., Reference Bakhsh, Hatfield, Kanwar, Ma and Ahuja2004a; Jones et al., Reference Jones, Hoogenboom, Porter, Boote, Batchelor, Hunt, Wilknes, Singh, Gijsman and Ritchie2003; Li et al., Reference Li, Snow and Holzworth2011; Rezzoug et al., Reference Rezzoug, Gabrielle, Suleiman and Benabdeli2008). Therefore, there is a need to simulate crop growth and development phases relative to potential determined through season and area to help researchers in analyzing the causes of yield differences (Bakhsh et al., Reference Bakhsh, Ma, Ahuja, Hatfield and Kanwar2004b). For example, phenological development of cereal crop is dependent on temperature and photoperiod (Gallagher et al., Reference Gallagher, Biscoe, Jones, Wright and Wynn-Williams1983; Rezzoug et al., Reference Rezzoug, Gabrielle, Suleiman and Benabdeli2008, Saarikko and Carter, Reference Saarikko and Carter1996). Growth of wheat crop may be dependent on the amount of intercepted radiation depending on its region (Gallagher and Biscoe, Reference Gallagher and Biscoe1978). Thus, grain production has been reported to be affected by harvest index (Donald and Hamblin, Reference Donald and Hamblin1976). To carry out analysis of the yield as affected by climate, land and management practices, simulation models of growth and yield are helpful to project the impact of these factors on wheat productivity.
Crop simulation models have been reported as management tools for simulating farming practices and have helped the researchers in determining the relationship between environment, management and yield variability (Bakhsh et al., Reference Bakhsh, Hatfield, Kanwar, Ma and Ahuja2004a; Malone et al., Reference Malone, Ma, Karlen, Meade, Meek, Heilman, Kanwar and Hatfield2007; Sinclair and Saligman, Reference Sinclair and Saligman1996). These models can simulate daily dry matter production as a function of temperature and radiation, and water and nitrogen availability, which can be helpful in decision-making at farm level.
Decision Support System for Agro-technology Transfer (DSSAT v 4.0) is one of the most comprehensive decision support systems (Hoogenboom et al., Reference Hoogenboom, Jones, Wilkens, Porter, Batchelor, Hunt, Boote, Singh, Uryasev, Bowen, Gijsman, du Toit, White and Tsuiji2004; Tsuiji et al., Reference Tsuiji, Jones, Hoogenboom, Hunt and Thornton1994; Yang et al., Reference Yang, Watanabe, Zhang, Hao and Zhang2006) and includes different cropping system models (CSMs) and analytical tools. Scientists have used this model for making decisions in crop production under different environments. Soler et al. (Reference Soler, Sentelhas and Hoogenboom2007) used this model for assessment of planting date and yield prediction in subtropical environment. Other scientists used it for plant population (Keating et al., Reference Keating, Godwin, Watiki, Muchow and Bellamy1991; Piper and Weiss, Reference Piper and Weiss1990), irrigation and economical analysis (Dejonge et al., Reference Dejonge, Kaleita and Thorp2007) and nitrogen leaching and management studies (Asadi and Clemente, Reference Asadi and Clemente2003; Pang et al., Reference Pang, Letey and Wung1997; Paz et al., Reference Paz, Batchelor, Babcock, Colvin, Logsdon, Kaspar and Karlen1999). The application of DSSAT to optimize in-season management for spatially variable fields in particular provides farmers the options to decrease inputs and increase net returns (Booltink et al., Reference Booltink, Van Alphen, Batchelor, Paz, Stoorvogel and Vargas2001, Zaman et al., Reference Zaman, Swain, Schumann and Percival2010).
In Pakistan, limited studies on crop growth modeling have been reported especially to investigate the effects of fertilizer applications on crop production. Ahmad et al. (Reference Ahmad, Ahmad, Manuela, Soler, Ali, Zia-Ul-Haq, Anothai, Hussain, Hoogenboom and Hasanuzzaman2012a) evaluated performance of CSM-Crop Environment REsource Synthesis (CERES)-Rice in Faisalabad conditions to simulate growth and development of an aromatic rice variety under irrigated conditions in semiarid environment of the country for determining impact of various plant densities and nitrogen (N) application rates on grain yield. Sultana et al. (Reference Sultana, Ali, Iqbal and Khan2009) categorized 10 wheat production sites of Pakistan into four climatic zones, i.e. arid, semi-arid, sub-humid and humid, to explore vulnerability of wheat production in these zones to climate changes using the CSM-Cropsim-CERES-Wheat model. Ahmad et al. (Reference Ahmad, Ahmad, Ali, Hussain, Garcia, Khan, Zia-Ul-Haq, Hasanuzzaman and Hoogenboom2012b) simulated effects of plant density and irrigation regimes on grain yield using the CSM-CERES-Rice model for Faisalabad conditions. Their results showed that the combination of two seedlings hill−1 plant density and 1300-mm irrigation regime produced the highest yield compared to all other scenarios.
Similarly, Himanshu et al. (Reference Himanshu, Singh, Hussain, Hussain, Munnankarni, Mahesh, Minh-Long and Ladha2007) simulated phenology of rice and wheat crops satisfactorily for all the locations in India, Bangladesh, Nepal and Pakistan. Their findings suggested that wheat can be satisfactorily grown with various Resource Conservation Technologies (RCTs), but for rice, RCTs need refinement to improve yield. Khaliq et al. (Reference Khaliq, Ahmad, Hussain and Hoogenboom2007) evaluated the potential of the CSM-CERES-Maize to simulate maize yield at different nitrogen levels under varying soil and environmental conditions of central Punjab, Pakistan, and reported reliable prediction of phenology, growth and yield of maize under semiarid conditions. Nasim et al. (Reference Nasim, Ahmad, Wajid, Hussain, Khaliq, Usman, Hammad, Sultana, Mubeen and Ahmad2010) checked the capacity of the CERES-Wheat model for crop growth and yield simulations under semiarid environment. Their overall results showed that model-simulated crop growth parameters as well as yield components performed fairly well under semiarid conditions of Faisalabad. Nasim (Reference Nasim2012) also evaluated impact of climate change on sunflower crop in contrast to agro-environments of the Punjab, Pakistan. The validated model (OILCROP-SUN model) reasonably predicted phenology, crop growth and yield of sunflower crop, which was found to be sensitive to changes in carbon dioxide (CO2) and temperature. The above studies have mostly reported calibration and validation of models. No study, however, has been conducted to simulate wheat grain yield production as a function of fertilizer applications for producing maximum grain yield. Therefore, this study has been designed to focus on the following specific objectives:
• Calibrate and evaluate the CERES-Wheat model for simulating effects of urea fertilizer applications on wheat productivity.
• Simulate wheat grain yield production function against different doses of urea fertilizer applications.
MATERIAL AND METHODS
Study area
A three-year field study was conducted in the rabi (winter) seasons of 2008–2009, 2009–2010 and 2010–2011 at the Postgraduate Agricultural Research Station (PARS) of the University of Agriculture, Faisalabad, which is located in Rachna Doab (land between rivers Ravi and Chenab) with coordinates having longitude of 73° 0′ E and latitude of 31° 2′ N (Figure 1). The soils of the study area are predominantly medium to moderately coarse with favourable permeability characteristics, and show a flat topography throughout the area. The field has been traditionally under wheat cultivation over the years.
Location of study area.

Experimental design and treatments
A randomized complete block design was used for experiments on five blocks, each block of 2 ha in size. The total number of experimental units was 60 having 12 experimental plots in each block. The size of each experimental unit was 67 × 24 m (0.16 ha). A disc plough was used for primary tillage operations, tine cultivator was used for secondary operations, and finally planker was used. Total experimental area was 10 ha. The schedule of management activities is given in Table 1, and details of treatments for all the three experiments conducted in three years are given in Table 2.
Schedule of management activities performed during study period.

*Seed of wheat, AS-2002 variety, was applied at the rate of 125 kg ha−1 at row-to-row spacing of 150 mm.
**Urea fertilizer was applied based on treatments just prior to irrigation on the same day.
Treatments description for three years.

T = Treatment
*Urea fertilizer application rates for variable treatments were determined based on the recommended dose of urea fertilizer application rate for the study area, by the Provincial Department of Agriculture, minus 50% of the soil nitrogen, considered as available to the crop during growing season.
CERES-Wheat model
The CERES-Wheat crop growth model, imbedded in DSSAT family (DSSAT v4), was used to simulate wheat grain yield production function. The CERES-Wheat model has the ability to simulate growth, development and crop yield in homogenous area of the field on either plot, field or regional scale (Paz et al., Reference Paz, Batchelor, Babcock, Colvin, Logsdon, Kaspar and Karlen1999; Thorp et al., Reference Thorp, DeJonge, Kaleita, Batchelor and Paz2008). The model operates on a daily time step and computes the state variable on each day of the year or growing season (Fraisse et al., Reference Fraisse, Sudduth and Kitchen2001). The CERES-Wheat model requires input data such as management practices (sowing depth and dates, variety, row spacing, emergence date, plant population, irrigation and fertilizer application dates and amount), daily weather data (maximum and minimum temperature, rainfall and solar radiation) and soil data. In order to calibrate the model to specific local conditions, crop development and yield data are also required (Thorp et al., Reference Thorp, DeJonge, Kaleita, Batchelor and Paz2008).
Data collection
Climatic data were collected from the nearest weather station, i.e. Crop Physiology Department, University of Agriculture Faisalabad, 15 km away from the experimental area. Data of maximum and minimum air temperature (°C), precipitation (mm) and daily sunshine hours were collected. The solar radiation data (MJ m−2 day−1) were estimated using the computer software CROPWAT v. 8.0 for input to the CERES-Wheat model. The crop management data were recorded throughout the growing seasons. The input files, such as weather file, soil file, file A (average measured data file) and file T (time series data file), were prepared to calibrate and validate the CERES-Wheat model.
Model calibration
The process of the CERES-Wheat model calibration aims at obtaining reasonable estimates of model genetic coefficients by comparing simulated data with the observed data. Comparison of observed biomass with the predicted as a function of time helps in adjustment of model coefficients so that a better match can be obtained. The model has seven genetic coefficients with default values and their ranges. Phylochron Interval (PHINT) regulates thermal time between appearances of leaf tips, and has a default value of 95 GDDo with a range of 60 to 95 GDDo. G3, the tiller coefficient having range of 1.5–2.0 g, incorporates effect of stem growth. G2, the potential kernel growth rate, has the default value of 40 mg. G1 is the kernel number per unit weight of stem plus spike at anthesis, and default value of G1 varies between 15 g−1 and 50 g−1. P5 is the relative grain filling period based on thermal time ranging between 332 GDDo and 610 GDDo. P1D is the percentage reduction in development rate in a photoperiod of 10 h shorter than the optimum relative to that at the optimum, and the literature value for P1D ranges from 43 to 58%. P1V, days at optimum vernalizing temperature requires to complete vernalization, in practice, has been reported to vary within a range of 10 to 65 days (Godwin et al., Reference Godwin, Ritchie, Singh and Hunt1989; Jones et al., Reference Jones, Hoogenboom, Porter, Boote, Batchelor, Hunt, Wilknes, Singh, Gijsman and Ritchie2003; Nasim et al., Reference Nasim, Ahmad, Wajid, Hussain, Khaliq, Usman, Hammad, Sultana, Mubeen and Ahmad2010; Rezzoug et al., Reference Rezzoug, Gabrielle, Suleiman and Benabdeli2008, Rinaldi, Reference Rinaldi2004).
In this study, the model was calibrated using data on biomass, grain yield and biological yield in addition to matching phonological development of wheat during its growth period for treatment of T9 (247 kg-urea ha−1) for growing season 2009–2010. The calibration procedure minimized the differences between measured data and corresponding simulated data. An iterative approach was used for obtaining genetic coefficient values based on the process that minimized difference between observed and simulated values as already described by different researchers (Ahmad et al., Reference Ahmad, Ahmad, Ali, Hussain, Garcia, Khan, Zia-Ul-Haq, Hasanuzzaman and Hoogenboom2012a, Reference Ahmad, Ahmad, Manuela, Soler, Ali, Zia-Ul-Haq, Anothai, Hussain, Hoogenboom and Hasanuzzamanb; Boote et al., Reference Boote, Jones, Hoogenboom, Pickering and Tsuji1998; Nasim et al., Reference Nasim, Ahmad, Wajid, Hussain, Khaliq, Usman, Hammad, Sultana, Mubeen and Ahmad2010; Rezzoug et al., Reference Rezzoug, Gabrielle, Suleiman and Benabdeli2008).
Model evaluation
The performance indicators, such as percentage of difference (%D), mean percent difference (MPD) and root mean square error (RMSE), were used to evaluate the model prediction capability. Brief description of these indicators is given below (Willmott, Reference Willmott1982; Willmott et al., Reference Willmott, Ackleson, Davis, Feddema, Klink, Legates, Connell and Rowe1985).
Percentage of difference (%D)
Various studies have reported to match the model prediction and observed data within 15% (Bakhsh et al., Reference Bakhsh, Hatfield, Kanwar, Ma and Ahuja2004; Hanson et al., 1999). Ahuja et al. (Reference Ahuja, Rojas, Hanson, Shaffer and Ma2000) reported that %D (the percentage difference between the predicted (Pi) and observed (Oi) data) was the goodness of fit statistics. The %D was calculated using the following relationships (Rezzoug et al., Reference Rezzoug, Gabrielle, Suleiman and Benabdeli2008):
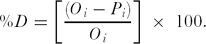 \begin{equation}
\% D = \left[ {\frac{{(O_i - P_i )}}{{O_i }}} \right]\; \times \;100.\end{equation}
Root mean square error (RMSE)
The value of RMSE equal to zero indicates the goodness of fit between predicted and observed data (Bakhsh et al., Reference Bakhsh, Ma, Ahuja, Hatfield and Kanwar2004; Rezzoug et al., Reference Rezzoug, Gabrielle, Suleiman and Benabdeli2008):
 \begin{equation}
RMSE = \left[ {\left( {\sum\nolimits_{i = 1}^n {(P_i - O_i )^2 } } \right)/n} \right]^{0.5}\end{equation}
RESULTS AND DISCUSSION
Cultivar calibration
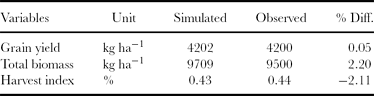
Table 3 shows the values of seven genetic coefficients for AS-2002 (wheat variety) obtained by fitting the model output against the observed data of wheat yield from the field experimental trials. The range of these parameters lies within the values reported by various researchers (Himanshu et al., Reference Himanshu, Singh, Hussain, Hussain, Munnankarni, Mahesh, Minh-Long and Ladha2007; Rezzoug et al., Reference Rezzoug, Gabrielle, Suleiman and Benabdeli2008; Rinaldi, Reference Rinaldi2004; Yang et al., Reference Yang, Watanabe, Zhang, Hao and Zhang2006). The values of these genetic coefficients are also within the range as reported in different studies for this region (Himanshu et al., Reference Himanshu, Singh, Hussain, Hussain, Munnankarni, Mahesh, Minh-Long and Ladha2007; Nasim et al., Reference Nasim, Ahmad, Wajid, Hussain, Khaliq, Usman, Hammad, Sultana, Mubeen and Ahmad2010). The calibration process revealed that model predicted grain yield well as difference between simulated and observed values was found to be 0.05% for the calibration treatment. The difference between simulated and observed biomass was also as low as 2.20%. There was also a good agreement between simulated and observed harvest index as difference was −2.11% (Table 4).
Genetic coefficients of wheat cultivar (AS-2002) used in CERES-Wheat model.

P1V: Days at optimum vernalizing temperature required to complete vernalization.
P1D: Percentage reduction in development rate in a photoperiod 10 h shorter than the optimum relative to that at the optimum rate.
P5: Grain filling period duration.
G1: Kernel number per unit canopy weight at anthesis.
G2: Standard kernel size under optimum conditions, related to kernel filling rate.
G3: Standard, non-stressed dry weight of a single tiller at maturity.
PHINT: Phylochron interval; the interval in thermal time between successive leaf tip appearances.
Simulated and observed results during model calibration with data recorded against treatment of 247 kg-urea ha−1 in 2009–2010.
Accuracy of the model simulations and performance of genetic coefficients were assessed by running the model for 2009–2010 against the yield data of all 12 treatments. The corresponding results are explained in subsequent discussions.
Model simulations for 2009–2010
The simulated results of grain yield data for 2009–2010 are shown in Table 5. In general, the model simulation was fairly well ranging from 0.05% for calibration treatments to 15.38% difference for humic acid treatments. Generally, simulated grain yield was in reasonable range for all treatments, showing difference of <10%. Highest error was found against treatment T11 (humic acid @ 2.47 L ha−1) because model was not calibrated for humic acid treatment. Similarly, model overestimated grain yield for control treatments, which received no urea fertilizer treatment. The average RMSE between simulated and observed values for 2009–2010 was found to be 244.7 kg ha−1, and the overall MPD was observed as 2.58%. These results show that genetic coefficients estimated for AS-2002 wheat variety were robust, and the model calibrated once for a cultivar can simulate the wheat yield data (Himanshu et al., Reference Himanshu, Singh, Hussain, Hussain, Munnankarni, Mahesh, Minh-Long and Ladha2007; Nasim et al., Reference Nasim, Ahmad, Wajid, Hussain, Khaliq, Usman, Hammad, Sultana, Mubeen and Ahmad2010; Rezzoug et al., Reference Rezzoug, Gabrielle, Suleiman and Benabdeli2008).
Comparison of simulated and observed grain and biological yield data (kg ha−1) for all treatments during growing season of 2009–2010 (calibration year).

aRoot mean square error; bmean percentage difference.
The CERES-Wheat model simulated biological yield with good agreement between simulated and observed biological yield data. Overall, the RMSE was observed as 538.91 kg ha−1, while the MPD was observed as 0.98%. Maximum difference between simulated and observed biological yield was found for T5 treatment receiving 173 kg ha−1. This difference may be attributed to spatial variability effects on wheat yield. The model simulated reasonably well for all other treatments (Table 5).
Model validation for 2008–2009 and 2010–2011
The CERES-Wheat model was evaluated by comparing simulated and observed yield data for 2008–2009 and 2010–2011 growing seasons. The corresponding results are shown in Table 6. There was a good agreement between observed and simulated grain yield data. The model simulated reasonably well for all treatments with difference ranging from −0.14 to −10.75% for 2008–2009 growing season, and −0.1 to −15.7% for 2010–2011 growing season. Overall, the RMSE was found as 242 kg ha−1, while the MPD was found as 6.48% for 2008–2009 growing season. The model simulated biological yield data well showing difference of less than 10%, which is reasonable as reported by Bakhsh et al. (Reference Bakhsh, Hatfield, Kanwar, Ma and Ahuja2004a) and Ahuja et al. (Reference Ahuja, Rojas, Hanson, Shaffer and Ma2000). The RMSE was 553 kg ha−1 and the MPD was 5%. This comparison shows that the model has the potential to simulate wheat yield data for an independent data set of the year.
Comparison of simulated and observed grain and biological yield data (kg ha−1) for all treatments during the growing seasons of 2008–2009 and 2010–2011.

aRoot mean square error; bmean percentage difference.
In case of simulations for 2010–2011 growing season, the overall RMSE was 471 kg ha−1 and the MPD was 11.45%. The model performance was relatively better for 2008–2009 growing season with average difference of 6.48% as compared with 11.45% for 2010–2011 growing season. This may be attributed to difference in precipitation, as during 2008–2009 growing season, 82.2-mm rainfall occurred compared with 49.3 mm of rainfall during 2010–2011 growing season. There was a good agreement between simulated and observed biological yield (Table 6). The model simulated wheat biological yield response for all treatments in a satisfactory way for both the seasons. Small deviations in the simulation results may be due to weeds and spatial variability effects, which were not considered by the model. Overall, the results showed that the performance of CERES-Wheat was acceptable during evaluation and validation under the given set of conditions. Similar results have been reported by different researchers (Himanshu et al., Reference Himanshu, Singh, Hussain, Hussain, Munnankarni, Mahesh, Minh-Long and Ladha2007; Irmak et al., Reference Irmak, Jones, Batchelor and Paz2001; Nasim et al., Reference Nasim, Ahmad, Wajid, Hussain, Khaliq, Usman, Hammad, Sultana, Mubeen and Ahmad2010; Rezzouq et al., 2008), so the model can be used further for decision-making regarding urea fertilizer applications. Nasim et al. (Reference Nasim, Ahmad, Wajid, Hussain, Khaliq, Usman, Hammad, Sultana, Mubeen and Ahmad2010) also reported that CERES-Wheat can simulate crop growth as well as yield data fairly well under semiarid conditions similar to those of the study area.
A comparison between observed and simulated wheat grain yield data has also been made in Figure 2 using 1:1 line. The data lie closer to 1:1 line, showing acceptable level of model prediction (Rezzouq et al., Reference Rezzoug, Gabrielle, Suleiman and Benabdeli2008).
Comparison of simulated and observed data for grain yield for three years.

Grain yield production function
Figure 3 shows a typical functional shape for the amount of urea fertilizer applied (kg ha−1) against grain yield (kg ha−1) of wheat for 2008–2009 growing season. The function starts with a relatively high slope, indicating that urea was used efficiently to increase grain yield when lesser doses of urea were applied. As applied urea increases, the slope diminishes as demonstrated by ∆Y1 being more than ∆Y2 for the same increment of urea fertilizer applications. In fact, as the function approaches maximum yield, the slope goes to zero. Beyond this point, additional increments of applied urea decreased the grain yield. Maximum grain yield of 4100 kg ha−1 was predicted at the application rate of 350 kg-urea ha−1. Beyond this level, wheat grain yield declined for increase in urea fertilizer applications.
Wheat grain yield production function for 2008–2009 growing season.

Similarly, a grain yield production function was simulated (kg ha−1) for 2009–2010 growing season (Figure 4). The function for 2009–2010 growing season showed similar trend as that shown for 2008–2009 growing season. There is relatively a steep slope at the start of the function, which decreased as the level of urea application increased. Maximum grain yield of 4600 kg ha−1 was predicted for urea application at the rate of 300 kg ha−1. The simulated functions showed that there would not be any increase in grain yield for further increase in urea application. Moreover, any further increase in urea fertilizer applications has been shown to decrease grain yield.
Wheat grain yield production function for 2009–2010 growing season.

Figure 5 shows a simulated grain yield production function versus urea fertilizer application (kg ha−1) for 2010–2011 growing season. The function showed similar trend as shown for other years. As the amount of urea fertilizer application increases, the corresponding increase in grain yield decreases, showing decline in grain yield and lower fertilizer use efficiency. Figure 5 shows that maximum grain yield of 5200 kg ha−1 was simulated at application of 340 kg-urea ha−1. Any further increase in urea for 2010–2011 showed negative effect on grain yield, resulting decrease in grain yield data.
Wheat grain yield production function for 2010–2011 growing season.

CONCLUSIONS
Based on the field experimental data and model simulations, following conclusions are drawn:
• The CERES-Wheat model simulated grain yield with 0.05% difference, biological yield with 2.20% and harvest index with 2.11% for the calibration treatment of 2009–2010.
• The model predicted grain yield and biological yield reasonably well for validation years 2008–2009 and 2010–2011. The average RMSE between simulated and observed grain yield was 242 kg ha−1 and 471 kg ha−1 for growing seasons 2008–2009 and 2010–2011, respectively. For biological yield, the RMSE was found as 553 kg ha−1 and 763 kg ha−1 for growing seasons 2008–2009 and 2010–2011, respectively.
• The wheat yield production functions versus urea application rates were simulated for three-year periods, 2008–2009, 2009–2010 and 2010—2011, showing that maximum grain yield was predicted at application of 300 to 350 kg-urea ha−1.
The study revealed that the CERES-Wheat model has the potential to simulate the effects of urea fertilizer application on wheat productivity; however, these wheat production functions need to be verified under field conditions.
Acknowledgements
The authors wish to express their sincere thanks to Pakistan Science Foundation (Project No. PSF/Res/P-AU/Engg. 53) for providing financial assistance, and University of Agriculture, Faisalabad, Pakistan, for their cooperation and assistance, to facilitate field experimental work at the Postgraduate Agricultural Research Station.



