





Introduction
Oldman saltbush (Atriplex nummularia Lindl.) is a woody perennial shrub that is highly adapted to saline, hot and arid conditions. It is a dominant species found in widespread communities over a 4000-km range in arid and semi-arid Australia (Parr-smith, Reference Parr-smith1982), where it commonly occurs on soils with moderate to high salinity and in regions receiving low and highly variable annual rainfall (typically <250–400 mm), with high evapotranspiration demand. It is used in arid and saline systems worldwide (Le Houérou, Reference Le Houérou1992). These environments are characterized by high summer temperatures, episodic rainfall and pulsed soil moisture availability. Natural recruitment of oldman saltbush is typically opportunistic, with seedling emergence occurring following significant rainfall events when soil moisture is sufficient, most often during cooler autumn–winter periods in Mediterranean-type climates (Nichols et al., Reference Nichols, Yates, Loo, Wintle, Stevens, Titterington, Moore, Dixon and Barrett-lennard2014). Vegetative growth is similarly driven by seasonal moisture availability and moderate temperatures (Descheemaeker et al., Reference Descheemaeker, Smith, Robertson, Whitbread, Huth, Davoren, Emms and Llewellyn2014).
Oldman saltbush plays a crucial role in providing feed for ruminants during droughts and when poor feed quality leads to nutritional gaps (autumn in Mediterranean-type climates), reducing the cost and reliance on supplemental feed, which constrains stocking rates and productivity of livestock systems (Ben Salem et al., Reference Ben Salem, Norman, Nefzaoui, Mayberry, Pearce and Revell2010; Norman et al., Reference Norman, Hulm, Wilmot, Shaer and Squires2016). Being both salt- and drought-tolerant, their adaptive capacity makes saltbush a valuable tool in sustainable land management strategies for challenging environments, and the widespread adoption of these shrubs could contribute to dryland salinity management and help mitigate soil erosion and land degradation (Louhaichi et al., Reference Louhaichi, Yigezu, Werner, Dashtseren, El-shater and Ahmed2016).
In 2015, AnamekaTM, a clonal oldman saltbush cultivar, was commercialized in Australia, based on selection for traits that improve the feeding value to livestock, namely greater biomass growth after grazing, higher energy value and improved palatability (Norman et al., Reference Norman, Hulm, Wilmot, Shaer and Squires2016). More than 6.5 million shrubs have been planted by farmers across Australia (Norman and Masters, Reference Norman and Masters2023). The adoption and large-scale cultivation of old man saltbush, including wild-types and seed lines derived from AnamekaTM have been hindered by challenges in achieving successful establishment through direct seeding and the high cost of stand establishment via seedlings or vegetative cuttings (Barrett-lennard et al., Reference Barrett-lennard, Frost, Vlahos and Richards1991, Reference Barrett-lennard, Norman and Dixon2016).
Current direct seeding methods for saltbush often result in unpredictable seedling establishment, with success rates as low as 5% not uncommon (Stevens et al., Reference Stevens, Barrett-lennard and Dixon2006). The highest success is achieved by a combination of sowing with a specialized raised-niche seeder, use of black paint (to increase niche temperatures) and vermiculite mulch (Malcolm and Allen, Reference Malcolm and Allen1981). While these methods may result in up to 35% germination success, the methodology is far too complex for widespread commercial uptake (Barrett-lennard et al., Reference Barrett-lennard, Norman and Dixon2016). Germination of oldman saltbush seed is influenced by seed morphology, and various abiotic environmental factors, including temperature, salinity and moisture. These factors vary substantially under field conditions in arid environments and interact to determine the timing and success of germination events (Nichols et al., Reference Nichols, Yates, Loo, Wintle, Stevens, Titterington, Moore, Dixon and Barrett-lennard2014). Understanding these factors is essential for optimizing field establishment and improving cultivation practices.
Oldman saltbush propagules consist of a seed encapsulated within a pericarp, surrounded by two persistent bracteoles. The bracteole margins are flat and of soft papery (chartaceous) consistency, while the centre, where the seed is located, is swollen, thicker and of a hard-wooden texture (Uchiyama, Reference Uchiyama1987). Saltbush bracteoles are very heterogeneous in shape and size, and it is not infrequent for them to contain underdeveloped seed, or no seed at all. Previous testing (see Supplementary material) of saltbush seedlots has found a mean percentage of filled seeds of around 50%, with small propagules averaging only 38% filled. We found size, weight and density overlapped too strongly between filled and empty propagules for effective separation with current seed sorting equipment, which relies on either differential density between propagules with seed and without seed (e.g. airflow separator), different size (e.g. sieves) or different shapes (e.g. indented cylinders). This means that direct-seeding operations inherently deliver a variable, but likely high, number of empty fruits to the soil. This low and variable seed fill percentage likely contributes to the historically low establishment rates reported for the species.
Another factor that may contribute to poor field establishment is that bracteoles are believed to restrict germination in saltbush species via a combination of mechanical inhibition and chemical/physiological mechanisms (Donaldson, Reference Donaldson1990; Abu-zanat and Samarah, Reference Abu-zanat and Samarah2005; Stevens et al., Reference Stevens, Barrett-lennard and Dixon2006). In oldman saltbush, bracteole removal increased seedling emergence from shallow pot sowing (Louhaichi et al., Reference Louhaichi, Hassan, Missaoui, Ates, Petersen, Niane, Slim and Belgacem2019), though high rates of empty propagules complicate quantification. Extracts from bracteoles have also shown germination-inhibiting properties (Campbell and Matthewson, Reference Campbell and Matthewson1992). Various germination-enhancing methods have been tested, including pre-treatments, bracteole removal, light exposure and growth regulators like gibberellic acid and kinetin (Donaldson, Reference Donaldson1990; Abu-zanat and Samarah, Reference Abu-zanat and Samarah2005). While bracteole removal consistently improved germination, other methods showed limited success outside controlled conditions (Stevens et al., Reference Stevens, Barrett-lennard and Dixon2006).
There is limited comprehensive research on the optimal germination conditions for oldman saltbush, particularly in the context of varying temperature and water potential. Previous studies have predominantly focused on field observations and general germination traits without delving into the specific physiological responses of different seed lines under controlled laboratory conditions. Several previous studies have investigated the germination requirements of single oldman saltbush lines under laboratory conditions. For instance, oldman saltbush seeds have shown optimal germination at temperatures around 10°C (Christiansen et al., Reference Christiansen, Norman and Andreasen2022) or up to 25°C (Sharma, Reference Sharma1976), with higher and lower temperatures significantly reducing germination rates (GRs) and percentages. This indicates that within the species, there may exist a range of germination optima across different lines. In some studies, germination under differing water potentials shows similar variation, with 35–40% successful germination below −1.5 MPa (the accepted reference value for the permanent wilting point, which is commonly used to represent severe drought stress; Sharma, Reference Sharma1973, Reference Sharma1976). In contrast, Ruiz and Parera (Reference Ruiz and Parera2013), instead, show only 16% germination under similar temperature and water potential. Data describing variation in germination associated with temperature and moisture in the soil would provide valuable insight into the ecological adaptations of oldman saltbush and help inform strategies for improving their establishment through timing of direct seeding relative to seasonal conditions.
With the goal of identifying seed lines best suited to direct sowing for establishment in dryland farming systems, this study aimed to characterize the germination responses of eight oldman saltbush seed lines under controlled laboratory conditions, and to understand the influence of maternal environment on seed morphological traits. We hypothesized that seed traits (bracteole dry weight, seed fill percentage and thousand seed weight [TSW]) would be primarily determined by maternal parent rather than year of collection. We hypothesized that GR and final germination proportion would decline at supraoptimal temperatures and increasingly negative water potentials, with lines significantly differing in the magnitude of response to these challenging conditions. Understanding these patterns, alongside existing knowledge of agronomic potential, persistence, nutritional value and palatability, will inform the selection of genotypes for nursery propagation and direct sowing in the field.
Materials and methods
Plant and seed material
Seeds used in this study were from an isolated nursery plantation set in cleared agricultural land near Tammin in Western Australia (31°38′00″ S, 117°29′00″ E). The eight female clones which produced the seed used in this study represent the highest ranked females of 60,000 assessed on agronomic traits (persistence, biomass production and recovery from grazing), nutritional traits (dry matter digestibility and crude protein) and relative palatability from the development of the AnamekaTM line (Norman et al., Reference Norman, Hulm, Wilmot, Shaer and Squires2016; Norman and Masters, Reference Norman and Masters2023). The nursery plantation contains tagged cloned female plants (>20 per cloned female), surrounded by 200 clones of a single selected male (male #87; Norman et al., Reference Norman, Hulm, Wilmot, Shaer and Squires2016; Norman and Masters, Reference Norman and Masters2023). Oldman saltbush is generally octoploid and dioecious (Sampson and Byrne, Reference Sampson and Byrne2012), the seed from each female is highly likely to represent an F1 population from both parents but individual seeds from the same female may be genetically diverse. This study uses seed from eight clonal female lines (labelled as A–G). The clones were generated from cuttings of nine superior shrubs, identified in grazed agronomy plots (male #87; Norman et al., Reference Norman, Hulm, Wilmot, Shaer and Squires2016; Norman and Masters, Reference Norman and Masters2023). Seeds used to determine seed and bracteole traits were collected in January 2022, 2023 and 2024 (mid-summer) so that the collected seed would be freshly matured on the plant from flowering in the previous September–November. Seed used in the germination studies was obtained from the January 2023 collection, and experiments were performed within 6 months of seed collection.
Propagules were collected by shaking/hand stripping them from 20 identified female clones and oven-dried at 40°C for 3 days. Seeds were cleaned by removing bracteole and pericarp from the seeds by gently rubbing the intact, dried fruits between sheets of corrugated rubber matting. Seeds were removed from the crushed pericarp material by vacuum separation (Agriculex, CB-1 small column cleaner) and checked under a stereomicroscope to ensure that there was no damage resulting from the cleaning process. All seed was sieved to remove any very small seed, and test batches were checked to ensure seeds were imbibing and germination was >95% under controlled conditions (15°C, water).
To determine variation in propagule traits, sets of four replicates of 100 randomly selected propagules were used from each collection year and seed line. Propagules were weighed (propagule dry weight), seeds were then manually extracted as above and counted, and seed fill percentage and TSW were recorded.
Germination experiments
GRs and percentages at varying temperatures were determined for each seed line. Four replicates of 20 seeds extracted from the pericarps were surface sterilized in 0.5% bleach (NaOCl) and deionized water for 10 s, followed by three rinses with deionized water. Protocol testing showed no reduction in GR or number under this treatment (measured at 15°C) as compared to unsterilized seed. Sterilized seed was placed onto a filter paper (Whatman Grade 1, 85 mm) in 90-mm Petri dishes containing 5 ml of deionized water and placed in sealed plastic containers (Décor “Match-UpsTM Clips” oblong 600 ml) to prevent evaporation. Protocol testing showed minimal water loss from petri dishes in sealed containers, even at 50°C, with daily checks over a 16-day period. Seeds were placed into incubators at constant temperature, in the dark (Model: TRI-360-1-SD; Thermoline Scientific, Australia) at 5, 10, 15, 20, 25, 30, 40 and 50°C. Seeds were checked for germination approximately every 24 h (exact time recorded), and all germinated seed counted and removed. A seed was considered germinated with the emergence of the radicle, provided subsequent root growth was also observed (≥3 mm radicle emergence) (Stevens et al., Reference Stevens, Barrett-lennard and Dixon2006). When no germination had been observed for 72 h, remaining seeds were considered ungerminated and visually inspected under a stereo-microscope to ensure they were viable (full and undamaged). Germination checks were conducted under dim white light, with dishes exposed for <5 min/day, an amount of light which would not impact germination response in this species (Stevens et al., Reference Stevens, Barrett-lennard and Dixon2006).
Rate and percentage of germination under varying water potential were ascertained in solutions made with Polyethylene Glycol (MW 6000) in distilled water. Using the calculations of Michel and Kaufmann (Reference Michel and Kaufmann1973, Reference Ramasamy2024), we calculated for water potentials of 0.0, −0.25, −0.5, −0.75, −1.0, −1.25 and −1.5 MPa at 15°C. This temperature was based on previous studies (Sharma, Reference Sharma1976; Uchiyama, Reference Uchiyama1981; Christiansen et al., Reference Christiansen, Norman and Andreasen2022) and protocol testing using line A. Solutions were checked using a dew-point potential meter (WP4C, Meter Group), and we measured at 0.0, −0.25, −0.49, −0.75, −1.03 and −1.26, −1.49 MPa, respectively.
As with the temperature response, seeds were surface sterilized and placed into Petri dishes containing a filter paper and 5 ml solution and then into sealed plastic containers. Seeds were incubated at a constant 15°C and 60% humidity. From 48 h, dishes were checked approximately every 24 h (exact time recorded) and all germinated seeds were counted and removed; germination was determined as described above.
Data analysis
Propagule and seed traits were analysed using analysis of variance (ANOVA) and linear models to assess variation among lines and years and relationships between traits. Post hoc pairwise comparisons of group means were performed using Tukey’s HSD test.
Final germinated proportions were obtained at each constant temperature or water potential regime and were interpreted as measures of germination potential under each treatment.
All parametric response models from within the drc R package (Ritz et al., Reference Ritz, Baty, Streibig and Gerhard2016) were tested for fit against cumulative seed germination curves. For both temperature and water potential germination, the three-parameter log-logistic function with a lower limit of 0 produced the best fit (as lowest Akaike information criterion [AIC] and residual standard error [RSE]).
The formula for the three-parameter log-logistic function with a lower limit of 0 is typically expressed as:
 \begin{equation}{\text{GR}} = \frac{d}{{1 + \exp \left( {b\left( {\log \left( x \right) - \log \left( e \right)} \right)} \right)}}\end{equation}
where d is the upper limit (i.e. the final germination percentage), e is the inflection point – the time when germination is at 50% of the final germination percentage (d) and b is the slope around the inflection point.
To capture variation in germination dynamics across the population, GRs for each Petri dish for the 30th and 50th germination percentile (GR) were obtained as the inverse of germination times, and they were set to 0 when germination was not achieved for the corresponding percentile (Bradford, Reference Bradford2005; Catara et al., Reference Catara, Cristaudo, Gualtieri, Galesi, Impelluso and Onofri2016). GRs were evaluated at two percentiles to capture variation in germination dynamics across the seed population without relying on a single summary statistic. The 50th percentile is the most widely reported index of GR, providing a population-level central estimate directly comparable across studies. The 30th percentile was included to characterize the behaviour of the faster-germinating fraction of the population, which is agronomically relevant as it captures the leading cohort of seedling emergence under rainfed field conditions, those most likely to establish successfully under marginal temperature or moisture conditions (Covell et al., Reference Covell, Ellis, Roberts and Summerfield1986; Bradford, Reference Bradford2002). Evaluating two percentiles also allowed the assumption of constant thermal time across the seed population (parallel slopes across germination fractions) to be tested empirically rather than assumed (Covell et al., Reference Covell, Ellis, Roberts and Summerfield1986).
Estimation of cardinal temperatures
Cardinal temperatures for germination, base temperature (T b), optimum temperature (T o) and ceiling temperature (T c) were estimated for each genotype at both 30% and 50% germination percentile using a segmented linear regression approach (Soltani et al., Reference Soltani, Robertson, Torabi, Yousefi-daz and Sarparast2006). For each genotype × percentile combination, GR data were partitioned into two segments using the temperature at which the maximum observed GR occurred as a preliminary estimate of T o. Temperatures at or below this point were assigned to the suboptimal segment, and temperatures at or above this point were assigned to the supraoptimal segment, with the temperature of maximum GR included in both segments. Ordinary least squares linear regression of GR on temperature was fitted separately to each segment.
 \begin{equation}\begin{gathered}
f\left( T \right) = \frac{{T - {T_b}}}{{{T_o} - {T_b}}}if{T_b} \lt T \leq {T_o} \hfill \\
f\left( T \right) = 1 - \frac{{T - {T_o}}}{{{T_c} - {T_o}}}if{T_o} \leq T \lt {T_c} \hfill \\
f\left( T \right) = 0\;{\text{if}}\;\text{T} \lt {\text{T}_\text{b}}\;{\text{or}}\;{\text{T}} \geq \;{{\text{T}}_{\text{c}}} \hfill \\
\end{gathered} \end{equation}
T b and T c were estimated as the x-intercepts (GR = 0) of the ascending and descending regressions, respectively, and T o was estimated as the temperature at which the two fitted regression lines intersected. Suboptimal thermal time requirements (θT) were calculated as the reciprocal of the ascending regression slope. The assumption of constant thermal time across germination fractions (parallel slopes between g = 0.3 and g = 0.5) was tested (F-test).
The water potential GR data were fitted to both linear and polynomial models from within the drcSeedGerm R package (Onofri, Reference Onofri2023) for each line, and the best-fitting model was selected based on the lowest AIC and RSE. Overall best fit was to a linear model. The linear function used is based on Bradford (Reference Bradford2002):
 \begin{equation}{\text{GR = }}\frac{{\max \left( {{\Psi _,}{\Psi _{\text{b}}}} \right) - {\Psi _{\text{b}}}}}{{{\Theta _{\text{H}}}}}\end{equation}
where Ψb is the base water potential threshold and θH hydrotime constant. The hydrotime constant θH was extracted directly as the fitted slope parameter, and Ψb was estimated as the x-intercept at both the 30% and 50% germination percentile. The assumption of constant θH across germination fractions (parallel slopes between g = 0.3 and g = 0.5) was evaluated by comparing additive and interaction models fitted by weighted least squares; the additive model was retained, and pairwise differences among lines in θH, averaged across germination fractions, were tested using Benjamini–Hochberg-adjusted contrasts.
Linear models of estimated cardinal temperatures were used to assess the effects of germination fraction and line on cardinal temperature estimates. Significance of fixed effects was assessed by ANOVA. Post hoc pairwise contrasts between germination fractions within each cardinal temperature, and among lines within each cardinal temperature were calculated. All data analysis and graph production were performed in R (version 4.4.2).
Results
Propagule traits
Propagules collected from the same mother plants in three different seasons (2022, 2023 and 2024) were analysed for propagule dry weight, seed fill percentage and seed weight (Table 1, Figure 1). All three traits showed a strong impact of maternal line, and all interacted with year of collection (p < 0.001).
Propagule and seed traits for eight saltbush lines collected across 3 years (2022–2024) from a single seed nursery site near Tammin, Western Australia

Table 1 Long description
Values are reported for eight lines, A to H, across years 2022, 2023, and 2024 for propagule dry weight in milligrams, seed fill percentage in percent, and thousand seed weight in grams, plus annual rainfall in millimeters. For propagule dry weight, line F is 18.32 plus or minus 0.44 in 2022, 15.34 plus or minus 0.46 in 2023, and 20.88 plus or minus 0.95 in 2024; the lowest values include line G at 4.93 plus or minus 0.18 in 2022 and 3.79 plus or minus 0.17 in 2023, and line D at 5.36 plus or minus 0.17 in 2024. Seed fill percentage ranges from 19.0 plus or minus 2.12 for line D in 2022 to 81.75 plus or minus 1.89 for line C in 2023; in 2024 the highest seed fill is line E at 76.25 plus or minus 1.11 and the lowest is line D at 24.25 plus or minus 2.25. Thousand seed weight ranges from 0.62 plus or minus 0.02 for line G in 2023 to 1.4 plus or minus 0.05 for line H in 2022; in 2024 the highest is line H at 1.31 plus or minus 0.02 and the lowest is line E at 0.72 plus or minus 0.01. Annual rainfall is 345.1 in 2022, 246.3 in 2023, and 297.7 in 2024. For each trait, an LSD value is listed as 1.129 for propagule dry weight, 7.765 for seed fill percentage, and 0.081 for thousand seed weight.
Notes: LSD (p ≤ 0.05) values are provided for comparing means across seasons within each trait. Data are mean (± SE), n = 4 reps of 100 bracteoles.
Propagule and seed of eight genotypes (labelled A–H) of Atriplex nummularia collected from Western Australia in 2023.

Propagule dry weight differed significantly line to line (p < 0.001) and although collection year alone was not a large contributor to variance (p = 0.591), there was a strong a genotype × environment interaction (p < 0.001). While propagule weight did vary across seasons, there were some consistent patterns regardless of interaction with year; line F consistently produced the heaviest propagules across all years, while lines G and D consistently showed the lowest propagule weights. Most lines showed their lowest values in 2023, which had very low rainfall, with particularly notable decreases in lines C and G.
Seed fill percentage also displayed temporal variation among lines, with collection year contributing most to the variation (p < 0.001). Lines E and C maintained relatively high fill rates across years (>66%), while line D consistently showed the lowest fill rates (<30%). Once again, the dry 2023 season was notable, generally associated with higher fill rates for most lines, with particularly dramatic increases in lines A (127% increase from 2022) and H (138% increase from 2022). However, these improvements were not maintained in 2024, where most lines showed intermediate values between their 2022 and 2023 performance.
TSW exhibited less pronounced genotype × environment interactions compared to other traits (p = 0.073); however, both year and maternal line significantly impacted seed weight. Lines H and D consistently produced the heaviest seeds across years, while lines G and E consistently showed the lowest seed weights. All lines showed their lowest seed weights in 2023.
Collection year was the largest contributor to the seed fill percentage, while the maternal influence was most important for both propagule and seed weights. The ranking of most lines remained stable across years, particularly those at the extremes for each trait.
Base (T b), ceiling (T c) and optimal (T o) germination temperatures, plus suboptimal thermal time requirements (θT) for eight Atriplex nummularia seed lines in water under differing continuous temperature regimes, as estimated from the segmented linear regression model in equation (2)

Table 2 Long description
Eight seed lines labeled A through H are listed with base temperature Tb, optimal temperature To, ceiling temperature TC, and sub optimal thermal time requirement theta T, each reported at the 30th and 50th germination percentiles. Tb values range from minus 2.00 to 1.51 at the 30th percentile and from minus 1.87 to 0.55 at the 50th percentile. To values by line are: A 22.6 and 18.1, B 21.7 and 20.1, C 24.8 and 22.2, D 24.5 and 21.6, E 24.1 and 20.2, F 25.3 and 23.7, G 22.5 and 20.3, and H 26.1 and 23.8, for the 30th and 50th percentiles respectively. TC values by line are: A 46.1 and 44.8, B 58.0 and 50.8, C 50.8 and 45.9, D 50.7 and 45.9, E 49.6 and 45.6, F 52.5 and 47.4, G 49.0 and 46.0, and H 52.1 and 47.0. Theta T values by line are: A 118 and 127, B 73.3 and 91, C 94.9 and 129, D 105 and 149, E 102 and 118, F 91.7 and 126, G 92.1 and 140, and H 83.3 and 117. Superscript letters appear next to To and TC values in several rows.
Notes: Data are presented for the 30th and 50th germination percentiles. Superscripts denote differences between lines of a parameter (p < 0.05). No significant differences were detected among lines for T b.
Effect of temperature on seed germination
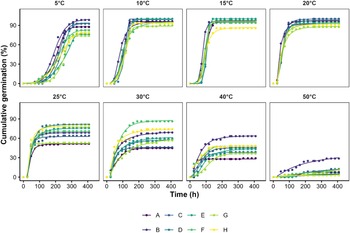
The germination response to temperature varied significantly among lines (p < 0.05), with all lines showing some successful germination across the tested temperature range (5–50°C), albeit with varying degrees of success, especially at the warmer temperatures (Figure 2). At 5°C, the lowest tested temperature, final germination percentages ranged from 74% to 98%, demonstrating substantial low-temperature germination tolerance in most lines. At 40°C, germination was reduced across all lines. Only three lines reached a final germination over 60% (A–C), with the least successful line (E) only achieving a 33% final germination. At 50°C, all lines aside from B had final germination percentage below 15%. Line B achieved 28.7 ± 2% final germination.
Cumulative germination percentage of eight Atriplex nummularia seed lines (A–H) collected from Western Australia in 2023. Germination is in water under differing continuous temperature regimes.

Figure 2 Long description
Eight small line graphs arranged in two rows of four. Each graph has the y-axis label, Cumulative germination percent and the x-axis label, Time in h. Top row, left to right. First graph title, 5 degrees Celsius. The x-axis runs from 0 to 400 with ticks at 0, 100, 200, 300, 400. The y-axis runs from 0 to 100 with ticks at 0, 30, 60, 90. Eight curves labeled A, B, C, D, E, F, G, H rise from near 0 and level off between about 70 and about 95 by around 250 to 350 h. Second graph title, 10 degrees Celsius. Same axis labels and tick pattern. Curves A to H rise steeply from near 0 to around 90 to 95 by about 100 to 150 h, then level off. Third graph title, 15 degrees Celsius. Same axis labels and tick pattern. Curves A to H rise steeply from near 0 to around 90 to 95 by about 80 to 120 h, then level off. One curve levels off lower, around 80 to 85. Fourth graph title, 20 degrees Celsius. Same axis labels and tick pattern. Curves A to H rise steeply from near 0 to around 90 to 95 by about 80 to 120 h, then level off. Bottom row, left to right. Fifth graph title, 25 degrees Celsius. Same axis labels and tick pattern. Curves A to H rise quickly from near 0 and level off between about 45 and about 75 by about 50 to 100 h. Sixth graph title, 30 degrees Celsius. Same axis labels and tick pattern. Curves A to H rise from near 0 and level off between about 35 and about 75 by about 150 to 300 h. Seventh graph title, 40 degrees Celsius. Same axis labels and tick pattern. Curves A to H rise from near 0 and level off between about 25 and about 60 by about 200 to 350 h. Eighth graph title, 50 degrees Celsius. Same axis labels and tick pattern. Curves A to H stay low. One curve rises to about 30 by about 400 h. The other curves rise to about 5 to about 15 by about 400 h. A legend below the plots lists A, B, C, D, E, F, G, H with matching line and marker styles.
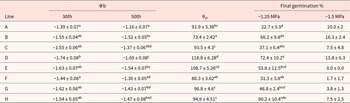
Base (Ψb) germination water potential and hydrotime constant (θH; MPa h−1) and final germination percentage (mean of 4 reps of 20 seeds) at 1.25 and −1.5 MPa for eight Atriplex nummularia seed lines collected from Western Australia in 2023 (A–H)

Table 3 Long description
Eight seed lines, A through H, are listed with base germination water potential for the 30th and 50th percentiles, hydrotime constant, and final germination percent at minus 1.25 MPa and minus 1.5 MPa. For line A, Psi b is minus 1.39 plus or minus 0.07 with superscript a at the 30th percentile and minus 1.16 plus or minus 0.07 with superscript a at the 50th percentile; theta H is 91.9 plus or minus 5.38 with superscript bc; final germination is 22.7 plus or minus 5.9 with superscript a at minus 1.25 MPa and 10.0 plus or minus 2 at minus 1.5 MPa. Line B: Psi b minus 1.55 plus or minus 0.04 with superscript ab and minus 1.52 plus or minus 0.05 with superscript bc; theta H 73.4 plus or minus 2.42 with superscript a; final germination 66.2 plus or minus 9.8 with superscript de and 16.3 plus or minus 2.4. Line C: Psi b minus 1.55 plus or minus 0.06 with superscript ab and minus 1.37 plus or minus 0.06 with superscript abd; theta H 93.5 plus or minus 4.3 with superscript c; final germination 37.1 plus or minus 6.4 with superscript abc and 7.5 plus or minus 4.8. Line D: Psi b minus 1.74 plus or minus 0.08 with superscript b and minus 1.69 plus or minus 0.08 with superscript c; theta H 118.8 plus or minus 6.28 with superscript d; final germination 72.4 plus or minus 10.2 with superscript e and 13.8 plus or minus 6.3. Line E: Psi b minus 1.63 plus or minus 0.07 with superscript ab and minus 1.54 plus or minus 0.07 with superscript bc; theta H 108.7 plus or minus 5.26 with superscript cd; final germination 53.8 plus or minus 12.5 with superscript bcd and 0.0 plus or minus 0.0. Line F: Psi b minus 1.44 plus or minus 0.06 with superscript a and minus 1.30 plus or minus 0.05 with superscript ad; theta H 80.3 plus or minus 3.62 with superscript ab; final germination 31.3 plus or minus 3.8 with superscript ab and 1.7 plus or minus 1.7. Line G: Psi b minus 1.62 plus or minus 0.06 with superscript ab and minus 1.43 plus or minus 0.07 with superscript bd; theta H 96.8 plus or minus 4.6 with superscript c; final germination 46.8 plus or minus 2.4 with superscript bcd and 3.8 plus or minus 1.3. Line H: Psi b minus 1.54 plus or minus 0.05 with superscript ab and minus 1.47 plus or minus 0.08 with superscript bcd; theta H 94.9 plus or minus 4.51 with superscript c; final germination 60.2 plus or minus 10.4 with superscript cde and 7.5 plus or minus 2.5.
Notes: The Ψb was estimated from germination rates fitted to equation (3) and is presented for both 30th and 50th germination percentiles. Superscripts denote differences between lines of a parameter (p < 0.05). Final germination at −1.5 MPa did not differ significantly.
Fitted curves of GRs at both the 30th and 50th percentile (Figure 3) were used to estimate the base, optimal and ceiling temperatures of germination as presented in Table 2. Lines did not differ significantly in T b, with all seeds having an estimated grand mean of −0.12 ± 0.24°C. Lines differentiated at T o, between both germination percentile and line, although ranking did not shift as the percentile effect was a uniform shift (p < 0.001). Line differentiation was most pronounced at T c, where four groupings were resolved. Suboptimal thermal time requirements (θT) differed significantly by line (p = 0.03; Table 2).
Germination rates (inverse of germination times) of eight Atriplex nummularia seed lines collected from Western Australia in 2023 (A–H) in water at eight constant temperatures for the 30th (green) and 50th (blue) percentiles, as derived by interpolation from the cumulative germination curves.

Figure 3 Long description
A set of eight small line graphs arranged in two rows of four, labeled A, B, C, D on the top row and E, F, G, H on the bottom row. Each graph contains two line series with circular point markers. The x-axis label is, Temperature (degrees Celsius). The x-axis runs from 0 to 60 with labeled ticks at 0, 20, 40 and 60. The y-axis label is, Germination rate (1 over time to reach x percent germination). The y-axis runs from 0.0 to 0.3 with labeled ticks at 0.0, 0.1, 0.2 and 0.3. Each sub-graph shows two series identified in a legend below the plots as, 30 percent and, 50 percent. In every sub-graph, both series start near 0.0 at 0 degrees Celsius, rise to a single peak between about 20 and 30 degrees Celsius, then decline toward 0.0 by about 50 to 60 degrees Celsius. A: The 30 percent series peaks a little above 0.2 near 20 degrees Celsius. The 50 percent series peaks around 0.15 near 20 degrees Celsius. B: The 30 percent series peaks just below 0.3 near 30 degrees Celsius. The 50 percent series peaks a little above 0.2 near 30 degrees Celsius. C: The 30 percent series peaks around 0.25 near 25 degrees Celsius. The 50 percent series peaks around 0.18 near 25 degrees Celsius. D: The 30 percent series peaks around 0.23 near 25 degrees Celsius. The 50 percent series peaks around 0.17 near 25 degrees Celsius. E: The 30 percent series peaks around 0.23 near 20 degrees Celsius. The 50 percent series peaks around 0.16 near 20 degrees Celsius. F: The 30 percent series peaks around 0.27 near 30 degrees Celsius. The 50 percent series peaks around 0.20 near 30 degrees Celsius. G: The 30 percent series peaks around 0.24 near 25 degrees Celsius. The 50 percent series peaks around 0.16 near 25 degrees Celsius. H: The 30 percent series peaks around 0.28 near 25 degrees Celsius. The 50 percent series peaks around 0.20 near 25 degrees Celsius.
Effect of soil water potential on seed germination
The effect of water potential was tested using PEG6000 to create a range of water potentials ranging from 0 to −1. 5 MPa (Figure 4). GRs and final germination percentage at 3 weeks for all the seed lines were significantly reduced with decreasing water potential (Figure 4, Table 3). Declining water potential did not impact final germination percentage in any line until −0.5 MPa, and at this level, final germination was only reduced in line H. Interestingly, line H does not appear to be the most sensitive line to more extreme osmotic stress, with four lines achieving equal or lower final germination percentages at −1.5 MPa. At our lowest tested water potential (−1.5 MPa), all lines aside from E did achieve some germination; however, germination did not differ significantly, with final germination percentages being very low (Table 3). Germination performance was far better at −1.25 MPa with B, D, E and H, all having final germination percentages above 50% (Table 3).
Cumulative germination percentage of 8 Atriplex nummularia seed lines collected from Western Australia in 2023 (A–H) at 15°C under differing water potentials produced by PEG6000.

Figure 4 Long description
The multi-line graph presents cumulative germination percentage for eight seed lines labeled A to H, collected from Western Australia in 2023, at 15 degrees Celsius under differing water potentials produced by PEG6000. The horizontal axis represents time in hours, ranging from 0 to 500. The vertical axis represents cumulative germination percentage, ranging from 0 to 100 percent. The six panels display water potentials of 0 MPa, negative 0.5 MPa, negative 0.75 MPa, negative 1 MPa, negative 1.25 MPa and negative 1.5 MPa. Each line is visually distinguished by different colors and markers. In the 0 MPa panel, all lines show rapid germination, reaching near 100 percent quickly. At negative 0.5 MPa, germination slows slightly, with lines A, C and D reaching higher percentages. At negative 0.75 MPa, lines begin to diverge more, with line D showing faster germination. At negative 1 MPa, germination rates decrease further, with line D still leading. At negative 1.25 MPa, lines B, D, E and H achieve over 50 percent germination. At negative 1.5 MPa, all lines show very low germination, with line E achieving the least. The graph illustrates how decreasing water potential impacts germination rates and final percentages, highlighting differences among seed lines.
Base water potential of germination (Ψb) was estimated (Figure 5, Table 3). The Ψb values differed between lines (p = 0.001) and with percentile (p = 0.002), being lower at the 30% percentile (more negative). Ranking between percentiles differed slightly, but the highest and lowest lines were the same regardless of percentile. Line A was the least tolerant to water deficit, having the least negative Ψb, regardless of percentile. Many of the lines had very low Ψb (<1.4 MPa), which was reflected by the high final germination percentage at −1.25 MPa (54–72%). Interestingly, of the lines with the most negative Ψb (B, E and D, all <1.5 MPa, the crop lower limit), only B and D showed some germination at −1.50 MPa, while line E had no seed germination, demonstrating a quick drop-off in germination ability between −1.25 MPa (where E was a high performer) and −1.5 MPa for this line. (Figure 4, Table 3). Hydrotime constants (θH; Table 3) estimated from the model showed a ∼ 61% difference between the fastest (line B) and slowest line (line D; Table 3). The θH was consistent between germination percentiles.
Germination rates (inverse of germination times) of eight Atriplex nummularia seed lines at seven water potentials created using PEG6000.

Figure 5 Long description
A line graph with the horizontal axis labeled, Water potential (MPa) and the vertical axis labeled, Germination rate (1 over time to reach x percent germination). The horizontal axis shows tick labels 0.0, minus 0.5, minus 1.0, minus 1.5. The vertical axis shows tick labels 0.000, 0.005, 0.010, 0.015, 0.020, 0.025. Legend text below the graphs reads, Germination percentile, 30 percent, 50 percent. 30 percent series coordinate pairs: (0.0, 0.013), (minus 0.5, 0.010), (minus 1.0, 0.006), (minus 1.5, 0.001) 50 percent series coordinate pairs: (0.0, 0.012), (minus 0.5, 0.009), (minus 1.0, 0.005), (minus 1.5, 0.001) The image B showing a line graph with the horizontal axis labeled, Water potential (MPa) and the vertical axis labeled, Germination rate (1 over time to reach x percent germination). The horizontal axis shows tick labels 0.0, minus 0.5, minus 1.0, minus 1.5. The vertical axis shows tick labels 0.000, 0.005, 0.010, 0.015, 0.020, 0.025. Legend text below the graphs reads, Germination percentile, 30 percent, 50 percent. 30 percent series coordinate pairs: (0.0, 0.022), (minus 0.5, 0.016), (minus 1.0, 0.010), (minus 1.5, 0.003) 50 percent series coordinate pairs: (0.0, 0.019), (minus 0.5, 0.014), (minus 1.0, 0.009), (minus 1.5, 0.002) The image C showing a line graph with the horizontal axis labeled, Water potential (MPa) and the vertical axis labeled, Germination rate (1 over time to reach x percent germination). The horizontal axis shows tick labels 0.0, minus 0.5, minus 1.0, minus 1.5. The vertical axis shows tick labels 0.000, 0.005, 0.010, 0.015, 0.020, 0.025. Legend text below the graphs reads, Germination percentile, 30 percent, 50 percent. 30 percent series coordinate pairs: (0.0, 0.016), (minus 0.5, 0.012), (minus 1.0, 0.007), (minus 1.5, 0.002) 50 percent series coordinate pairs: (0.0, 0.014), (minus 0.5, 0.011), (minus 1.0, 0.006), (minus 1.5, 0.001) The image D showing a line graph with the horizontal axis labeled, Water potential (MPa) and the vertical axis labeled, Germination rate (1 over time to reach x percent germination). The horizontal axis shows tick labels 0.0, minus 0.5, minus 1.0, minus 1.5. The vertical axis shows tick labels 0.000, 0.005, 0.010, 0.015, 0.020, 0.025. Legend text below the graphs reads, Germination percentile, 30 percent, 50 percent. 30 percent series coordinate pairs: (0.0, 0.015), (minus 0.5, 0.012), (minus 1.0, 0.008), (minus 1.5, 0.004) 50 percent series coordinate pairs: (0.0, 0.013), (minus 0.5, 0.011), (minus 1.0, 0.007), (minus 1.5, 0.003) The image E showing a line graph with the horizontal axis labeled, Water potential (MPa) and the vertical axis labeled, Germination rate (1 over time to reach x percent germination). The horizontal axis shows tick labels 0.0, minus 0.5, minus 1.0, minus 1.5. The vertical axis shows tick labels 0.000, 0.005, 0.010, 0.015, 0.020, 0.025. Legend text below the graphs reads, Germination percentile, 30 percent, 50 percent. 30 percent series coordinate pairs: (0.0, 0.015), (minus 0.5, 0.011), (minus 1.0, 0.007), (minus 1.5, 0.002) 50 percent series coordinate pairs: (0.0, 0.013), (minus 0.5, 0.010), (minus 1.0, 0.006), (minus 1.5, 0.001) The image F showing a line graph with the horizontal axis labeled, Water potential (MPa) and the vertical axis labeled, Germination rate (1 over time to reach x percent germination). The horizontal axis shows tick labels 0.0, minus 0.5, minus 1.0, minus 1.5. The vertical axis shows tick labels 0.000, 0.005, 0.010, 0.015, 0.020, 0.025. Legend text below the graphs reads, Germination percentile, 30 percent, 50 percent. 30 percent series coordinate pairs: (0.0, 0.018), (minus 0.5, 0.013), (minus 1.0, 0.008), (minus 1.5, 0.002) 50 percent series coordinate pairs: (0.0, 0.015), (minus 0.5, 0.011), (minus 1.0, 0.007), (minus 1.5, 0.001) The image G showing a line graph with the horizontal axis labeled, Water potential (MPa) and the vertical axis labeled, Germination rate (1 over time to reach x percent germination). The horizontal axis shows tick labels 0.0, minus 0.5, minus 1.0, minus 1.5. The vertical axis shows tick labels 0.000, 0.005, 0.010, 0.015, 0.020, 0.025. Legend text below the graphs reads, Germination percentile, 30 percent, 50 percent. 30 percent series coordinate pairs: (0.0, 0.019), (minus 0.5, 0.014), (minus 1.0, 0.009), (minus 1.5, 0.002) 50 percent series coordinate pairs: (0.0, 0.016), (minus 0.5, 0.012), (minus 1.0, 0.008), (minus 1.5, 0.001) The image H showing a line graph with the horizontal axis labeled, Water potential (MPa) and the vertical axis labeled, Germination rate (1 over time to reach x percent germination). The horizontal axis shows tick labels 0.0, minus 0.5, minus 1.0, minus 1.5. The vertical axis shows tick labels 0.000, 0.005, 0.010, 0.015, 0.020, 0.025. Legend text below the graphs reads, Germination percentile, 30 percent, 50 percent. 30 percent series coordinate pairs: (0.0, 0.017), (minus 0.5, 0.012), (minus 1.0, 0.007), (minus 1.5, 0.001) 50 percent series coordinate pairs: (0.0, 0.015), (minus 0.5, 0.011), (minus 1.0, 0.006), (minus 1.5, 0.001).
Discussion
This study demonstrates that germination in oldman saltbush is strongly constrained by interacting thermal and hydric thresholds. The estimated cardinal temperatures and base water potential provide a mechanistic framework for interpreting germination timing and environmental adaptation. As hypothesized, we found large variation in GR and ability within the lines, with these differences being most prominent under warmer or drier conditions. This intraspecific variation highlights the importance of seed trait diversity in shaping recruitment responses under variable environmental conditions.
Germination was strongly favoured at cooler temperatures, with sharp declines above 25°C and optimal rates and final percentages between 18.1°C and 23.8 °C. This thermal response is consistent with patterns reported across Mediterranean and semi-arid species, where germination is typically timed to coincide with periods of reliable soil moisture and reduced evaporative demand (Duncan et al., Reference Duncan, Schultz, Good, Lewandrowski and Cook2019; Cruz-tejada et al., Reference Cruz-tejada, Mattana, Rosbakh, Fernández-pascual and Carta2024). Our findings are broadly consistent with the only three prior studies we could find identifying germination optima for oldman saltbush. Each study only used a single oldman saltbush line, and all defined T o as simply the temperature that produced the highest germination percentage and/or rate; Christiansen et al. (Reference Christiansen, Norman and Andreasen2022) found optimal germination at a temperature of 10°C, Uchiyama (Reference Uchiyama1981) between 10°C and 20°C and Sharma (Reference Sharma1976) found optimal germination between 20°C and 25°C. These papers did not model T o; however, their variable findings that, in three different oldman saltbush lines, 10–25°C produced the highest germination percentage and/or rate highlight the potential genetic variability found within this single species. Our study refines the understanding of this earlier research by providing parameterized cardinal temperature estimates for multiple elite lines. Importantly, the use of cardinal temperature modelling allows direct comparison with other species, moving beyond descriptive optima to mechanistic parameters that underpin germination ecology.
Seeds tolerated moderate water stress well, with germination largely unaffected above −0.75 MPa. However, GR and proportion declined steeply at more negative potentials, becoming minimal by −1.5 MPa across all lines. Estimated base water potentials (Ψb) ranged from −1.16 to −1.69 MPa, indicating high intrinsic drought tolerance, though most lines failed to translate this into strong final germination percentage under extreme stress. This pattern is consistent with broader observations that many dryland species exhibit partial drought tolerance but require relatively narrow hydric windows for successful germination (Duncan et al., Reference Duncan, Schultz, Good, Lewandrowski and Cook2019).
The hydrotime and suboptimal thermal time constants varied among lines, indicating that lines differ not only in the thresholds needed for germination but also in the rate at which germination proceeds once that threshold is exceeded. This variation in thermal and hydrotime responses indicates that germination is constrained by both temperature and water availability, effectively restricting recruitment to narrow hydrothermal windows. This is consistent with broader seed germination theory in which temperature and water potential define the realized germination niche (Maleki et al., Reference Maleki, Soltani, Seal, Colville, Pritchard and Lamichhane2024). In Mediterranean-type environments, such as those oldman saltbush is native to, this pattern is widely interpreted as a drought-avoidance or risk-reduction strategy, conferring an advantage under transient moisture conditions in surface soils where the window of adequate soil moisture following a rainfall event may be brief (Dalziell et al., Reference Dalziell, Lewandrowski, Commander, Elliott, Erickson, Tudor, Turner and Merritt2022) and early cool season germination extends the window for root development before the onset of summer drought (Cruz-tejada et al., Reference Cruz-tejada, Mattana, Rosbakh, Fernández-pascual and Carta2024). Line B ranked lowest on both parameters, indicating a generalized capacity for rapid germination under both thermal and water stress – a dual advantage likely to be agronomically significant in dryland Mediterranean environments, where establishment windows combine suboptimal autumn soil temperatures with brief, shallow wetting events. Such a line is better positioned to exploit these narrow windows before moisture is lost to evaporation or conditions shift.
In saline soils, the osmotic component of soil water potential further reduces the water available for seed imbibition. Although oldman saltbush is a halophyte as an adult plant, its seeds are far less salt-tolerant than mature tissue (Christiansen et al., Reference Christiansen, Norman and Andreasen2022). Electrical conductivities typical of moderate to highly saline topsoils (4–16 dS m−1; Barrett-lennard et al., Reference Barrett-lennard, Bennett and Td2008) correspond to potentials of approximately − 0.2 to −0.6 MPa, so even moist soils may expose seeds to an effective water potential threshold where germination will be slowed or reduced. Under drier saline conditions, combined osmotic and matric potentials may easily exceed −1.0 MPa, approaching or surpassing the Ψb values we observed. Our results help explain why surface-sown saltbush seed rarely establishes well on saline sites and are consistent with broader evidence that seed-stage salt tolerance is substantially lower than adult tolerance in many halophytes (Flowers and Colmer, Reference Flowers and Colmer2008; Gul et al., Reference Gul, Ansari, Flowers and Khan2013).
Likewise, our data expand on previous reports of water stress tolerance. None of our lines performed as well at very negative water potentials as found by Sharma (Reference Sharma1973), who showed oldman saltbush achieved ∼40% germination in a −1.5 MPa PEG solution. In this study, only line B outperformed the 16.25% germination achieved at −1.5 MPa by Ruiz and Parera (Reference Ruiz and Parera2013). Both previously published experiments were conducted at warmer temperatures (25°C and 20°C, respectively), so potentially there is a hydrothermal effect. Hydrothermal experiments on a single oldman saltbush line showed differing responses, with germination percentage lowering with increasing temperature from 15°C to 20°C at −0.8 MPa, but increasing with temperature at −1.5 MPa (Sharma, Reference Sharma1976). Differences between studies may reflect genotype, seed quality or hydrothermal interactions, reinforcing the importance of integrating both temperature and water potential when interpreting germination responses. While the present study did not include a full hydrothermal factorial design, the observed responses suggest temperature-water interactions that warrant further investigation.
The strong effects of maternal line and genotype × environment interactions observed across all seed traits indicate that both genetic background and seasonal conditions play key roles in shaping seed quality (He et al., Reference He, Vidigal, Snoek, Schnabel, Nijveen, Hilhorst, Bentsink and Bentsink2014). Such intraspecific variation is increasingly recognized as an important mechanism of ecological resilience, allowing populations to maintain recruitment across variable environments (Fernández-pascual et al., Reference Fernández-pascual, Mattana and Pritchard2019; Saatkamp et al., Reference Saatkamp, Cochrane, Commander, Guja, Jimenez-alfaro, Larson, Nicotra, Poschlod, Silveira, Cross, Dalziell, Dickie, Erickson, Fidelis, Fuchs, Golos, Hope, Lewandrowski, Merritt, Miller, Miller, Offord, Ooi, Satyanti, Sommerville, Tangney, Tomlinson, Turner and Walck2019). Reduced propagule and seed weights in the hotter and drier 2023 season are consistent with constrained maternal investment under drought conditions. Prior studies show that seed performance is acquired during seed maturation and is shaped by the maternal environment, with temperature often exerting the strongest effect and genotype-specific responses being common (Bezodis and Penfield, Reference Bezodis and Penfield2024). Despite these seasonal effects, the relative ranking of lines remained largely stable across years, particularly for extreme phenotypes, indicating persistent genetic control over trait expression alongside environmental modulation (He et al., Reference He, Vidigal, Snoek, Schnabel, Nijveen, Hilhorst, Bentsink and Bentsink2014; Geshnizjani et al., Reference Geshnizjani, Snoek, Willems, Rienstra, Nijveen, Hilhorst and Ligterink2020). This stability, combined with strong maternal effects on propagule and seed weight, suggests that selection of superior lines for propagation can be robust across variable environments, although performance may be moderated under severe climatic stress. In variable environments, this heterogeneity may function as a risk-spreading strategy, enhancing population persistence by distributing germination across time or conditions rather than concentrating all recruitment in a single window (Mojzes et al., Reference Mojzes, Kalapos and Kröel-dulay2021; Abley et al., Reference Abley, Goswami and Locke2024; Van den Elzen and Emery, Reference Van den Elzen and Emery2025).
Native Australian shrubs such as oldman saltbush are well adapted to arid environments, yet their very small seeds constrain reserves available for emergence and early seedling survival, particularly under stress. From an ecological perspective, this is not unexpected, as long-lived perennial species often minimize intense competition from offspring by dispersing numerous very small seeds rather than investing heavily in individual propagules (Hamilton and May, Reference Hamilton and May1977). Small seed size also limits the depth from which seedlings can emerge (Williams, Reference Williams1968; Zu-xing and Wei-ming, Reference Zu-xing and Wei-ming2019). For saltbush, these traits create practical challenges for commercial establishment. Successful emergence requires extremely shallow sowing (<10 mm), which is difficult to achieve reliably with conventional seeding equipment. The shallow sowing needed for these very small seeds is also risky, as the soil surface is subject to significant moisture and temperature variation; even seeds sown to 10–20 mm will likely experience large amplitudes of temperature and potentially soil moisture over the germination and establishment phase (Shaw et al., Reference Shaw, Barak, Campbell, Kirmer, Pedrini, Dixon and Frischie2020). The small seeds of this species (low maternal investment) indicate that a significant period of growth (enabled by access to soil moisture) would need to be supported to ensure survival over the first hot, dry summer season.
From an applied perspective, these constraints help explain why direct seeding of old man saltbush remains difficult. The narrow environmental requirement presents practical challenges within the Mediterranean mixed-farming context, as it puts optimal sowing of oldman saltbush in direct competition with timelines for sowing winter grain and pasture crops, however. The results of this study provide a physiological framework for improving the success of direct seeding programmes. To maximize establishment, sowing should be timed to coincide with cooler temperatures and adequate soil moisture (ideally above −0.75 MPa). Our data highlight specific seed lines (notably B–D) that consistently performed well across both temperature and water-stress gradients and exhibited relatively uniform germination timing, making them strong candidates for inclusion in nursery breeding programmes or deployment in large-scale perennial forage efforts. Although current commercial practice relies on propagated seedlings to overcome early establishment bottlenecks (Barrett-lennard et al., Reference Barrett-lennard, Norman and Dixon2016), our findings suggest that seed-based methods could be improved through better genotype selection and sowing protocols, potentially reducing establishment costs and expanding adoption.
Petri dish studies, while useful for isolating physiological thresholds, do not replicate the full complexity of field environments. The use of PEG to simulate water stress is commonly used; however, it may not truly mirror soil matric potential, and in this study, we did not account for impacts of diurnal temperature fluctuations, soil texture, seed/soil contact and soil vapour, along with microbial communities, all of which may impact GRs and percentages, as may seed maternal conditions. As a result, these parameters should be interpreted as indicative of physiological germination limits rather than direct predictors of field establishment, which is reliant not only on successful germination but also on emergence and establishment parameters (Lewandrowski et al., Reference Lewandrowski, Stevens, Webber, L Dalziell, Trudgen, Bateman and Erickson2021). Integrating these models with field-based observations will be essential for improving their predictive value.
By demonstrating how these germination parameters vary among seed lines, this study underscores the importance of intraspecific variation in shaping germination strategies under water-limited conditions. Such mechanistic understanding is increasingly important for predicting plant responses to changing climatic conditions, particularly in Mediterranean and semi-arid systems where shifts in temperature and rainfall patterns may alter recruitment dynamics. Overall, the findings indicate that successful germination of A. nummularia is likely to occur only under relatively narrow environmental conditions defined by both temperature and water availability. While these constraints present challenges for establishment, particularly in agricultural contexts, they are consistent with a strategy adapted to exploit predictable seasonal windows of opportunity. Future research integrating this hydrothermal framework with field emergence and seedling survival data will be critical for linking physiological thresholds with population-level outcomes.
Supplementary material
The supplementary material for this article can be found at https://doi.org/10.1017/S0960258526100221.
Acknowledgements
Thanks to Tony, Simon and Oscar York (Tammin, Western Australia) for hosting seed production sites and Ian Walsh and Sam Lehmann (Cranbrook Western Australia) for insights into direct seeding of saltbush systems. Thanks to Dustin and Lisa McCreery from Chatfield’s Tree Nursery in Tammin for longstanding industry collaboration.
Dr Ed Barrett-Lennard and Prof Kingsley Dixon offered valued advice. We appreciate the technical support from Matt Wilmot, Elizabeth Hulm and Paul Young in seed cleaning, maintenance of research sites and nutritional value testing across the wider saltbush improvement programme.
Thanks to Dr Graham Bonnett and the CSIRO Drought Mission for research support.
Funding statement
Some of the experimental work was supported by the “No More Gaps with Superior Shrub Systems Project,” co-funded by Meat and Livestock Australia and Australian Wool Innovation (L.LSM.0018).
Competing interests
The authors declare none.




 Open access

