I. INTRODUCTION
Zinc oxide (ZnO) is a semiconductor with a wide direct band gap of 3.37 eV, which has prompted extensive basic studies owing to its extensive applications in ultraviolet laser diodes,Reference Chu, Olmedo, Yang, Kong and Liu1 photocatalysts,Reference Wang, Fei and Zhang2 gas sensors,Reference Wang, Kang, Liu, Zhang, Huang and Wang3 light-emitting diodes,Reference Bao, Zimmler and Capasso4 and photoelectrochemical cells.Reference Unalan, Wei, Suzuki, Dalal, Hiralal, Matsumoto, Imaizumi, Minagawa, Tanioka, Flewitt, Milne and Amaratunga5 Among these studies, the synthesis of ZnO nanorods has been reported increasingly in recent years.Reference Yang, Zhao, Willander and Yang6 The traditional methods to synthesize ZnO nanorods are the vapor phase transport processes with the assistance of metal catalysts,Reference Xu, Sun, Dong, Yu, My, Zhang, Chua and White7 thermal evaporation,Reference Wang, Jin, Ouyang and Xu8 and template-assisted growth.Reference Yan, Li, Chen and Gao9 But these processes involve complex procedures, high-cost equipments, and rigorous experimental conditions (e.g., high temperature, accurate gas concentration, and flow rate).Reference Bhat10 It is therefore important to find a simple, low-cost, controllable, and low-temperature method for the synthesis of ZnO nanorods. The hydrothermal process, which has many advantages compared with other processes (e.g., the use of a simple setup, relatively low temperature, large area deposition, low cost, and environmental friendly features), is one of the most appropriate and effective strategies for synthesizing ZnO nanorods.Reference Baruah and Dutta11 The hydrothermal process is usually buffer layer/substrate independent,Reference Greene, Law, Goldberger, Kim, Johnson, Zhang, Saykally and Yang12 and the shape of the ZnO nanocrystals can be easily controlled through slight changes in temperature, duration of growth, concentration, and pH, as well as nature and thickness of the buffer layer, and location of the buffer layer/substrate.Reference Akgun, Afal and Unalan13 Although hydrothermal synthesis of vertical ZnO nanorods on ZnO,Reference Ohara, Mousavand, Sasaki, Umetsu, Naka and Adschiri14–Reference Unalan, Hiralal, Kuo, Parekh, Amaratunga and Chhowalla18 AZO,Reference Chung, Zapien and Lee19–Reference Lee, Kim and Yu21 and ITOReference Zou and Gao22 buffer layers has attracted much interest, there have been relatively limited studies of those on Ag buffer layer. Recently, Nozaki et al.Reference Nozaki, Sarangi, Sahu and Uchida23 have investigated selective growth of vertical ZnO nanorods on Ag films and Ag-patterned substrates by the hydrothermal technique, but they adopted the use of conventional precursor solutions and only considered the effect of thickness of the Ag films.
Therefore, in this paper, we focus on the shape control of ZnO nanocrystals grown by a simple hydrothermal process, which is similar in the reaction system to the method that was first reported by Yu et al.Reference Yu, Zhang, Han, Hao and Zhu24 but involves some modified details. More specifically, a heterogeneous Ag buffer layer was adopted to substitute the ZnO buffer layer, and the Ag layer/glass substrate was placed with the Ag layer facing down on the two zinc foils with a certain height rather than placed flat on the bottom of the sample vial. The influence of the buffer layer-related parameters, i.e., height, thickness, and annealing temperature, on the shape of the ZnO nanocrystals were systematically investigated, so as to provide some references for the controllable growth of ZnO nanorods.
II. EXPERIMENTAL DETAILS
Glass substrates (Sinopharm, Shanghai, China) were cleaned ultrasonically with anhydrous ethanol (C2H6O, analytical grade purity; Sinopharm, China), acetone (C3H6O, analytical grade purity; Sinopharm, China), and deionized water (Milli-Q Plus 185; Millipore Corp., Billerica, MA) each for 10 min and dried under high-purity (99.99%) nitrogen gas. Subsequently, Ag films with different thicknesses were deposited on the glass substrates with a Peltier cooled high-resolution coater (K575X; Emitech Co. Ltd., Ashford, Kent, UK) using an Ag target (99.99% purity; Hefei Kejing Materials Tech. Co. Ltd., Hefei, Anhui, China). The deposition chamber was evacuated to a base pressure of about 1 × 10⁻³ Pa and introduced high-purity (99.99%) argon gas. The working pressure and current were 35 Pa and 120 mA, respectively. A group of as-deposited Ag films (60 nm in thickness) were annealed for 1 h at 300, 400, and 500 °C in a tubular furnace (CVD(Z)-06/60/3; Hefei Risine Heatek Co. Ltd., Hefei, Anhui, China). During thermal annealing, high-purity (99.99%) nitrogen with a flow rate of 100 sccm was introduced into the furnace chamber.
Figure 1 shows the schematic setup of the simple hydrothermal process. Two zinc foils (Zn, 99.9% purity; Hefei Kejing Materials Tech. Co. Ltd, China) (0.2 mm in thickness and 7 mm in width) with a certain length (i.e., height) were vertically immersed in 24 mL of 5% (vol/vol) formamide (CH3NO, 99.9% purity; Sinopharm, China) aqueous solution in a 30-mL weighing bottle. The Ag-film-coated substrate was immersed in the solution and placed flat with the Ag layer facing down on the two zinc foils. The glass cover was tilted against the bottleneck to prevent contaminants and allow enough air into the bottle. The reaction was maintained at a constant temperature of 80 °C in a laboratory oven for 18 h. Finally, the substrates were taken out and rinsed with anhydrous ethanol and then dried in air at room temperature.
Schematic diagram of the setup for the simple hydrothermal process.

The shapes of ZnO nanocrystals were observed under a scanning electron microscope (SEM, EVO MA10; Carl Zeiss Co. Ltd., Oberkochen, Baden-Württemberg, Germany). The 3D images with root mean square (RMS) roughnesses of the films were scanned with an atomic force microscope (AFM, MFP-3D-SA; Asylum Research Corp., Santa Barbara, CA). The crystal structures of the films were examined in an x-ray diffractometer (XRD, D/max2500VB3+/PC; Rigaku Corp., Tokyo, Japan) with Cu Kα radiation (λ = 0.15406 nm). The optical properties of the films were measured with a spectrophotometer (UV-2550; Shimadzu Corp., Tokyo, Japan).
III. RESULTS AND DISCUSSION
A. Growth mechanism of ZnO nanorods
Due to the surface-passivated oxide layer, the oxidation of zinc by naturally dissolved oxygen in water is very slow.Reference Muster, Neufeld and Cole25 However, the presence of formamide can accelerate the spontaneous atmospheric oxidation process at room temperature to release zinc ions into the reaction solution through the formation of zinc–formamide complexes ([Zn(CH3NO)n]2+).Reference Yu, Zhang, Han, Hao and Zhu24 Heated in the oven, [Zn(CH3NO)n]2+ can be continuously supplied and decomposed into free zinc ions. As a result, zinc complexes (Zn(OH)2) occur and deposit on the buffer layer to form ZnO nuclei, leading to the growth of ZnO nanorods on the buffer layer/glass substrate. These can be represented by the following reactions:
 $${\rm{Zn + {{1 \over 2} O_2}}} + n{\rm HCON{{\rm H}}_2} + \rm{H_2}O \to {[{{\rm{Zn}}{({\rm{HCON{H_2}}}})_n}]^{2 + }} + 2{\rm{O{H^ - }}}\quad ,$$
 $${[{\rm{Zn{(HCON{H_2})}}}_n}]^{2 + }} \to {\rm{Z}}{{\rm{n}}^{{\rm{2}} + }} + n\,\,{\rm{HCON{H_2}}}\quad ,$$
 $${\rm{Z}}{{\rm{n}}^{2 + }} + 2{\rm{O}}{{\rm{H}}^ - } \to {\rm{Zn(OH}}{{\rm{)}}_{\rm{2}}}\quad ,$$
 $${\rm{Zn(OH}}{{\rm{)}}_{\rm{2}}} \to {\rm{ZnO_{(S)}} + {{\rm{H}}_{\rm{2}}}{\rm{O}}\quad {\rm{.}}$$
It is well known that the (002) plane of ZnO has the minimum surface energy. On the basis of surface energy minimization, ZnO crystallites from Zn(OH)2 nucleate along the c-axis and then grow into one-dimensional rodlike crystals.Reference Xu, Lu, Xie and Liu26 The nucleation between the ZnO crystal and the Ag layer/glass substrate is ascribed to heteronucleation. The Ag buffer layer has considerably low surface tensionReference Trushin, Kokko and Salo27 and can decrease the nucleation barrier by effectively lowering the interface energy between the crystal nuclei and the glass substrate, thus ZnO tiny crystallites can directly adsorb on the substrate and then nucleate along their own c-axis orientation.Reference Tong, Liu, Dong, Zhao, Zhang, Lu, Shen and Fan28 It is reported that there is a good lattice and symmetry match between ZnO and Ag in the corresponding planes, which may also be responsible for the preferred growth of ZnO nanorods.Reference Fan, Ding, Liu, Tian and Wang29 In fact, for a (111)-oriented Ag layer which has face-centered cubic structure, the (111) planes of Ag surface have a hexagonal two-dimensional lattice and can serve as templates for the close-packed basal plane of ZnO.Reference Liu, Wu, Cao and Chang30 Therefore, ZnO nanorods can grow in alignment along the c-axis on (111)-oriented Ag layers.Reference Liu, Wu, Cao and Chang30
It is noteworthy that the Ag layer facing down is also favorable for the oriented growth of uniform ZnO crystals, since the nuclei from homogeneous nucleation in the solution, which will combine into big particles, cannot deposit on the surface of the Ag layer to act as a new heterogeneous nucleation site.Reference Liu, Jin, Bu, Zhao and Liu31 Similarly, the impurities in the solution cannot accumulate on the Ag layer to affect the nucleation of ZnO crystals.Reference Park, Lee, Kwak, Seo, Kim, Choi and Han32 Moreover, compared with heating in a water bath, heating in the oven can provide a relatively stable environment without interference of external contaminations, resulting in formation of uniform ZnO nanorods.Reference de Moura, Lima, Moreira, Volanti, Espinosa, Orlandi, Pizani, Varela and Longo33
B. Effect of the position of the Ag buffer layer
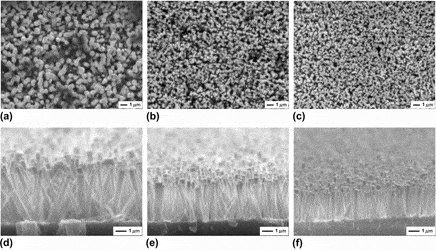
To investigate the effect of the position of the Ag layer/glass substrate, Zn foils with lengths of 5, 7, 10, 12, and 15 mm and Ag buffer layers with a constant thickness of 60 nm were used. That is, ZnO nanorods were grown on 60-nm-thick Ag buffer layers at heights of 5, 7, 10, 12, and 15 mm, respectively. Figure 2 shows the top-view and cross-sectional SEM images of the vertical ZnO nanorods grown on Ag layers at heights of 5, 10, and 15 mm. It can be noticed that the position (i.e., height) of the Ag layer/glass substrate has a significant influence on the three-dimensional (3D) size of the final ZnO nanorods. As Figs. 2(a) and 2(d) show, the nanorods grown on the Ag layer at a height of 5 mm have relatively larger diameter and length of 600 nm and 4.6 μm, respectively. With an increase in height to 10 mm, as revealed in Figs. 2(b) and 2(e), the average diameter and length of the nanorods decrease to 300 nm and 3.6 μm, respectively. By increasing the height to 15 mm, the diameter of the nanorods drops slightly [Fig. 2(c)], whereas the length decreases down to 2.6 μm [Fig. 2(f)].
SEM images [top (a)–(c) and cross-sectional (d)–(f) views] of the ZnO nanorods grown on 60-nm-thick Ag buffer layers at different heights: (a), (d) 5 mm; (b), (e) 10 mm; (c), (f) 15 mm.

The average diameters and lengths of ZnO nanorods grown on Ag layers at different heights were estimated by utilizing the top-view and cross-sectional SEM images, and the result is summarized in Fig. 3. It is indicated that continuous decreases in the diameter and length of ZnO nanorods emerge until the height of the Ag layer is increased to 12 mm. Afterward, the 3D size of nanorods exhibits unobvious changes with an increase in the Ag layer height. It is believed that the vertical concentration gradient of the formamide aqueous solution can be formed under the influence of gravity.Reference Chang, Levelt Sengers, Doiron and Jones34 As a result, the growth rate of ZnO crystals gradually becomes slower from bottom to top of the bottle due to the gradually decreased concentration of reaction solution.Reference Sun, Chen, Deng and Li35 Thus, as the height of the Ag layer was raised, the diameter and the length of ZnO nanorods got narrower and shorter. The almost constant 3D size of ZnO nanorods grown on the Ag layer at a height of 15 mm may be attributed to a small difference in concentration at a height higher than 12 mm.Reference Akguna, Kalaya and Unalana36,Reference Tsai, Shih, Wu and Meen37
Diameter and length of ZnO nanorods grown on 60-nm-thick Ag buffer layers at different heights.

C. Effect of Ag buffer layer thickness
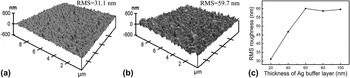
The buffer layer thickness, as reported by Kim et al.,Reference Kim, Lee, Jang, Kim, Cho, Park, Jang and Kim38 also affects the growth properties of hydrothermally grown ZnO nanorods. Figures 4(a) and 4(b) show 3D AFM images with a scanned region of 10 × 10 μm for the Ag buffer layers with thicknesses of 20 and 100 nm, respectively. The surfaces of both Ag layers exhibit rugged morphologies with some pyramidal shapes. However, the pyramids on the 100-nm-thick Ag layer are denser and larger than that on the 20-nm-thick one, resulting in a RMS roughness of 59.7 nm, which is almost two times greater than that of 31.1 nm for the 20-nm case. Figure 4(c) shows the variation of RMS roughness with the thickness of the Ag buffer layer. The RMS roughness sharply increased, reaching a maximum for the Ag layer with a thickness of 60 nm. Above 60 nm, no further increase in the RMS roughness was observed.
AFM images of Ag buffer layers with thicknesses of (a) 20 nm and (b) 100 nm. (c) The surface RMS roughness as a function of the thickness of the Ag buffer layer.

The Ag buffer layers with thicknesses of 20, 40, 60, 80, and 100 nm were located on two Zn foils with a constant height of 5 mm, and SEM images of the ZnO rods grown on them are presented in Fig. 5. It can thus be stated that the ZnO rods exhibit well-defined and regular growth changes in density and diameter with the thickness of the Ag layer. As shown in Fig. 5(a), a low Ag layer thickness (20 nm) results in formation of randomly inclined nanorods with an average diameter of ∼200 nm, which form flower-like clusters at some scattered sites that may correspond to the locations of the pyramids on the Ag layer shown in Fig. 4(a). When the Ag layer thickness was increased to 40 and 80 nm, ZnO nanorods were converted into dense and regular ones with average diameters of 350 and 800 nm, respectively, as seen in Figs. 5(b) and 5(c). The Ag layer with a high thickness (100 nm), whose surface contains denser and larger pyramidal shapes [Fig. 4(b)], breeds densely packed and vertically oriented ZnO rods with a microsized diameter (∼1.1 μm) as shown in Fig. 5(d). Therefore, it is thought that the growth of the ZnO crystals on the Ag layer proceeds along the surface morphology of the Ag layer as a template.Reference Kim, Kong, Cho, Park and Lee39
SEM images of the ZnO rods grown on 5-mm-height Ag buffer layers with different thicknesses: (a) 20 nm, (b) 40 mm, (c) 80 mm, and (d) 100 nm.

The results of the ZnO rod dimension variation with the Ag layer thickness are summarized in Fig. 6. It is clearly demonstrated that an approximate linear relationship exists between the increases of the Ag layer thickness and the rod dimension. Interestingly, the diameter increases gradually, whereas the length becomes constant above an Ag layer thickness of 60 nm. This implies that there is a critical Ag layer thickness, in which further increase will not have any role in the axial growth of ZnO rods.
Diameter and length of ZnO rods grown on 5-mm-height Ag buffer layers with different thicknesses.

D. Effect of the annealing temperature of the Ag buffer layer
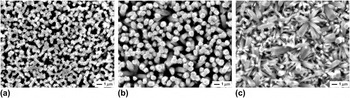
The effect of annealed ZnO buffer layer on the morphology of hydrothermally grown ZnO films has been reported.Reference Zhao, Kim, Lee, Heo, Shin, Ryu, Chang, Lee, Son, Lee, Jung, Tan, Zhao and Sun40–Reference Shim, Chang and Kim42 Here, by using the 60-nm-thick Ag buffer layers, which were annealed at 300, 400, and 500 °C and located on two Zn foils with a constant height of 5 mm, the effect of the Ag layer annealing temperature was evaluated. Figure 7 shows SEM images of ZnO nanorods grown on the annealed Ag layers. It can be noticed that the Ag layer annealing temperature is also an important factor to control the shape and size of the final ZnO nanorods. On the Ag layer annealed at 300 and 400 °C, vertically oriented ZnO nanorods with average diameters of ∼610 nm [Fig. 7(a)] and 730 nm [Fig. 7(b)] were observed. Compared with those on the unannealed Ag layer, as shown in Fig. 2(a), they both display relatively lower density, which may be relevant to the lower surface roughness of the annealed Ag layer. A similar result was explained by Cho et al.Reference Cho, Kim, Choi, Yim and Leem43 More interestingly, the randomly inclined nanorods with diameters of both ∼870 and ∼250 nm dispersedly coexist on the Ag layer annealed at 500 °C [Fig. 7(c)]. To understand the differences in the ZnO nanorods grown on different annealed Ag layers, SEM images of the unannealed and annealed Ag layers are shown in Fig. 8. It is indicated that the annealing treatment can integrate small grains to form larger ones, which will reduce the number of the particles, corresponding to the decreasing number of the nucleation sites of ZnO nanorods thereon.Reference Weigand, Skåre, Ladam, Grepstad and Weman44 On the other hand, it has been reported that the diameters of the ZnO nanorods depend on the particle size of the buffer layer.Reference Song and Lim45 Thus, the phenomenon that the decrease in the density of ZnO nanorods and the increase in their diameter with increasing buffer layer annealing temperature can be explained. The Ag layer annealed at 500 °C shrinked to some sparse island-like shapes, and even the glass substrates became visible [Fig. 8(d)]. It is well known that compared with the buffer layer, the glass slide has smoother surface and fewer defects,Reference Liu, Jin, Bu, Zhao and Liu31 which should be responsible for the formation of randomly oriented nanorods with a smaller diameter of ∼250 nm.
SEM images of the ZnO nanorods grown on Ag buffer layers (60 nm in thickness and at a height of 5 mm) with different annealing temperatures: (a) 300 °C, (b) 400 °C, and (c) 500 °C.

SEM images of (a) the as-deposited Ag buffer layer and the Ag buffer layers annealed at (b) 300 °C, (c) 400 °C, and (d) 500 °C.

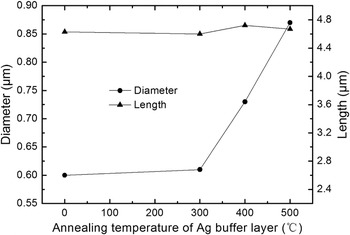
The 3D size variation of ZnO nanorods with the annealing temperature of the Ag layer is also summarized in Fig. 9, where the ZnO nanorods with the greater diameter were taken as the evaluative objects for the 500 °C case. The diameter of ZnO nanorods is slightly greater than that grown on the untreated Ag layer at first and then increases greatly with increasing annealing temperature of the Ag layer. The length of the ZnO nanorods remains in a narrow range of 4.6–4.8 μm, indicating that the length of the ZnO nanorods is not strongly influenced by the Ag layer annealing temperatures.
Diameter and length of ZnO nanorods grown on Ag buffer layers (60 nm in thickness and at a height of 5 mm) at different annealing temperatures.

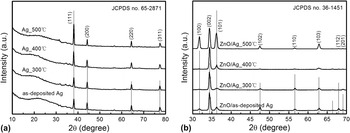
Figures 10(a) and 10(b) show the XRD patterns of different Ag buffer layers and ZnO nanorods, respectively. The presence of diffraction peaks can be used to evaluate the structural order at a long range or periodicity of the material.Reference Cavalcante, Marques, Sczancoski, Escote, Joya, Varela, Santos, Pizani and Longo46 As shown in Fig. 10(a), Ag phase was confirmed by the comparison between the XRD patterns and the respective Joint Committee on Powder Diffraction Standards (JCPDS) card (No. 65-2871).Reference Wang, Shi, Zhao and Du47 All the diffraction peaks can be assigned to the face-centered cubic structure. All the Ag buffer layers had a preferential orientation along the (111) plane and exhibited characteristic diffraction peaks corresponding to an ordered structure at a long range. The obvious broad peak in the range of 2θ from 15 to 35° may be attributed to the amorphous glass substrate.Reference Sato, Hara, Kuritani and Nishide48 Compared with the as-deposited Ag layer, the annealed Ag layers exhibited gradually increased (111) peak intensity with increasing annealing temperature, indicating that the crystallinity of the film improved effectively.Reference da Silva, Maia, Bernardi, Andres and Mastelaro49 With respect to the ZnO nanorods, as shown in Fig. 10(b), characteristic diffraction peaks corresponding to an ordered structure at a long range were also exhibited. All the diffraction peaks can be indexed to the hexagonal wurtzite structure of ZnO (JCPDS No. 36-1451) with lattice parameters a = 3.250 Å and c = 5.207 Å.Reference Lu, Wang, Li, Su, Kuang and Tong50 The sharp and strong (002) peaks indicate that the ZnO nanorods have a preferential c-axis orientation on the as-deposited Ag layer and the Ag layers annealed at 300 and 400 °C.Reference Unalan, Hirala, Rupesinghe, Dalal, Milne and Amaratunga51 Moreover, the intensity of the (002) peak increases with an increase in the Ag layer annealing temperature, which can be attributed to the better alignment as shown in the SEM images [Figs. 7(a) and 7(b)].Reference Liu, Chen, Wan, Ru, Li and Qu16 However, the (002) preferred orientation for the 500 °C case is unremarkable since the relative intensity of (I (002)/I (100)+(002)+(101)) is only 0.425, indicating the randomly oriented growth of ZnO nanorods, which is consistent with the SEM results [Fig. 7(c)].
(a) XRD patterns of the as-deposited Ag buffer layer and Ag buffer layers annealed at different temperatures; (b) XRD patterns of ZnO nanorods grown on the as-deposited Ag buffer layer and Ag buffer layers annealed at different temperatures.

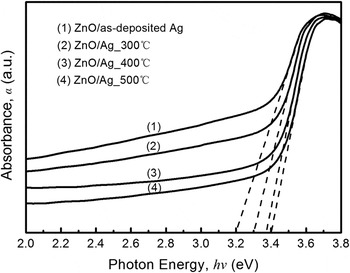
For the direct transition in a semiconductor, the relationship between the absorbance (α) and the incident photon energy (hν) can be expressed as (αhν)2 = A(hν−E g),Reference Pankove52 where A is a constant and E g is the optical band gap energy. Figure 11 shows the UV-vis absorbance spectra for the ZnO nanorods grown on the as-deposited and annealed Ag buffer layers. The optical band gap values were obtained through the linear fitting of tails from the UV-vis spectra. From the intercepts on the hν axis, the optical band gap values of the ZnO nanorods grown on the as-deposited Ag buffer layer and the Ag buffer layers annealed at 300, 400, and 500 °C were found to be about 3.20, 3.30, 3.37, and 3.40 eV, respectively. It is known that the exponential optical absorption edge and optical band gap are controlled by the structural order–disorder degree in the ZnO lattice.Reference Song and Lim45 The increase in the optical band gap value can be ascribed to the reduction of defects or impurities that give rise to the intermediary energy levels into the band gap of disordered ZnO nanocrystals.Reference Cavalcante, Simões, Espinosa, Santos, Longo, Varela and Pizani53 The ZnO nanocrystals grown on the as-deposited Ag buffer layer present a more structural disorder confirmed by a relatively smaller optical band gap value. The evolution of optical band gap value for the ZnO nanocrystals grown on the Ag buffer layers annealed at 300, 400, and 500 °C reveals the disappearance of some intermediate levels due to the gradual reduction of the structural disorder.
UV-vis absorbance spectra for the ZnO nanorods grown on the as-deposited Ag buffer layer and Ag buffer layers annealed at different temperatures.

Based on above results, by using this simple hydrothermal process and adopting suitable technological parameters, one can obtain well-aligned ZnO nanorods with various densities, sizes, and physical properties. It is well known that highly oriented ZnO nanorods are more valuable in a wide variety of applications. For some photoelectronic devices, e.g., field-emission devices, moderate density and high aspect ratio of ZnO nanorods are required. The simple hydrothermal process proposed here just provides the feasibility of synthesizing ZnO nanorods with various densities and aspect ratios, which are expected to meet the requirements of optoelectronic devices.
IV. CONCLUSIONS
In summary, a modified hydrothermal method for synthesizing ZnO nanorods on Ag buffer layers was proposed, and the effects of Ag layer-related parameters, i.e., height, thickness, and annealing temperature, on the shape of ZnO nanorods were systematically studied. The strategy of the Ag layer facing down is favorable for the vertically oriented growth of ZnO nanorods. Both the diameter and length of ZnO nanorods decrease with increasing Ag layer height to 12 mm and exhibit unobvious changes with increasing Ag layer height from 12 to 15 mm. A higher Ag layer thickness results in formation of ZnO rods with greater density, diameter, and length, and a critical thickness of 60 nm above which the length remains constant has been found. Furthermore, the density, the diameter, and the length of ZnO nanorods decreases, increases, and remains nearly invariable respectively with increasing Ag layer annealing temperature. However, randomly inclined nanorods with two different diameters dispersedly coexist on the Ag layer annealed at 500 °C due to the sparse island-like shapes of the annealed Ag layer. XRD results show that the ZnO nanocrystals grown on the as-deposited Ag layer and the Ag layers annealed at different temperatures present ordered structures at a long range. UV-vis spectra reveal that the optical band gap value of ZnO nanorods increases with increasing annealing temperature of the Ag layer due to the gradual reduction of the structural disorder. These results indicate that vertical ZnO nanorods with various densities, diameters, lengths, and physical properties can be attained by adopting suitable technological parameters, so as to meet the requirements of applications based on the shape control of ZnO nanorods.
ACKNOWLEDGMENTS
This work was supported by Young's Natural Science Foundation of Jiangsu University (Grant No. JDQ03008), the Senior Talent Research Foundation of Jiangsu University (Grant No. 13JDG045), the National Key Basic Research Development Program of China (973 Program, Grant No. 2011CB013000), the Jiangsu Province Research Innovation Program of College Graduate (Grant No. CXZZ13_0663), the Open Research Fund Program of Jiangsu Provincial Key Laboratory of Center for Photon Manufacturing Science and Technology, and a Project Funded by the Priority Academic Program Development of Jiangsu Higher Education Institutions.