

Edward Harris's (Reference Harris1979) landmark work, Principles of Archaeological Stratigraphy, from which sprouted the idea and practice of the Harris matrix, became my windmill (or albatross) in 2017 as I attempted to leverage its data visualization technique onto a digital archaeological site. This visualization would not only allow archaeologists to understand the composition and history of a digital built environment—something important to the emerging field of digital heritage—but also would contribute to the conservation and preservation of these born-digital archaeological sites.
This is not a new concern for people who work within the broad umbrella of “digital humanities.” “Software archaeology”—the attempt to reverse-engineer poorly documented (or undocumented) software in order to restore and preserve functionality—has existed formally for over 15 years.Footnote 1 Digital preservation is also not a new idea and forms a border of software archaeology; namely, what to do with software post-use or post-“excavation.”Footnote 2 None of the software archaeology approaches, however, treat software as archaeological sites in the traditional sense, and I wanted to see what would happen if I conducted a truly archaeological investigation of a software application using a tool known to many archaeologists. Simply put, can an archaeologist document the history of a software program using tools from the archaeologist's tool kit? Can an archaeologist contribute meaningfully to the discussion on software archaeology and preservation? Over the next few decades, I anticipate significant cross-pollination between archaeology and software engineering as humanity continues along its digital timeline. Any work that we can troubleshoot now can help future digital archaeologists with their investigations. I hope that this article on the software Harris matrix can assist with that preparation as an example of heritage futurism.
As a “classically trained” archaeologist, I've previously contended that video games are archaeological sites (Reinhard Reference Reinhard, Mol, Ariese-Vandemeulebroucke, Boom and Politopoulos2017), that the external media (when present) and the internal content combine to create a digital built environment and a material cultural entry into the contemporary archaeological record. Software programs, like traditional archaeological sites, change over time—changing in use, features, and functionality. These changes leave their mark in the dirt and in the code and can be recorded and ultimately visualized by the archaeologist. As we speed toward the twenty-second century, much of the construction in the Anthropocene will be synthetic instead of brick and mortar (or wattle and daub), with the built environments themselves leaving no worldly footprint despite requiring significant amounts of time, money, and labor to create and even though the technical infrastructure of the companies that create them will continue to sprawl. One of my main concerns with digital heritage is that if software is not documented, it will disappear once its term of use expires. Most software no longer relies on physical media, residing instead in “the cloud” awaiting purchase and installation. If the world lost power tomorrow, these programs and applications would disappear without a trace, leaving behind only shared human memory, a kind of intangible heritage that is lost in that dispersed cloud while various user groups scramble to recall their cultures in non-digital ways. Archaeologists are uniquely equipped to handle this issue while planning for a future where the remains of the past are invisible, incorporeal, and immaterial. I propose that the new Archaeology resides in the province of platform, media, and game studies, as we conduct archaeological investigations into environments and habitations built not out of mud brick but instead out of algorithms and code.Footnote 3 The research questions of traditional archaeological sites and their digital counterparts remain the same. Understanding a site's history via stratigraphy and visualizing that data remain crucial to the field archaeologist. As digital archaeology is still quite young, initial attempts to ground test terrestrial archaeological tools and methods must be done first in order to revise and replace them for documenting this new, electric environment. People spend as much time on their devices and in synthetic worlds (software) as they do navigating and inhabiting the natural world, and as such enable a digital material culture built on real time and materials. Because of this and the fact that software is both an assemblage and a thing, software must be considered a new type of archaeological site.Footnote 4
Thinking about software archaeologically, it has strata, interfaces (as Harris defines them), and follows the laws of stratigraphy (Harris Reference Harris1979). This article will walk the reader through Harris's original theory and will then apply his method used to visualize if the stratigraphy of a site can be used—not allegorically, and not as an analogy—for real archaeology of media. Granted, one could use version control and software build numbers to keep a software application's history straight, but these largely fail to provide a visual component to the data in order for archaeologists to recognize patterns in the appearance of bugs or what software creators spend the most time either fixing or improving (excepting a scant handful of programs such as gource.ioFootnote 5). Versioning organizes the strata, but visualizing the context of where each stratum appears in relation to other strata is something baked into the concept of the Harris matrix.Footnote 6 At the conclusion of this article, we will see that there are other possibilities for mapping software stratigraphy, but I felt it important to begin with a classic tool and method and to do something no one had done before (perhaps for good reason, as will be explained below).
The Harris matrix enables the archaeologist to understand a site better, especially when considering a site's chronology. The same can be said of software. The archaeologist can translate the data garnered from patch notes (as shown in the example below) or from code epigraphy and paleography into a visual mapping. The resulting Harris matrix of a software application can then be viewed in order to draw conclusions about its development history, a program's formation process over time. For archaeologists and developers alike, pattern recognition comes into play where one can see if bug fixes/patches skew consistently to a specific aspect of development. What always needs fixing, or what software elements are most often patched (or enhanced) over time? Seeing this knowledge presented graphically might help developers pay closer attention to those problem areas during initial development, saving time and money while producing a more stable, balanced product for the launch of v1.0. For archaeologists, the software Harris matrix does the same thing the Harris matrix does for traditional sites: it's a complex, visual chronology based on excavation data. Code archaeology does not provide the data visualization needed to understand the history of development or to see software as a spatial entity, or a site.
This article uses the video game No Man's Sky (Hello Games) as a test case, but the theory and method can be applied to any software program ever developed both now and in the future.Footnote 7
UNDERSTANDING STRATIGRAPHY OF NON-DIGITAL SITES
In chapter 5 of Principles of Archaeological Stratigraphy, Harris (Reference Harris1979) defines four laws of archaeological stratigraphy (which stem from the seventeenth-century geological work of Nicolas Steno), repeated here verbatim, followed by parallels to software:
1. Law of Superposition: In a series of layers and interfacial features, as originally created, the upper units of stratification are younger and the lower are older, for each must have been deposited on, or created by the removal of, a preexisting mass of archaeological stratification (Harris Reference Harris1979:30).
Harris (Reference Harris1979:30) goes on to explain this fundamental law: “The determination of superpositional relationships is of first importance in archaeological stratigraphy, as they define the interfacial relationships between the features and deposits of a site. . . . By recording superpositional relationships, the archaeologist amasses a body of data which will be of assistance in determining the stratigraphic sequence of the site.”
For software, then, we must think of strata as version numbers (I will discuss periodization and phasing a little later). Version 1.0 of a program marks the foundation of a site (although there will be traces of preliminary settlement in prerelease builds, which start with a version number of “0”). Later versions pile atop the original, forming not neat, standard layers of bug fixes and added features but instead creating a very organic map of change not unlike earth-locked strata. Some versions will fix bugs, while others will add features, and later versions will fix bugs caused by those added features.
With software, one may drill down through new code to get to the old code, sometimes assisted by a developer who has been rigorous in commenting on the code for future reference (the concepts of code epigraphy and paleography are outside the scope of this article). What the archaeologist is left with, then, are either the patch notes, lists of changes accompanying each version of a given piece of software, or copies of each version of the software that can then be compared to one another either superficially (i.e., changes in functionality) or by comparing the code underlying each version. These results can be translated for visual interpretation, as will be shown below.
2. The Law of Original Horizontality: Any archaeological layer deposited in an unconsolidated form will tend towards a horizontal position. Strata which are found with tilted surfaces were originally deposited that way, or lie in conformity with the contours of a preexisting basin of deposition (Harris Reference Harris1979:31).
When applying this law to software, perhaps the best example is bad code. If good code can be considered as “horizontal,” any bad code can be thought of as having been deposited at an angle, off-center, as part of the original deposition. Later code either repeats those bumps in an otherwise smooth topography or will correct these via various interfaces as will be described in a moment.
3. The Law of Original Continuity: Any archaeological deposit, as originally laid down, or any interfacial feature, as originally created, will be bounded by a basin of deposition, or may thin down to a feather-edge. Therefore, if any edge of a deposit or interfacial feature is exposed in a vertical view, a part of its original extent must have been removed by excavation or erosion, and its continuity must be sought, or its absence explained (Harris Reference Harris1979:32).
This law may be applied to the media containing the executable code. A disk, therefore, is a “basin of deposition” into which the code is placed. The same could be said of a top-level directory, which exists only digitally and has no physical component. The software is deposited within this media basin, something that contains the stratified site/code.
4. The Law of Stratigraphical Succession: A unit of archaeological stratification takes its place in the stratigraphic sequence of a site from its position between the undermost (or earliest) of the units which lie above it and the uppermost (or latest) of all the units which lie below it and with which the unit has a physical contact, all other superpositional relationships being redundant (Harris Reference Harris1979:34).
The Harris matrix is based on this law, which describes how to begin to illustrate the stratigraphy of a site. Harris (Reference Harris1979:36) writes, “The primary object of the study of archaeological stratification is to place the units of stratification, the layers and the features, into their relative sequential order.” With archaeological stratigraphy, we seek to illustrate the historical phenomena locked in the strata: what happened, where, and when.
Creating a Harris matrix for software is little (or no) different than creating one for a traditional site. The same rules are followed. Elements in software code change over time, and these changes can be mapped based on themes/series present in software development. This will become clearer in the practical example illustrated below.
Harris (Reference Harris1979:52) provides the axiom that “all units of stratification have a time or date, measured in years, at which they were created.” Traditional archaeological sites deal with a more geologic sense of time, strata taking years to accumulate, punctuated by other events (e.g., earthquakes, fires, floods, etc.). As with most things digital, time is accelerated. Multiple versions of a software application can appear in the space of days, weeks, and months, rapidly creating complex stratigraphy.
So what does that look like? Harris (Reference Harris1979:54) cites another axiom: “Archaeological stratification is a combination of strata and interfaces.” The stratum has depth to it and contains the “stuff” of the deposit for a given period of time. The interface is the line separating different strata from each other. He continues, stating that “as a horizontal layer interface is equal to the extent of a deposit, the surface of which it forms, it is not usually necessary to distinguish it from the deposit when labeling the units of stratification. On occasion, it will be necessary to identify a part of this type of surface and record it as a separate unit of stratification” (Harris Reference Harris1979:55).
For software, this translates to different large elements of a patch release: bug fixes, improved functionality, and new features, for example. Each of these large-scale elements contains its own strata and interfaces between them. Mapping them together would muddle the stratigraphy, but a top-level Harris matrix can be created to bring everything together.
As with traditional sites, software also displays periodization and phasing. Traditional sites might contain levels from the Bronze Age, Iron Age, and later. One might consider these to be versions 1.0, 2.0, and so on, of that site. These gross ages can then be broken down into smaller units of measure: periods. For example, the Late Helladic Period was part of the Greek Bronze Age (1650–1060 BC). The periods are then further subdivided (e.g., LHI, LHIIA, LHIIB, etc.). Periods can also be less formal; namely, local periods in the history of a site including destruction, building, and additional construction on existing structures. These phases find an analog in software versioning, being the “points” in between major releases, v1.1 on the way to v2.0. Just as in traditional site stratigraphy, the same periodization and phasing exist with software and can be mapped based on data. Ultimately, this may be an application of a processual method to a cultural/historical goal (as one reviewer suggested), but I see no harm in this. At first glance, the main difference between cultural periodization and version numbers appears to be that while the former is fuzzy and formed through various cultural and social processes, software versioning has a hard/fixed beginning and end. For those involved in software development, however (as I was for 10 years following my master's in Greek archaeology), this is anything but the case. Items can get withheld from one patch and added to another, intrusions from one version into the next guided by executive decision-making and the requirements of the market/audience. Despite the background processes, each iteration of an application gets its version stamped on it, locking it into the digital strata.
MAPPING REMAINS IN SOFTWARE STRATIGRAPHY
Stratigraphy includes not only the strata and the interfaces connecting them but also what each stratum contains: artifacts, and more generally, remains. Harris notes three types of remains: indigenous, residual, and infiltrated. As with the rules listed above, I will repeat Harris's definitions below, followed by the software analog (pun intended):
1. Indigenous remains: These objects were made at about the time the formation of the layer in which they were found was deposited. The layer and the objects are considered to be contemporary.
Code, like earthly strata, contains artifacts, which appear during use. Two major examples include bugs and glitches that manifest from the original code, the code-authoring and on-screen manifestation driven by user agency as formation processes. The code and the bugs/glitches are contemporaneous; one begets the other. These issues get patched in later versions, the bug fixes stacking atop each other.
2. Residual remains: These objects were made at a much earlier time than the formation of the layer in which they were found. They may have been present in earlier deposits subsequently dug up to provide soil for the newer layer, or, they may have remained in circulation for a long period of time, as happens with heirlooms.
Perhaps the best example of residual remains in software is repurposed code. Code snippets (or entire blocks of code) can be lifted from one program and used in another. That repurposed code (code spolia?) is in and of itself an artifact and can contain bugs, etc., which are also remains. When placed into new code, these remains become residual.
3. Infiltrated remains: These objects were made at a later time than the formation of the deposit in which they were found and were introduced into that layer by various means, which may or may not be detected by a study of the stratification.
Bugs and glitches also fit into this class of remains. Future versions can introduce errors into the original code, the new code and the old code creating emergent behavior not anticipated by the developers and not caught through standard quality assurance and user testing. This nonstandard behavior “infiltrates” into the original software's premise, becoming an artifact—an intrusive one.
VISUALIZING DIGITAL STRATIGRAPHY
What does a software Harris matrix actually look like, and how can one create a matrix to visualize digital stratigraphy?
Commercial software is iterative, and each iteration (typically) comes with documentation in the form of patch notes. These notes detail what has changed in the software between versions. New versions (upgrades) add to the biography of the software, which is part of contemporary material culture. Taken together, the patch notes for a mature software application read like a history of a city that was once a village.
The archaeologist can imitate terrestrial archaeologists and excavate from the top down with the most recent (or final) version of a program, but it likely makes more sense to begin at the beginning and work up through the strata. The archaeologist has the benefit of knowing how and when things began, and how they ended. The patches that happened in between can then be plugged in to get a complete sense of the growth of the software site. Therefore, software archaeologists dig up instead of down.
This works with commercial software that ships with complete documentation of functionality, features, and changes, but things get tricky with earlier software applications or more independent constructions. With these, one must be able to locate, install, and observe characteristics within every version of the program. When these programs ship on physical media, the difficulty of reading their stratigraphy becomes greater: one must find working copies and machines to run them on. Software released without a media package is marginally easier to study, but one must track down various versions, which may or may not be archived. And even when they are found, the chance that they will have attendant documentation is slim. The kind of code excavation and analysis needed is well documented by computer scientist John Aycock (Reference Aycock2016) in Retrogame Archaeology: Exploring Old Video Games, and digital archaeologists can learn a lot from his approach, especially to older software. My next attempt at documenting software stratigraphy without the aid of patch notes will follow his lead.
One can hope for some middle ground in lieu of patch notes: commented code. Some software engineers will add comments to the code as they write it, which can serve as a kind of road map to understanding how the code works. This commented code can be helpful in understanding stratigraphy, perhaps working in concert with actual (or accounts of actual) use testing and patch notes.
I will provide an example of the latter in creating a Harris matrix of the video game No Man's Sky (Hello Games 2016; hereafter NMS). Because this is the first time I have attempted to create a software Harris matrix, I wanted to use something well documented and familiar. I have put hundreds of hours into playing this game, which includes playing it on every patch released so far. The NMS patch notes are both detailed and complete. Granted, these conditions describe several of my favorite games from the past 35 years. What makes NMS special for this project is that (1) the game was the first major studio release to incorporate procedural content generation (PCG) to completely populate a universe-sized universe, everything from planets to buildings to music and language; (2) the expectations for such an audacious game were unprecedented and impossible to meet, especially for a company composed of a handful of developers; and (3) the game's release was delayed for three months, indicating that it was not as polished as it needed to be, yet it was launched anyway by distributor Sony for the PlayStation 4 (PS4) and on Steam for PC players. It is as if six very talented architects were given two years and tasked with building Rome by hand at the height of its empire, starting with only the bare ground and without the possibility of hiring more workers. I was curious to see how the game looked on the first day of its release, and how its software architects continued to build the game over the course of a year after its “foundation.” How would that translate to paper, and after the software Harris matrix was completed, could it be used to draw conclusions about the life of the game site? Might it offer insight to Hello Games on where they spent their time and materials in adding new functionality, upgrading existing functionality, and fixing bugs?
CASE STUDY: NO MAN'S SKY
No Man's Sky released on August 9, 2016 (US for PlayStation 4), August 10, 2016 (EU for PlayStation 4), and August 12, 2016 (worldwide for PC) as v1.0 and immediately required patching. As of the date of publication (April, 2018), the original game has been updated 13 times (1.03, 1.04, 1.05, 1.06, 1.07, 1.08, 1.09, 1.10, 1.12, 1.13, 1.20, 1.22, 1.23, 1.24) and is now well into the v1.3 update, “Atlas Rises,” which I hope to document soon. Hello Games designated the original game as “1” (before the decimal) and any major additions/changes as the first number immediately after the decimal (e.g., the “Path Finder Update” is v1.2x).
Reviewing the patch notes (Figure 1) for this game yielded data that could be translated graphically for a visual understanding of NMS development and growth. To break the game down:
1. Between versions 1.0 and 1.24 (inclusive) there have been over 550 individual updates. Each of these updates is a stratigraphic unit that has a home in a numbered update, which is a stratum. The strata stack atop each other, the earlier updates below the more recent ones, therefore in superposition.
2. Most NMS updates included at least one change in one of three categories: Bug Fix (F), Enhancement (E), and New Feature/Functionality (N). Bug fixes resolved (or attempted to resolve) issues in the game (e.g., crashes and other things that interrupted gameplay). Enhancements took existing features and functionality and either improved upon them (e.g., making rough textures smooth, making aiming easier) or “nerfed” them (reduced functionality to make things more fair during gameplay). New features and functionality added elements to the game that did not exist in prior versions (e.g., adding land vehicles, adding the ability to purchase freighters).
3. Each of the units in these three major types of game changes fell into one of 15 subcategories, which I was able to discern during my review of the patch notes: gameplay, visuals, OS/hardware, crashes, load/save, controllers, user interface (UI), audio, glitches, login, memory, languages, procedural content generation (PCG), game engine, and user modifications (mods). Some software updates contained dozens of fixes in several categories, while other updates only fixed a few things. After reviewing the patch lists for each and every NMS update, I felt that I was able to begin creating the software Harris matrix. I needed to write out the rules first, however.
Beginning of the No Man's Sky patch notes. The full patch notes are available at DOI:10.5281/zenodo.1134549; stable URL: https://doi.org/10.5281/zenodo.1134548.

RULES FOR MAKING A SOFTWARE HARRIS MATRIXFootnote 8
According to Harris's book, there are only three relationships between units of stratification (those little numbered boxes that exist within the matrix):
1. Units have no stratigraphic connection.
2. Units are in superposition.
3. Units are correlated as parts of a once-whole deposit or feature interface.
For software, then:
1. Units are in the same patch/update but without stratigraphic connection (i.e., fixes, enhancements, new features).
2. Units are in superposition (i.e., enhancements of existing functionality/features).
3. Units are correlated as parts of a once-whole deposit or feature interface (i.e., fixes, enhancements, or features of a similar type within the same patch).
Every box is a unit within a stratum. While the traditional Harris matrix uses mostly (or entirely) numbered rectangles, the software Harris matrix uses three shapes (Figure 2):
• Squares: Bug fixes
• Triangles: Enhancements
• Circles: New features/functionality
Software matrix symbols.

Each unit, no matter what shape (square, triangle, or circle), gets assigned a sequential number. The number corresponds to a text description of the bug fix, enhancement, or new feature/functionality, which is listed separately from the visual matrix. The numbering begins at one and starts with the first unit in the first numbered software update. Unit numbering increases sequentially counting by ones, with higher-numbered units appearing in the upper strata, connected by lines (or not) as dictated by one of the three relationships as defined above.
The software Harris matrix has left, top, and bottom margins. Software version numbers appear at the left margin, the early versions at the bottom and later versions above. The date of the update's release is placed underneath the version number. Versions are divided by a solid horizontal line, which designates the interface between any two strata (versions). If the size of an update is known (in KB, MB, or GB), that size translates to stratum thickness. Thicker strata indicate major updates (e.g., NMS v1.2’s Path Finder Update), as opposed to thinner strata, which indicate minor patches (e.g., v1.24).
The top and bottom margins list each of the subtypes for a given software application. The names are repeated at top and bottom for the sake of clarity. If the matrix is simple, omit either the top or bottom legend. Dotted vertical lines run from top to bottom of the matrix to separate the subtypes.
When populating the software Harris matrix, units are placed in their appropriate strata (X-axis) and columns (Y-axis), grouped together by type. Vertical lines of superposition connect related units between various strata. Horizontal lines designate correlation between similar types of updates within a given stratum. Modest text can be added to define groups of units within a stratum.
There are two possible ways to create a software Harris matrix for an entire game: (1) the universal approach, and (2) the typological approach. The universal approach maps the entire software stratigraphy as a whole, which can be unwieldy. For my case study of NMS, I am taking this approach in order to illustrate what this kind of matrix looks like. The typological approach creates smaller matrices based on either type or subtype. Perhaps one creates a software Harris matrix solely for bug fixes or just for enhancements. One can go a step further to create matrices that isolate certain subtypes. When finished, these typological matrices can then be combined to form a master, universal matrix.
Taking the First Leap: A Simple Example
One of NMS’s simpler patches, v1.24, contains four bug fixes (F), two enhancements (E), and one new feature (N). Here are the patch notes, which I have numbered sequentially and grouped by type and subtype (Figure 3):

Sample of simple software matrix for a small No Man's Sky patch.

The units drop into the so-labeled 1.24 stratum in their respective subtype columns. Units 557 and 558 share a continuity link (they are both crash fixes). Granted, this example doesn't look like much, but it's simple, and it's taken out of context/phase with the rest of the software updates that came before it.
One problem to consider with visualizing any kind of software development is how to handle/differentiate the fixes/enhancements/new features for the same program on multiple platforms (e.g., PlayStation 4, Xbox One, PC, Mac, mobile devices, etc.). Not all fixes in a given patch are applied across all of the platforms. There might be an additional way to illustrate those links, or perhaps to lightly shade the shapes of the effected units. It could be that one creates a top-level matrix, something that shows the splits and illustrates where some patches were applied to one platform but not to another.
UNDERSTANDING THE DATA BEFORE BUILDING THE SOFTWARE MATRIX
Although I had the patch notes, they were organized initially only by version number. It took some time to determine how each unit either was an enhancement (E), new feature (N), or bug fix (F). Going one step beyond, I also needed to determine what kind of update each unit represented (e.g., gameplay, visual, audio, crash, etc.). I then dumped everything into a spreadsheet and color-coded it by patch number (colored cells), type (grays), and subtype (colored text). The data organized in this way were extremely helpful when it was time to establish the relationship links, which I describe below (Figure 4).
Organized types and subtypes for the No Man's Sky patches. The full accounting for types and subtypes for each patch are available at DOI:10.5281/zenodo.1134551; stable URL: https://doi.org/10.5281/zenodo.1134551.

One column still needed to be populated: “Links To.” In order to do this, I had to create an index of terms from the patch notes’ descriptive text. I used the resulting set of 200-plus keywords to query against the descriptions in order to find out what things were tied to individual units (Figure 5).
The first 22 No Man's Sky keywords and related units. The full list of keywords can be found at DOI:10.5281/zenodo.1134553; stable URL: https://doi.org/10.5281/zenodo.1134553.

I was then able to hand-check each term (and each unit tied to each term) to determine if there was a relationship shared between two or more units. Even though several units might share a term, it did not mean that all of the units had a relationship.
DRAWING THE SOFTWARE MATRIX
Once the data was organized, I decided to hand-draw the matrix using graph paper, pencils, and a straightedge—analog tools for a digital problem, but this is no different than my field experiences in the 1990s taking notes and completing drawings by hand. It took me a week of nights to finish the software matrix, hand-drawing all of the levels, unit shapes, unit numbers, and finally links. As I drew, a number of niggling problems presented themselves, and I can only imagine Harris enduring the same kind of frustration during his early experimentation in the 1970s. The good thing about drawing the first iteration of a software matrix manually is that it allowed me to slow down and think about what I was doing. Drawing was very much a meditative act, and as tedious as it was, it was also helpful in forcing me to consider what I was doing, how, and why.Footnote 9
For the matrix, I decided to lump types together per each stratum. This meant that I drew triangles, then circles, then squares in each level. In hindsight, I should have grouped each type in their own rows; as it stands now, I might have two triangles and a circle on one row, topped by a row of all circles. I also realized that in some cases there were dozens of enhancements or fixes per level, so I had to stack the units within each stratum. Looking at the matrix now, I might have saved space taken up by the subtype columns by using color-coding, a different color per subtype, imitating the spreadsheet. In the future, this can be done easily with digital tools, but for the first experiment, I stuck with graphite only.
For the first pass, the tedium was a killer. Adding the relationship links was a whole other matter. As soon as I began to consider how to draw the links for v1.03 (the first patch), I knew I was stuck. With software, several fixes/enhancements work together and connect to several other fixes/enhancements. It's not a simple, linear thing. On many occasions, there was a fix or enhancement that served like a hub connecting other units that may or may not be related to each other in a meaningful way (other than sharing the stratum). With not a little horror, I realized that instead of a flat, 2-D matrix, maybe I should have done this as some kind of dendritic network, with hubs radiating units, instead of units stacked atop each other like blocks. These radiating hubs could still be locked into stacked strata, with arms reaching across levels as needed to later hubs of fixes. The greater issue at work lies in locking the stratigraphy down on paper. Software is a living organism ill-suited to being modeled as flat. The same could be said of archaeology itself, as the site being described occupies four dimensions (space-time), and archaeologists can continue to make connections to all of a site's levels long after its excavation and re-excavation. The 2-D, flat matrix might remain useful as an introduction to a site's (or program's) stratigraphy, but it does not go far enough in visualizing its complexity.
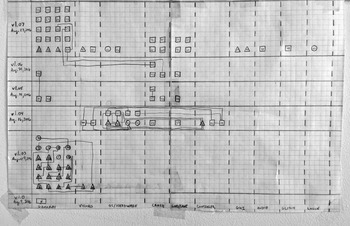
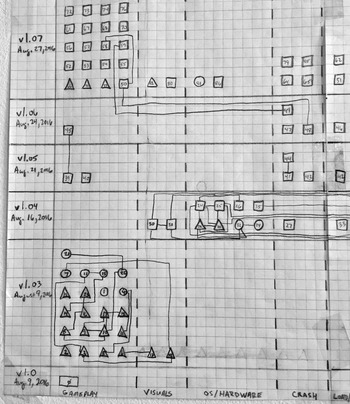
I did have at least one eureka moment as I searched for units that crossed stratigraphic boundaries (or interfaces). I found a few. In these instances—always with fixes—an earlier fix in one version would lead to a better, more permanent fix in a later version. For example, unit 49 (v1.06) links to unit 59 (v1.07). Both units describe saving large numbers of waypoints (geographic points of interest with a fixed latitude and longitude). Unit 49 describes a bug fix for a crash caused by saving too many waypoints. Unit 50 describes a gameplay bug fix, which improves upon the waypoint-saving system. The two units are connected across the interface between versions, one unit building upon the other across time, stacked directly atop each other.
For the most part—especially in later updates—the enhancements, new features, and fixes kept to themselves, occasionally linking to one another within their stratum but more often than not standing alone without linking to anything, just occupying the same layer. I was able to analyze all of the minor patches for links but did not do the two major updates of 1.1 and 1.2. There were going to be too many shared links, which would have made my drawing (more) unreadable. I could have done it digitally using a matrix-drawing program such as yEd or similar.Footnote 10
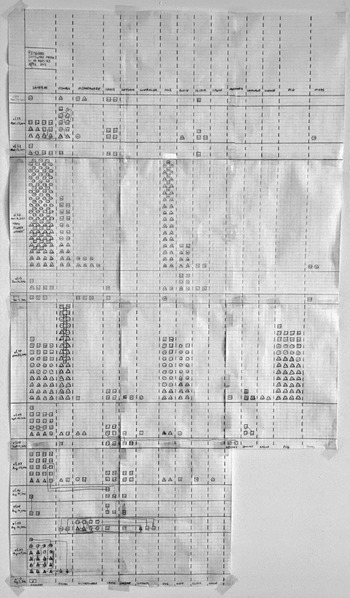
Looking at the finished version, it is possible to recognize patterns and to see how the updates came to be, understanding formation processes of software updates for the game. It is also possible to see the limitations of this software “Harris” matrix as drawn for the first time. There are some dangers of trying to use the analog for understanding something that is born-digital, and I can see now that I should have really been looking at the matrix not as a matrix per se, but as a helix, something 3-D and in the round, with links to F, E, and N instead of ACTG (as one finds in DNA), and other links anchoring the stratigraphic units from within the helix, passing through various labels. So while terrestrial stratigraphy can be visualized and mapped with a 2-D Harris matrix and a companion top section, software stratigraphy must (I now think) be realized in three dimensions, with the element of time occupying the vertical Y-axis. That will be another iteration to attempt in order to get beyond conjecture to arrive at a proof of concept.
I had fully intended to turn the matrix sections below into image maps with mouse-over text detailing the feature/fix represented by each numbered unit, but I cannot find a workable HTML plug-in that will do this. I have cut the matrix into sections for easier reading. The overall image is presented here to show the entire drawing (Figures 6–10).
Complete No Man's Sky software matrix.

Detail, No Man's Sky versions 1.03, 1.04, 1.05, 1.06, 1.07, with links. For example, note that for v1.03, gameplay unit 3 links to gameplay unit 11 and visual unit 22, all dealing with related aspects of creature diversity and appearance.

Detail, No Man's Sky versions 1.08, 1.09, 1.10. In this figure, there is one link from unit 87 (v1.08) to unit 94 (v1.09), which deal with continued improvement of loading corrupted save files. In this example, we see the resolution of one bug that is improved in two consecutive patches, hence the link.

Detail, No Man's Sky versions 1.12, 1.13, 1.20. Note that there are no links between any of these patches; each of the three patches deals with its own issues instead of improving upon past fixes/enhancements.

Detail, No Man's Sky versions 1.22, 1.23, 1.24. In v1.23, gameplay unit 514 links to visuals unit 517, two improvements in the same patch for the Colossus exocraft vehicle. Unlike the link in Figure 9, this link is horizontal (same patch, different functionality) instead of vertical (same functionality, different patch).

CONCLUSIONS
The purpose of the original Harris matrix in terrestrial (a.k.a. “dirt”) archaeology is to visualize the arrangement and relationships of strata chronologically. How do the layers of earth relate? What did these layers contain? The numbered rectangles correspond to data about each stratigraphic unit. A reader can look at a Harris matrix, gather data quickly by eye to get a feel for the site, and can then drill down through the data. Following this example, I think that I have accomplished the same thing with my software matrix: one can look at it for a general understanding of trends in the development of the game, can see the relationships between patches, and can then drill down into the data with specific questions.
At a glance, one can see that there have been a number of updates, including two major ones. These correspond to the thicker strata. Smaller updates are thinner. Next, the eye notices three shapes: circles, squares, and triangles. Some strata have all three. Some only have one shape. One can deduce that these latter patches with only one shape were rolled out to accomplish one thing, while other, larger patches covered more ground. By splitting each stratum into several sections (representing subtypes, e.g., gameplay, visuals, etc.), it is also easy to see immediately where the developers at Hello Games were focusing their efforts during post-release development cycles. For example, v1.2, the so-called Path Finder Update, focused largely on gameplay updates. Not only that, but it is also easy to visualize that v1.2 introduced a host of brand-new features. The earliest patches focused on enhanced functionality first, and later addressed bugs. For Hello Games, it would appear from the software matrix that their primary concern was largely a new and improved gameplay experience. There were bugs for sure, including ones that caused crashes, which Hello Games did address quickly. But gameplay was the main thing. I will explain why in a moment.
Based on the above observations from the data visualization, do the underlying data actually confirm what the eye discerns? For NMS, I broke down the patches into types and subtypes and have organized them in a spreadsheet (see DOI:10.5281/zenodo.1134551), the first tab showing all of the updates, followed by tabs dedicated to updates in each individual version.
Taking the patch history as a whole, it is easy to see that 41% of all items included in all of the patches were dedicated either to fixing, enhancing, or introducing new elements of gameplay. Compare that to the next level down, which is 14% for improving visuals and 11% for the user interface (UI). From there on down, it's single digits for other fixes, features, and enhancements. For the gameplay total stratigraphic units, these are nearly evenly split between fixes, features, and enhancements, and gameplay has the lion's share of each of these types when compared to the other subtypes in the list.
When one clicks on the tabs for individual versions, one can see that the data are accurately reflected in the matrix as drawn, and one begins to get a sense of how NMS has grown as a game and where the priorities were for Hello Games as they continued (and still continue) to release updates. Consider the dates of the patches (after all, a Harris matrix is all about site chronology). The first patch, v1.03, was released on the same day as the game itself. This game-day patch fixed and enhanced gameplay and visuals to the exclusion of everything else, ensuring that players would have a rewarding introduction to the game.
At first, the patches came quickly. Version 1.04 was released one week after the initial launch on the PlayStation 4. Version 1.05 deployed five days after that. Three days later saw the release of v1.06, and v1.07 dropped just three days later. Version 1.08 appeared after another eight days, and then players went two full weeks before receiving v1.09. Two months of relatively stable gameplay passed before the first major update, v1.10, arrived, making massive improvements not only to gameplay (20 units), but also to visuals (29 units), UI (11 units), audio (18 units), and especially procedural content generation (PCG, 36 units). The look and feel of the game changed in very positive ways, many of them subtle. Two updates appeared one week and two weeks after the debut of v1.10, and then three months passed while Hello Games worked on the Path Finder Update (v1.2), which arrived in March (Figure 11).
Promotional image for the Path Finder Update, No Man's Sky v1.2.

So what drove the creation and release of the patches, which includes two major updates? Throughout 2016 (and even two years prior), the hype surrounding NMS was huge. Many people were captivated by the way NMS promised to deliver on procedural content generation, creating a near-infinite, universe-sized universe in a box that created new worlds and life in the blink of an eye: a video game Big Bang. Hello Games had already delayed the launch of the game by nearly three months in the summer of 2016, focusing on improving gameplay. The launch and early weeks following the game's release found the player community polarized, either starry-eyed or disappointed based on the deliverables either meeting or failing to meet audience expectations. The crowd took to the internet to voice their concerns (and occasionally praise), and Hello Games (under distributor Sony's eye) began working around the clock to make the game better.
For the two major updates, many of the items in the patch lists for v1.10 and v1.20 derived from player suggestions: dedicated Photo Mode, base building, freighter acquisition, land vehicles, and custom skins (paint jobs) for crafts and structures. Hello Games continues to work on revising old content while creating new gameplay experiences, revealing more secrets to the game's universe with every update. Hello Games CEO Sean Murray and his team continue to try to meet and exceed player expectation with NMS. For Hello Games, gameplay is the thing in NMS. And this is what comes across in the software matrix: it's the social and cultural context of the data. And what are archaeology and stratigraphy without context?
As No Man's Sky progresses, I will update my matrix and spreadsheets with the new information and will provide updates online as they happen. After completing this first experiment in visualizing software stratigraphy, I do think the exercise has merit and provides insight into the formation processes that occur to make software what it is. Future attempts at matrices will be all-digital as I either make new tools or appropriate existing ones to handle matrix/helix design in 3-D.
FUTURE WORK
Perhaps the best way forward is to attack the problem of visualizing software stratigraphy in a more literal way, borrowing tools from geology, coming full-circle to the 1970s genesis of the geological theory underpinning Edward Harris's creation. Programs such as ArcScene go beyond ArcGIS in compiling 3-D visualizations of geologic relations in the subsurface (Carell Reference Carell2014:19). The digital archaeologist can assign different data types to different kinds of features and fixes in the software, the resulting map showing a topography of development across a plane dedicated to a particular version number. Underlying versions with related features and fixes could conceivably affect the topography of other layers, making peaks, valleys, and plateaus. If software is truly a site, or even a landscape, programs such as ArcScene will help visualize it.
The beauty of the Harris matrix (and its software derivative), however, is that it shows numbered units within each stratum, discrete packets of archaeological information. I am curious to see if it is possible to note these stratigraphic units inside a software application such as ArcScene (or even ArcGIS). How can we manipulate these tools to do what they want? Perhaps we can turn to open-source mapping software such as QGIS, modifying it to behave as a visualization tool for sites, levels, and units. The helix model I proposed earlier might benefit from adapting open-source software used for mapping and visualizing either DNA or proteins. Archaeology has always been interdisciplinary, so borrowing from the natural sciences should not seem too untoward.
EPILOGUE
On May 17, 2017, I participated in an online Harris matrix seminar given by its eponymous inventor, Edward Harris. I then sent him my work on the software matrix in order to see if he thought what I was doing had practical application for something not traditionally considered to be archaeology. Harris replied:
Dear Andrew,
Much of our world is composed of stratigraphic entities, if non-archaeologists realized that and in some instances turned to our archaeological principles to help to control their understanding of the development or building of the object at hand. Therefore, I am not surprised, but surely delighted, at your application of the principles and Matrix to the evolution of your software ‘site’. What you have done, in effect, is what many archaeologists have to do (or later researchers when the ‘digger’ is dead and left no stratigraphic sequence behind) after the fact of excavation: namely, make the stratigraphic sequence (if they can!)
That is to say that the implication of your project is that principles of archaeological stratigraphy can be applied to many situations, which, on first blush, are neither ‘real’ archaeology or stratigraphic entities.
I do encourage you to complete the project and to have a section of conclusions which suggests some of the ramifications of applying the archaeological-stratigraphic method to many other problems or research projects of many, many varied natures or substances.
Best wishes and thanks for a most interesting read.
Edward
Harris's comments gave me confidence to continue, as did a one-on-one conversation with James Taylor (University of York) who is a specialist in stratigraphy and who has spent many seasons reading and drawing the strata of Çatalhöyük. Although it did take some convincing, Taylor agreed that this kind of data visualization should be important for software, and that a three-dimensional approach might be best, not just for the stratigraphy of the digital but for traditional sites, too. As of this writing, there are no 3-D/helix matrix visualization tools, so anything developed to visualize software stratigraphy should be scalable to strata in the natural world. Digital built environments give us a sandbox in which to explore and, in the case of NMS, play.
Based on these encouraging comments, I would urge any archaeologist who is playing with methods and theories to write or talk to their inventors, should they still be alive. I have learned much from Harris and from Taylor and have shared my other proposed digital methods regarding archaeological fieldwork in synthetic spaces with Martin Carver and Steve Roskams. Every person I have approached has been willing to help, to offer insight and criticism, to make my work better. I should hope the same professional courtesy is extended to other students who are pushing the archaeological envelope.
Acknowledgments
The author wishes to thank Edward Harris, James Taylor, Sara Perry, Steve Roskams, Penny Spikens, and Shawn Graham for their willingness and patience to consider my arguments and methods in adapting Harris's matrix to fit digital built environments (DBEs). The author also thanks C. Martin Ramos for the Spanish translation of this article's abstract.
Data Availability Statement
All data were compiled by the author's case study from the software application, No Man's Sky, a game created by Hello Games for PlayStation 4, and from the patch release notes currently available from Hello Games here: https://www.nomanssky.com/release-log. The author's own compiled and organized data may be found in these public locations online:
Patch Notes and Links:
DOI:10.5281/zenodo.1134549
Stable URL: https://doi.org/10.5281/zenodo.1134548
No Man's Sky Patch Types and Subtypes:
DOI:10.5281/zenodo.1134551
Stable URL: https://doi.org/10.5281/zenodo.1134551
No Man's Sky Keywords:
DOI:10.5281/zenodo.1134553
Stable URL: https://doi.org/10.5281/zenodo.1134553