


INTRODUCTION
Are people conservative because they are Republicans? Or is it the reverse: people are Republicans because they are conservatives? Understanding the causal linkage between a citizen’s partisanship and issue positions—or the reverse—has vexed scholars for decades because the two concepts are so closely connected,Footnote 1 and available evidence often comes to differing conclusions (Achen and Bartels Reference Achen and Bartels2016; Box-Steffensmeier and De Boef Reference Box-Steffensmeier and De Boef2001; Brody and Page Reference Brody and Page1972; Markus and Converse Reference Markus and Converse1979; Page and Jones Reference Page and Jones1979). The resulting literature treats issue positions, ideology, and partisanship as highly connected, with good reason given these high correlations.Footnote 2 But the question remains as to whether citizens care deeply about policy and use their policy views to select their partisan affiliation or whether the average person sees partisanship as a social identity that then influences their political behavior and guides their views of contemporary issues.
Another way of putting this question of party versus ideology is to ask how sincerely held are expressed political and policy opinions and are these opinions based on ideological convictions or group loyalty? If issue positions are deeply held, then people’s views on those issues should be far less likely to move as a result of any stimuli (Bullock Reference Bullock2011). Moreover, there is strong evidence that once issue positions or economic evaluations are properly measured, the impact of partisanship diminishes significantly (Ansolabehere, Rodden, and Snyder Reference Ansolabehere, Rodden and Snyder2008; Lewis-Beck, Nadeau, and Elias Reference Lewis-Beck, Nadeau and Elias2008). Still others have shown that issue alignment is a strong predictor of vote choice, even after accounting for shared partisanship between voters and candidates (Jessee Reference Jessee2012). Furthermore, for the most sophisticated and ideological subset of the population—those who hold deep attachment to abstract principles that motivate their concrete issue positions—partisanship is relatively unimportant (Knight Reference Knight1985). Yet, previous scholarship has also identified the importance of partisanship. Party affiliation has been shown to be a social identity (Campbell et al. Reference Campbell, Converse, Miller and Stokes1960; Green, Palmquist and Schickler Reference Green, Palmquist and Schickler2004; Greene Reference Greene1999; Tajfel Reference Tajfel1981), to be a heuristic about policy views (Cohen Reference Cohen2003; Rahn Reference Rahn1993), and influence people’s issue attitudes (Layman and Carsey Reference Layman and Carsey2002). People have also been shown to take cues from the party leader’s positions (Lenz Reference Lenz2012).
While much has been said on both sides of this debate, all of this work has been hampered by the fact that it is very difficult to separate partisanship from issue positions or any ideological commitments that may result from those positions. The implication is that although multiple stories exist about the importance of partisanship relative to issues and ideology, the existing tests are simply not definitive and suffer from problems of causal identification and external validity.
The election of President Trump presents a unique opportunity for a real-world test that disentangles party attachment from issue commitment. There has never been a president (or any party leader) who shifts back and forth so often between liberal and conservative issue positions—presenting us with an opportunity to analyze citizen commitments to various policies while varying the ideological content of cues from a party leader in an externally valid way. To our knowledge, there has never been a similar opportunity to break the tight correlation between issue ideology (or constraint, as Converse Reference Converse and E. Apter1964 called it) and partisanship in such a valid realistic experimental setting. The Trump administration is worthy of study in many respects, but during the campaign and in the early days of his presidency, it was his ideological flexibility that presented political science with the clearest test of citizen loyalties to partisan attachment versus issue positions.
To take a highly simplified model, consider two key groups: partisan loyalists and policy loyalists. In this dichotomy, pure partisan loyalists are unswervingly loyal to their party, but they care very little (if at all) about the underlying issues endorsed by the party. Changing issue positions by a party causes no problem for these people as they simply adopt the party’s new position. Partisan loyalists merely take the party line on all issues—regardless of whatever that position might be. True policy loyalists, on the other hand, would behave in exactly the opposite fashion. These people exhibit high levels of issue constraint and should be highly loyal to the underlying principles and policies that arise from those principles. Loyalty to those ideas implies that policy loyalists should remain faithful to those principles regardless of which party or partisan leader espouses those views. Of course, most people likely fall somewhere between these pure types with a mix of partisan loyalty and ideological commitment.Footnote 3
Distinguishing these two types—partisan loyalists from policy loyalists—is, however, extraordinarily difficult outside of a contrived lab setting because partisanship and ideology virtually always run in the same direction. This is especially true in contemporary America. As long as Democrats are more likely to be liberal and Republicans are more likely to be conservative, it becomes extremely difficult to cleanly distinguish between these types. President Trump allows us to consider a field setting where partisanship and issue position are not so intimately linked because he defies ideological categorization—especially in the period under consideration in this paper: the 2016 campaign and the beginnings of his presidency in early 2017. President Trump regularly takes (and as a candidate took) multiple positions on multiple issues that are often ideologically distinct.Footnote 4
Using a novel survey experiment, we find that when told that President Trump supports a liberal policy, Republicans are substantially more likely to also endorse this policy compared to the same question with no mention of Trump’s position.Footnote 5 The same is also true, to a smaller extent, when Republicans are informed that Trump supports a conservative policy. Furthermore, these treatment effects vary across the population in ways that relate to previous research on the distribution of ideological constraint and cue-taking. Low-knowledge respondents, strong Republicans, those who approve of Trump, and even self-described ideological conservatives are the most likely to respond to the treatment condition in both a liberal and a conservative direction. The random presentation of President Trump as supporting liberal or conservative issue positions provides our experiment with excellent internal validity. However, the importance of this test for the long-standing question of the connection between party and ideology rests equally on the fact that this project has better ecological and external validity than previous experiments involving fictional candidate positions or vignettes because President Trump is the actual leader of a major political party and has actually taken each of the issue positions presented.
The implications of this paper are that many people react just as we would expect partisan loyalists to react. Many people’s expressed issue positions are malleable to the point of issue innocence (Converse Reference Converse and E. Apter1964), and self-reported, symbolic, expressions of ideological fealty are quickly abandoned for policies that—once endorsed by a well-known party leader—run contrary to the normally understood content of that ideological label. In other words, partisan identity is so powerful that a respondent’s self-labeled ideology is often at odds with their expressed policy positions when given cues from a party leader.
On balance, our results paint a picture of partisans who emphasize group attachment over issue positions. Though we emphasize that not everyone behaves this way. Among Republicans, the politically knowledgeable, those who do not approve of the cue giver, and self-described moderates and liberals are not all that likely to change their views when informed of President Trump’s positions. Still, in our experiment, it is difficult to overstate the importance of party loyalty. We conclude the empirical section of the paper by noting that for a one-dimensional model of ideological beliefs, being shown a “liberal” Trump’s policy positions moves Republicans nearly halfway toward the ideological distribution of pure independents. The implication of this unique test is that large, predictable segments of the public—partisans, the less-informed, approvers of the party leader, and even those who claim the most strong symbolic ideological labels—are likely to be influenced more by partisanship than by any issue content. This provides substantial evidence on the side of party influence over ideology on this long-standing question.
LITERATURE AND THEORY
Understanding the relationship between partisan loyalty as a group attachment versus partisan loyalty as a mere vehicle for ideological and policy-driven purposes is an old question with no consistent answers (Brody and Page Reference Brody and Page1972). For example, in the 1979 issue of The American Political Science Review, two articles appeared attempting to untangle the question of what was more influential—party attachment or policy preferences. Page and Jones (Reference Page and Jones1979) argued that “policy preferences appear to have much more influence on voting decisions, and party attachments much less, than was previously thought” and that “party identification may be influenced by short-term factors” (1071). Though definitive-sounding, this conclusion is undermined by the fact that using similar methods (a structural equation model), Markus and Converse (Reference Markus and Converse1979) reached a more or less opposite result in the same issue. Recently Achen and Bartels (Reference Achen and Bartels2016) said of this exchange, “if two teams of highly competent analysts asking essentially similar questions of the same data could come to such different conclusions, it seemed clear that the results of such exercises must depend at least as much on the analysts’ theoretical preconceptions and associated statistical assumptions as on the behavior of voters” (43).
The key question for operational ideology is the source of opinion consistency. Writing of the average citizen in 1964, Converse stated that the “mass is remarkably innocent” of the history of political ideas because people lack coherent attitudes and are separated from the elites by a “continental shelf.” Many scholars, like Achen and Bartels, suggest that the contemporary American public still resembles the landscape described by Converse more than fifty years ago as voters lack the ability to offer truly polarized, constrained opinions (Bafumi and Herron Reference Bafumi and Herron2010; Fiorina, Abrams, and Pope Reference Fiorina, Abrams and Pope2004; Hill and Tausanovitch Reference Hill and Tausanovitch2015). For example, Zaller and Feldman (Reference Zaller and Feldman1992) suggest that most citizens do not have well-formulated policy opinions but rather carry an often-conflicting assortment of ideas and judgments. Similarly, Freeder, Lenz, and Turney (Reference Freeder, Lenz and Turney2018) find that only a small minority of Americans today hold stable policy opinions on economic policy issues.
Many of those who suggest that voters hold stable opinions focus on partisanship and party attachment as a possible source of stability via the information party leaders send about the positions one should hold on various issues. The key point here is that partisans slowly take up the issue positions of their co-partisans leading to a kind of politics where everything is in reference to parties and partisan attachments (Jacobson Reference Jacobson2013). From this point of view, it makes sense to focus on the partisan cues that voters have and may (or may not) use. For example, Hill and Huber (Reference Hill and Huber2018) find that providing congressional vote margins on survey roll call questions increased the proportion of voters who “vote” in the same way as their co-partisan representatives in Congress. They suggest that in many cases, without this information voters lack sufficient information about the policies in question to have meaningful opinions. Similarly, others have found evidence of voters either deferring to the expertise of legislators in their policy views (Broockman and Butler Reference Broockman and Butler2017), or adopting the party’s position when informed of the position of the party (Bolsen, Druckman, and Cook Reference Bolsen, Druckman and Cook2014; Druckman, Peterson, and Slothuus Reference Druckman, Peterson and Slothuus2013). In fact, Lenz (Reference Lenz2012) found that in many cases people’s views on policy shifted altogether to align with the politician that they had previously decided to support, all because of the partisan cue.
The heart of our theory is based on the importance of these partisan cues and how different types of citizens will interpret the cues. For party loyalists, the cue from a party leader should matter a great deal, while for policy loyalists it should be near meaningless. There is a large volume of literature on cues that supports this idea—even if testing these ideas has been difficult until Trump. In a series of classic studies about cues, for example, Asch (Reference Asch1952) finds that assigning a particular source to a message fundamentally changes how individuals interpret such information because respondents use additional background knowledge or assumptions about the source as they consider the message. Partisanship is, of course, widely considered the most important of all political cues. In 1960, The American Voter pioneered the concept of partisan identity as a stable and important identity among American voters. Since then, scholars have shown that the influence and importance of partisanship among the general public has only grown (Bartels Reference Bartels2000) as partisans have become increasingly likely to vote for the candidate of their party over the last several decades. Over the same period of time, others have shown rising partisan loyalty among members of Congress, increasingly negative views of the opposite party among the masses (Dimock et al. Reference Dimock, Kiley, Keeter and Doherty2014; Iyengar, Sood, and Lelkes Reference Iyengar, Sood and Lelkes2012; Iyengar and Westwood Reference Iyengar and Westwood2015; Mason Reference Mason, Hopkins and Sides2015), and an ideological sorting in which Republicans are more likely to identify as conservative and Democrats are more likely to identify as liberals (Levendusky Reference Levendusky2009). Achen and Bartels (Reference Achen and Bartels2016) describe modern partisanship by stating, “unlike particular social identities tied to the special interests of groups, the reach of partisanship is very broad. For the voters who identify with a party, partisanship pulls together conceptually nearly every aspect of electoral politics” (268).
But the sorting of partisans into homogenous ideological camps leaves political scientists with a very difficult identification problem. Even if parties are ideological coalitions (Bawn et al. Reference Bawn, Cohen, Masket, Noel and Zaller2012), the cue is virtually always such that cue-givers are reinforcing both ideological positions and partisan positions at the same time. If the two concepts were in greater tension—as in the past (Noel Reference Noel2013)—then it might be possible to separate their influence. But in the modern ideologically sorted context, such identification strategies are essentially unworkable for most candidates, leaving political science in need of a unique situation for an externally valid test: a party leader who plausibly takes a wide range of positions across the ideological spectrum. Only in the context where it is plausible to find both “conservative” and “liberal” party-leader positions is the test really possible. Given the existence of these two types of cues—both liberal and conservative—how do respondents react to President Trump’s cue when he endorses a liberal policy position versus when he endorses a conservative policy?
A key part of our argument is that the election of Donald Trump, a candidate with a unique ideological approach, provides a unique opportunity to divorce the ideological direction of issue endorsements from the party that typically takes those positions.Footnote 6 Our central hypothesis is that the influence of a Trump cue will demonstrate the existence of a large bloc of party loyalists in the electorate when his influence moves opinion in either a liberal or conservative direction based on the cue. It is vital to note that we need to observe movement in both directions for it to be evidence of true party loyalty (see below).
Beyond this central hypothesis, we want to ask—who is most likely to be a party loyalist? Or, what characteristics will moderate the effects of the treatment? First, conventional wisdom would suggest that co-partisans and those who lack information or knowledge of the parties’ traditional issue positions would be quite likely to be influenced. These people have strong group attachments but weakly held ideological views and are likely unable to form a framework necessary to build a constrained ideology (Lupton, Myers, and Thornton Reference Lupton, Myers and Thornton2015). Observational evidence indicates that political knowledge is highly correlated with the levels of ideological constraint and issue consistency (Kinder and Kalmoe Reference Kinder and Kalmoe2017). Previous scholars have also shown that one important factor in the receptiveness of cues is the credibility and trustworthiness of the cue giver. Shared partisanship may serve to increase the perception of credibility and/or trustworthiness in the mind of the respondent (Nicholson Reference Nicholson2012). Second, those who approve of the cue giver should also be likely to be influenced by the cue (Lenz Reference Lenz2012; Lupia Reference Lupia1994), though not always in an effective way (Kuklinski and Hurley Reference Kuklinski and Hurley1994). Given their support and approval of the cue giver, these people should be more willing to adopt the positions of a political leader they trust. Finally, conventional wisdom would suggest that those who have a self-proclaimed, symbolic ideological commitment should be the most likely to stand pat against any partisan cue that runs contradictory to their ideological position. It is well known that such self-descriptions are correlates of vote choice (Levitin and Miller Reference Levitin and Miller1979; Stimson Reference Stimson1975) and issue attitudes (Jacoby Reference Jacoby1991, Reference Jacoby2000; Rudolph and Evans Reference Rudolph and Evans2005). These people have self-identified as being the most committed to the ideas and principles of either conservatism or liberalism. Given their strong attachment to these symbolic ideological labels, we would expect them to be especially reluctant to abandon the ideological camp they affiliate with in the face of an ideologically contradictory cue from the party that they also happen to affiliate with. This gives us four clear hypotheses about partisan loyalism.
Our null hypothesis is that the cue will have no effect within any of these subgroups, in essence that respondents should be firm enough in their own views that the cue has little effect on them and that there is little to no party loyalism in the electorate. Consistent with Zaller and Feldman (Reference Zaller and Feldman1992), we believe that certain other characteristics, described above, will mediate the cues. For instance, our knowledge hypothesis is that only the unknowledgeable should react to the cue and behave as party loyalists, presumably because the knowledgeable gain little from the treatment. They already have enough knowledge either to find their beliefs confirmed by the cue or hold fast to their beliefs if the new information contradicts their prior beliefs. The partisan hypothesis holds that those who strongly affiliate with the party of the cue giver should be more likely to be party loyalists. The approval hypothesis holds that those who approve of the cue giver should be more likely to be party loyalists. Finally, in the fourth hypothesis—the symbolic ideology hypothesis—self-described conservatives should hold firm to their presumed beliefs and be less likely to be party loyalists because they willingly identify with an ideological camp and as such likely adhere to the policy tenets of that group.
It is crucial to understand that for the hypotheses to show partisan loyalty, the sample must react in opposite directions to the liberal and conservative cues. For instance, if the less knowledgeable express more conservative views in the face of a conservative Trump cue and more liberal views in the face of a liberal Trump cue, then this is evidence for partisan loyalism. If, on the other hand, there is only a reaction to the conservative Trump cue, then the evidence does not support partisan loyalism. Instead it could be the case that Trump’s conservative cue merely reminds or reinforces people of their belief that Republicans are the party of conservatism. True partisan loyalism requires that the cue work in both directions.
Below we will show that the null hypothesis holds consistently under only two conditions. First, no group reacts to a cue that comes from Republican leaders in Congress. We employ this additional cue as a placebo test in order to demonstrate the power of the party-leader cue linked to President Trump. Our results suggest that there is something about Trump or the presidency more generally that is much more powerful than a simple Republican label.Footnote 7 Essentially the information about Republican officeholder views does little to change anyone’s opinions. President Trump is, however, a very different case. Second, Democrats and Independents do not react to Trump cues, but Republicans do, as hypothesized above.
Turning to the hypotheses about subgroups, we find strong support for both the knowledge and the approval hypotheses within the broader population. Those least knowledgeable and most approving of Trump are more likely to react to a Trump cue. However, our results run exactly in the opposite direction of the ideology hypothesis. In fact, it is those most likely to call themselves strong conservatives who are most influenced by the cue, regardless of the direction of the cue. Strong conservatives move the most when faced with a conservative Trump cue and when faced with a liberal Trump cue. This last result suggests that self-placed, symbolic, ideology means something other than what the question asserts on its face. It is closer to a social identity than it is to a reasoned statement about one’s constraint or policy preferences or issue consistency (Ellis and Stimson Reference Ellis and Stimson2012).
DATA AND EMPIRICS
Survey Design and Treatment Conditions
The data for this project come from a representative survey of Americans collected by YouGov survey research company in early 2017, immediately after the inauguration of Donald Trump as the forty-fifth president of the United States. Within the survey, respondents were asked about 10 of their political positions on a variety of contemporary issues. These issues included topics such as tax policy, abortion regulation, immigration restrictions, and the minimum wage.Footnote 8 A full list of the 10 questions asked and specific wording can be found in the online supplemental materials. Our sample includes 1,300 total respondents who were randomly assigned to one of three treatment conditions and a control condition. Those in the control condition (500 respondents) were presented with a policy statement and then asked whether they agreed or disagreed with the policy statement they had just read. For example, on minimum wage, respondents in the control condition saw the following:
Please indicate whether or not you support or oppose the statement.
To increase the minimum wage to over $10 an hour. Do you support or oppose increasing the minimum wage to over $10 an hour?
• Support
• Oppose
• Don’t Know
Those respondents who were assigned to one of the three treatment conditions saw a similar statement with a small addition. For example, those in the liberal Trump condition (200 respondents) saw the following:
Please indicate whether or not you support or oppose the statement.
To increase the minimum wage to over $10 an hour. Donald Trump has said that he supports this policy. How about you? Do you support or oppose increasing the minimum wage to over $10 an hour?
• Support
• Oppose
• Don’t Know
Those who were assigned to the conservative Trump condition (200 respondents) saw a nearly identical statement as those in the liberal Trump treatment. The only difference was that “Donald Trump has said that he supports this policy” was changed to read “Donald Trump has said that he opposes this policy.” A final treatment condition replaced the name “Donald Trump” with “Congressional Republicans” (400 respondents) and indicated which side of the issue congressional Republican leadership had taken a position on. All ten issue questions respondents saw contained the same ideological frame (or no cue in the case of the control group)—i.e., those in the liberal (conservative) Trump condition saw 10 issue questions, each of which contained a liberal (conservative) cue.
In addition to the 10 issue questions, respondents were asked their approval of President Trump, their self-identified ideology on a five-point scale, and a series of eight factual questions about contemporary politics, which we use to create an index of political knowledge. Additional demographic information previously collected by YouGov was then appended to the dataset, including gender, ethnicity, income, and political partisanship.
We specifically chose these 10 policies because they are ones on which Donald Trump has recently taken both a liberal and conservative public position on the issue. For example, on November 12, 2015, Trump said that he supported a policy in which any and all illegal immigrants would have to exit the country in order to be eligible for any type of legal status or citizenship.Footnote 9 However, on August 20, 2016, several media outlets reported that Trump was in favor of a plan that would allow certain people who were in the United States illegally to remain in the country and be eligible for legal status.Footnote 10 By using these particular questions, we avoid the problem of presenting respondents with untrue or deceptive information or asking respondents to consider a hypothetical or fictional candidate. Furthermore, the truthfulness of these positions combined with the continuous fluidity of Trump’s policy opinions means that respondents are more inclined to believe that these are positions on which Trump has actually expressed.Footnote 11 The very nature of Trump’s non-ideological and ever-changing issue positions is what allows us the unique opportunity to identify moments when issue content and party are in conflict. And this divergence allows us to identify which of these attachments appears to be more important in the minds of the typical voter.
Results
In each case, we arbitrarily code each question so that “1” equals giving a liberal response and “0” equals giving a conservative response. For example, roughly 60% of respondents in the control condition indicated that they supported funding Planned Parenthood. Figure A.3 in the supplemental materials shows the baseline support for each policy among those in the control group. There is a variety of support for each of the 10 policies, ranging from the lowest amount of support at 50% (allowing illegal immigrants to obtain legal status) to the highest amount of support at nearly 80% (background checks for guns). The range of support ensures that there is at least some room to move opinions through a treatment and that we are unlikely to encounter any large ceiling or floor effects that would be due to overwhelming support or opposition to any of the policies we consider. In Table A.1 in the supplemental materials, we show the results of balance tests for each of the treatment conditions for a number of demographic factors. In nearly all cases, there is no difference, on average, between the different conditions.Footnote 12
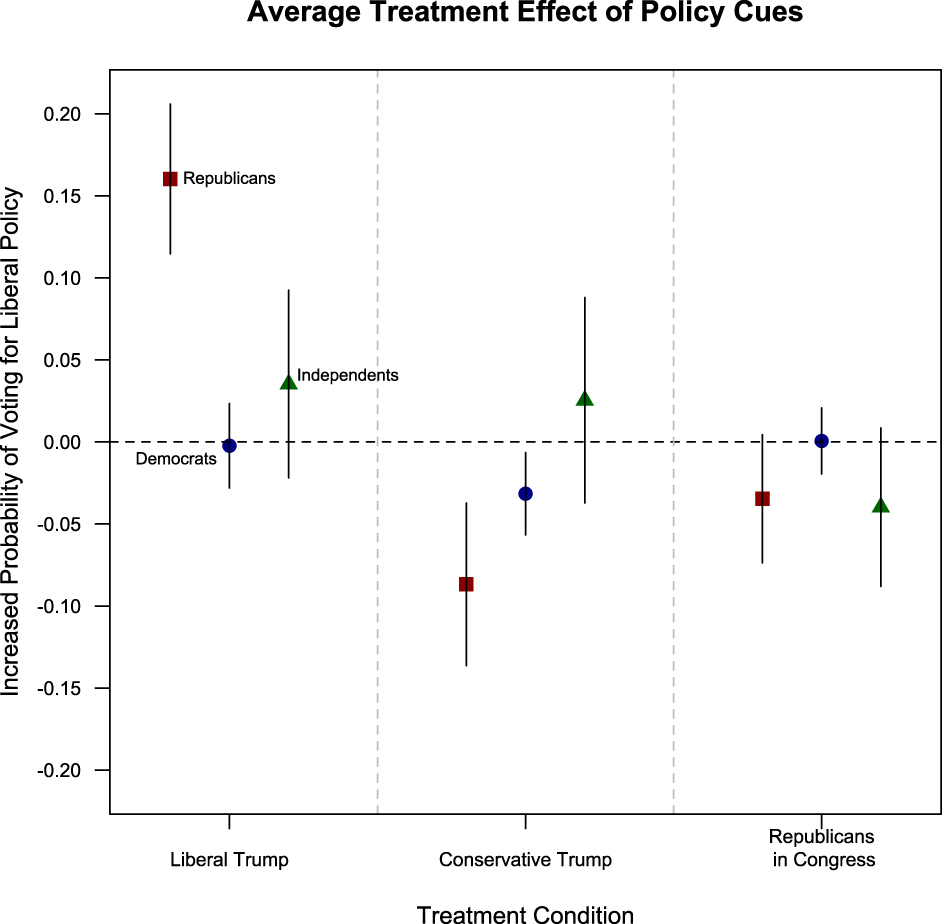
Figure 1 shows the baseline effects of the experiment by plotting average treatment effects aggregated across all 10 questions.Footnote 13 The effects are broken out by type of cue and by partisanship of the respondent.Footnote 14 The results show that not every group reacts to every cue. In fact, for the nine groups shown in the panel only two groups show much of a reaction: Republicans who received a liberal Trump cue and Republicans who received a conservative Trump cue.Footnote 15 Cues from congressional Republican leadership meant little to the respondents from any party. The implication of this result is that only the two Trump cues had an effect for this set of policy questions and, furthermore, this effect is seen primarily among Republican respondents. Furthermore, the actual ideological content of Trump’s endorsement was somewhat irrelevant to the presence of an effect. Both liberal and conservative cues moved Republicans in the liberal and conservative directions, respectively.
Average Treatment Effect Across Issues
Note: The effects indicate the average movement within groups and by treatment condition. Republicans are the only group that seems to shift positions significantly, and only in relation to Donald Trump cues. But it is true that they react in both a liberal and a conservative direction depending upon the cue.

These results suggest that party loyalism is a very strong element of Republican voters’ thinking. We emphasize that though these results focus on Republicans, this is largely driven by the unique place Donald Trump sits as the President and leader of the Republican Party. While we do not have similar data for an ideologically fluid leader of the Democratic Party, we see no reason why Democrats may not react in similar ways given the right set of circumstances (see Figure 6 and robustness section for further evidence). Figure 1 also shows that the cue works in both directions among Republican respondents. In fact, liberal cues from Trump moved Republicans in a liberal direction more so than conservative cues from Trump moved Republicans in a conservative direction (0.16 versus −0.09, p < 0.01). If the cue had worked in only one direction (particularly the conservative direction), we would not be able to rule out the possibility of partisan cues simply coinciding with the prevailing ideological trends within the party. This could have meant that people merely needed some partisan help (or a reminder) to shift positions in a consistently conservative direction. The fact that the ideological direction of the cue is irrelevant to achieving an effect is what suggests that the results are driven by party loyalism rather than the ideological content of the cue.
Republicans react to Donald Trump by following his opinions—whether those opinions are conservative or liberal. The average estimated effect sizes—over 15-percentage points in a liberal direction and almost 10 points in a conservative direction—show that the effect is substantial.Footnote 16 The main implication of these results is that partisan loyalty is more relevant to a large group of Republicans than is any kind of conservative issue preference.
It is also notable that Democrats and Independents do not react as strongly (or at all) to the treatment. Negative partisanship (Abramowitz and Webster Reference Abramowitz and Webster2016), often described as a negative affect or reaction against the other party, is not a feature of these results. Democrats do not shift in a conservative direction away from Trump when given a liberal Trump cue or in a liberal direction away from Trump when given a conservative Trump cue. It seems that citizens react in response to a cue giver that is perceived as leading their own party (no doubt part of why Independents react not at all).Footnote 17
Though it is not our intention to focus heavily on the individual items, it is important to establish that the individual items generally had effects in expected directions. Figure A.5 in the supplemental materials displays the individual item effects among Republicans and confirms that for every single question, the liberal treatment moved Republicans in a liberal direction and the conservative treatment moved Republicans in a conservative direction.Footnote 18 The analogous figures for Democrats appear in Figure A.6. The effect size is relatively smaller for guns, abortion, and Planned Parenthood, but all of the liberal Trump cue effects are broadly similar an in the same direction. In general, the effects of a conservative Trump issue endorsement are slightly smaller. Indeed, on tax increases, Planned Parenthood funding, climate change, and guns at school, the Trump effect was trivial. The results for those who were shown a cue from congressional Republicans are generally not in any consistent direction, nor are they statistically significant for 8 of the 10 questions. If anything, Republicans are more likely to move in response to a liberal cue. Moreover, we again emphasize the unique situation in which we are able to credibly signal a liberal policy cue from the leader of the Republican Party. These results would be incredibly difficult to obtain in any other situation. We now turn to the other hypotheses about subgroups of the population who may be especially likely (or unlikely) to accept a partisan cue.
Results by Political Knowledge Levels
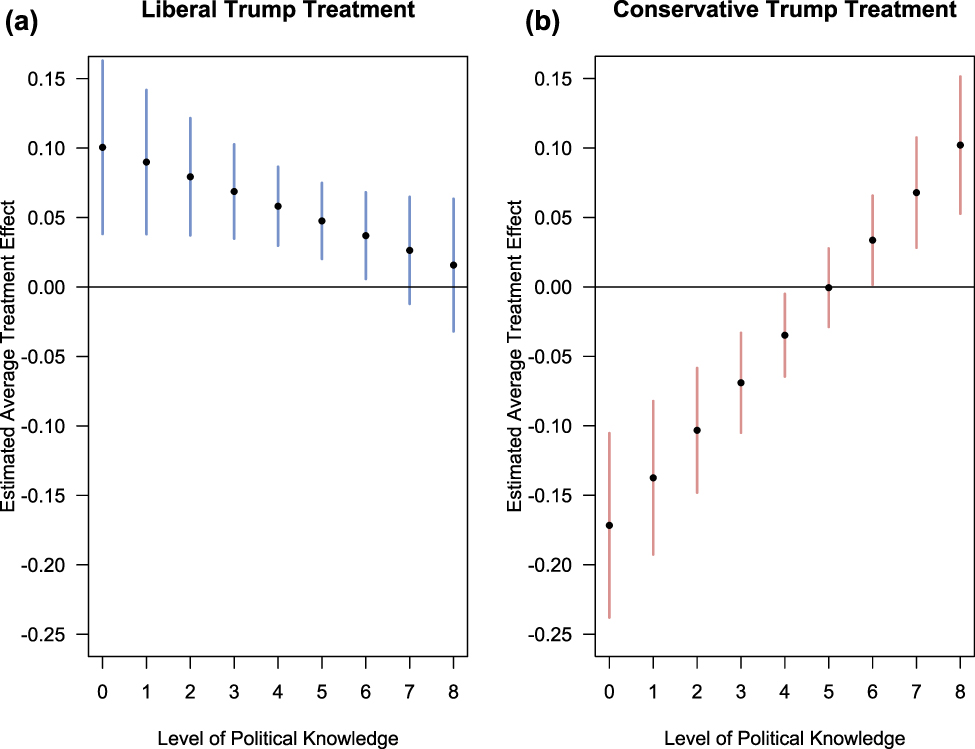
Previous scholarship has shown that high-knowledge (or highly educated) respondents are more likely to exhibit ideological constraint (Kinder and Kalmoe Reference Kinder and Kalmoe2017; Freeder, Lenz, and Turney Reference Freeder, Lenz and Turney2018). Given these results, it follows that for the most knowledgeable respondents, ideological cues should have less of an effect. We would expect this to be true in both cases when the cue aligns with the individual’s ideological bent and also when that cue goes against their particular views. Freeder et al. (n.d.) suggest that one possible reason for this is that “individuals who care deeply about policy issues and have stable opinions about it…will learn the political parties’ and candidates’ positions in order to support the party and candidate who holds the same issue position (p. 4).” Thus, individuals who have high levels of knowledge about the institutions of government, people in office, and the major policy positions of the parties have to a greater degree invested the time to learn about these institutions as a result of the deeply held political beliefs they already have. Thus, any treatment regarding the policy positions of party leaders should have little effect. This could be partly because the information is not new to them—they’ve already learned what Donald Trump has said about immigration—but also partly because their well-formed opinion is not likely to change even when presented with information that is new to them. While we are agnostic as to the mechanism by which this occurs, the empirical prediction derived from these arguments is that those individuals with high levels of political knowledge should not be moved in either direction by a partisan cue. On the other hand, individuals with low levels of knowledge should be susceptible to cues in either ideological direction from a party leader. These individuals, who according to Converse (Reference Converse and E. Apter1964) make up the large majority of the general population, have fewer core ideological commitments to anchor their positions as well as less information regarding the currently held positions of either major party or their leaders. Figure 2 displays exactly this relationship. Low-knowledge individuals are more likely to be moved in a liberal direction by the liberal cue and a conservative direction by the conservative cue.Footnote 19
Average Treatment Effect by Political Knowledge
Note: This figure displays the estimated treatment effect by levels of political knowledge. The left panel shows the effects of the liberal Trump treatment across levels of political knowledge. Higher values indicate a movement in a more liberal direction. The right panel shows the effects of the conservative Trump treatment across levels of political knowledge. Lower values indicate movement in a more conservative direction. Knowledge is clearly correlated with the treatment effect---higher knowledge respondents are less likely to respond to the cue, in either direction.

Though the effect is clearly stronger for the conservative Trump treatment, there is a clear pattern indicating that the most knowledgeable in the sample are the least likely to follow the treatment. Higher-knowledge individuals are more likely to look like policy loyalists than party loyalists. On the other hand, low-knowledge individuals display the opposite pattern.Footnote 20 Because our experiment takes the form of an information experiment—essentially respondents are given “knowledge” about Trump’s “positions”—it is the case that some respondents may be adding only a small amount of knowledge to their already existing framework. In essence we have treated people who already have been treated with an abundance of political knowledge. In those cases, we see little effect of the Trump cue. People with less of a reservoir of preexisting knowledge and the closely held opinions that are correlated with high knowledge react much more strongly to the treatment, in either direction.
One interesting point about the results is that high-knowledge Republicans actually appear to exhibit something of a backlash against Trump’s position. This is largely due to the fact that when high-knowledge pure independents were given the conservative Trump treatment, they reacted negatively and took more liberal positions. Pure independents with the highest levels of political knowledge (more than six correct answers on the eight-question knowledge battery) may not quite be political unicorns, but they are far from common (4% in the overall sample). The more general point of Figure 2 is that the strongest treatment effects are concentrated among the least knowledgeable individuals and that high-knowledge individuals are more likely to be ideologically consistent and unmoved in either direction by the cue.
This test helps us identify those who are more likely to be ideological; however, it is less able to identify partisan loyalists since we include all respondents here. To help identify those who are more likely to be party loyalists, we also tested the knowledge hypothesis among Republicans only. These results, displayed in the supplemental materials (Figure A.12), show a very similar pattern. Low-knowledge Republicans are much more likely to be party loyalists. This group is moved significantly by the Trump treatment in either direction, while high-knowledge Republicans are much less likely to respond to either the liberal and conservative Trump cues.
Results by Partisan Attachment and Trump Favorability
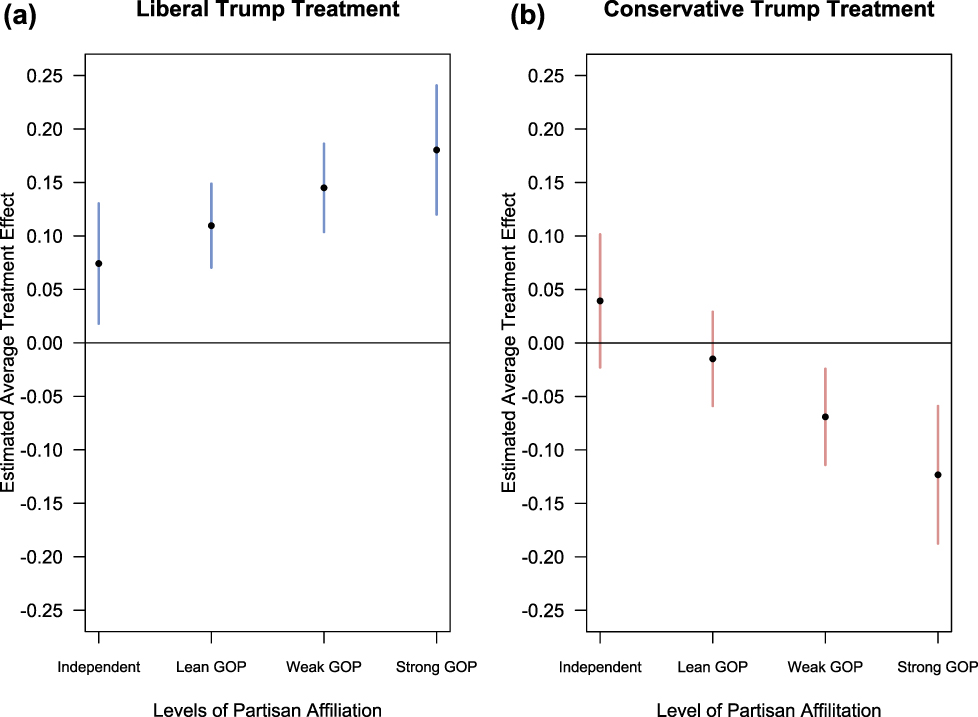
If political knowledge mutes the power of the cue to produce partisan loyalty, what strengthens the power of the cue? A plausible suspect is one’s level of attachment to the Republican Party. If a respondent identifies strongly with the Republican Party, it seems reasonable to expect that a cue from the leader of the party would be more readily accepted than it would from people with weak or no ties to the party. Why might strong partisans be more likely to receive and respond to cues from partisan leaders? Previous scholars have suggested that one important factor in the receptiveness of cues is the credibility and trustworthiness of the cue giver (Nicholson Reference Nicholson2012). Partisanship is one of the strongest group identities in America today, and in many ways people have expressed preferences for and exhibit greater levels of trust with fellow partisans. Scholars have shown that members of the public today are equally likely to discriminate based on partisanship as they are based on ethnicity (Iyengar and Westwood Reference Iyengar and Westwood2015). Partisans express preferences for living near their co-partisans (Mummolo and Nall Reference Mummolo and Nall2017) and appear to favor dating members of the same political party (Huber and Malhotra Reference Huber and Malhotra2017). Given these preferences and predispositions, we may expect people who strongly identify with a party to be more receptive to a political cue from the President, who is widely perceived to be the leader of the party. Figure 3 makes exactly that case for Republicans.
Average Treatment Effect by Republican Party Strength
Note: Those who identify strongly with the Republican Party exhibit stronger treatment effects in a liberal direction for the liberal Trump treatment, and in a conservative direction for the conservative Trump treatment.

The group most likely to exhibit partisan loyalist behavior are those who consider themselves to be strong Republicans. Note that for those who most strongly affiliate with the Republican Party, the actual content of the cue is not relevant. They react to the cue in whatever fashion Trump offers it. Strong Republicans are nearly 15-percentage points more likely to give a conservative response when provided a cue that Donald Trump holds a conservative view. Similarly, strong Republicans are slightly less than 20-percentage points more likely to respond in a liberal direction when told that Donald Trump holds a liberal view on the issue. On the other hand, the effects among those who merely lean Republican are indistinguishable from zero when given a conservative cue and are half the size as the effect among strong Republicans when given a liberal Trump cue.Footnote 21
We again emphasize the importance of the treatment working in both the liberal and conservative directions. Previous work studying partisan cues has been limited by the fact that nearly all partisan cues reinforce the existing ideological preferences of the two parties. In that situation, we cannot disentangle whether any observed effects are due to pure partisan loyalty or whether the cue is working by strengthening a person’s ideological position on a given issue. In this case, however, the existence of both a liberal and conservative Trump treatment effect among strong Republicans indicates that much of the effect is due to pure partisan attachments and not ideological preferences on the issues that happen to align with party affiliation.Footnote 22
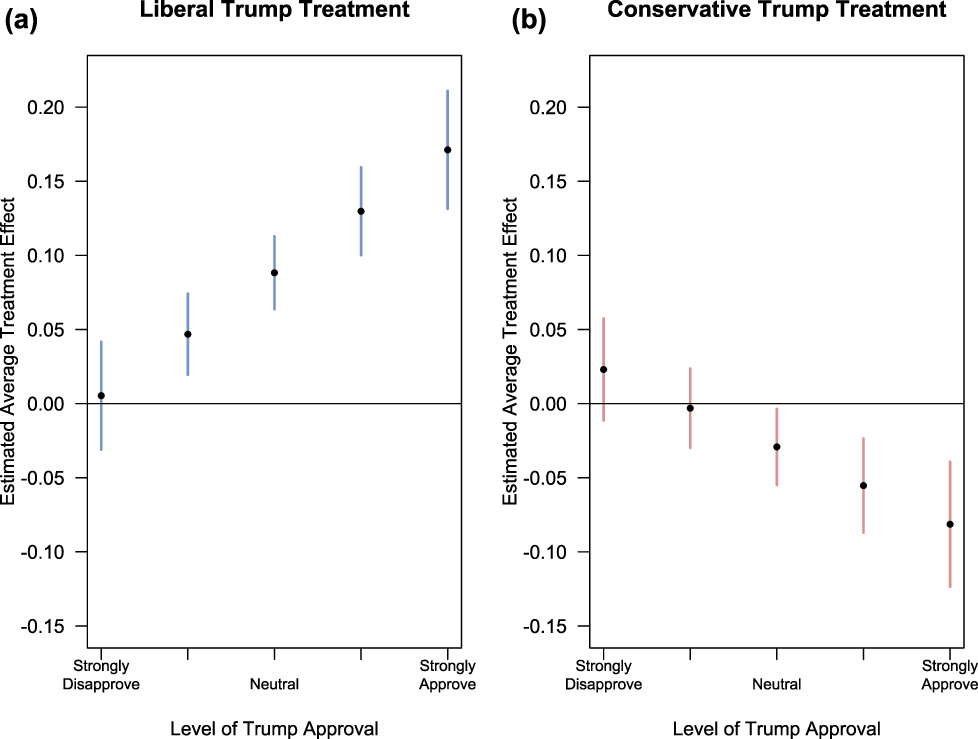
Beyond party attachment, we also test the effects across levels of Trump approval. Trump, while Republican, is clearly a unique Republican. Many members of the Republican Party have declared themselves “never-Trumpers.” Given the tenuous relationship Trump has with many Republicans, shared party affiliation may not always lead to the kind of trust and credibility that previous scholars have emphasized are critical to acceptance of a cue. To overcome this, we also test the effects of each cue across levels of Trump approval. It follows that if a respondent feels positively about President Trump, this approval should spill over into their acceptance of ideological cues given by Trump. Figure 4 confirms that this is the case.
Average Treatment Effect by Approval of Trump
Note: Those who approve of Trump exhibit stronger treatment effects in a liberal direction for the liberal Trump treatment, and in a conservative direction for the conservative Trump treatment.

The group most likely to exhibit loyalist behavior are those who believe in Trump and what he represents. Note that for those who most strongly approve, the actual content of the cue is not relevant. Again, they react to the cue in whatever fashion Trump offers it.Footnote 23
Results by Self-Labeled Ideology
One of the most common measures of ideology used in the literature on public opinion or political behavior is self-described political ideology. This is often presented as a measure of a person’s convictions and an expression of their placement on an ideological scale that describes American politics, and is often called “symbolic ideology” (Ellis and Stimson Reference Ellis and Stimson2012; Grossmann and Hopkins Reference Grossmann and Hopkins2016). How principled is this self-description? If the label is connected to policy content, we would expect those who identify as very liberal to hold more consistently liberal positions on issues than those who identify as slightly liberal or moderate. The same should also be the case among those who identify as very conservative. And, indeed, when compared to other measures of ideology, such as those based on IRT models using binary issue positions, self-identified liberals and conservatives tend to hold more consistently liberal and conservative issue positions, respectively (Broockman Reference Broockman2016). We would thus not expect a liberal cue to move a conservative by much if their self-described conservatism was rooted in a strong commitment to conservative principles, or for a self-identified liberal to move in response to a conservative cue.
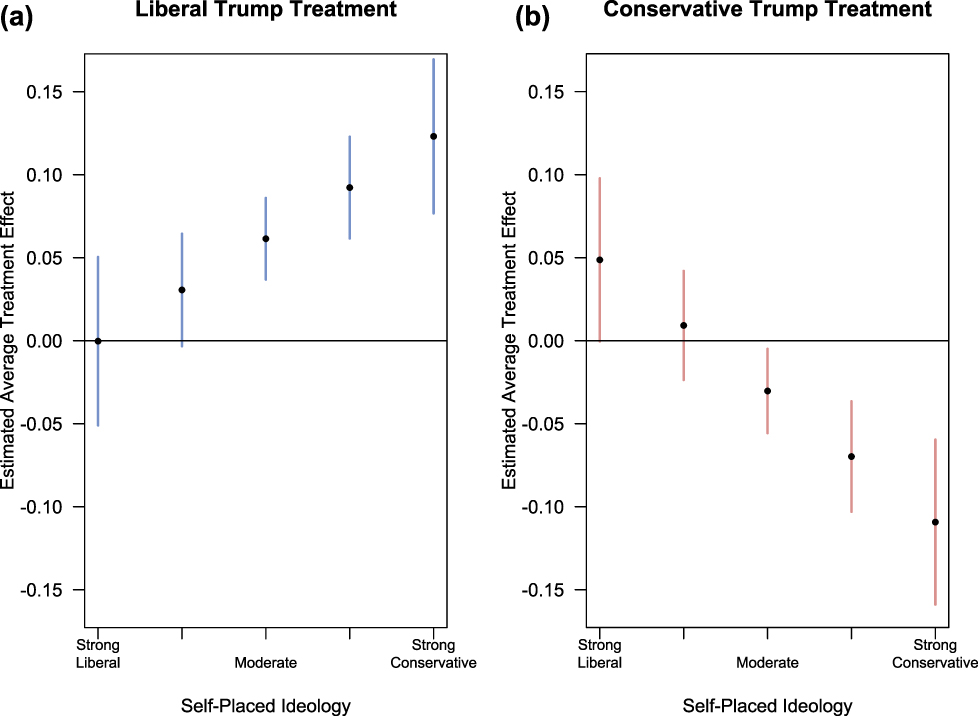
Figure 5, however, displays results to suggest that self-described conservatives are not consistently policy loyalists. The right-hand panel shows that, as we would expect, stronger conservatives are the most likely to react to the conservative Trump treatment. The inclusion of the conservative cue increases strong conservatives’ probability of taking a conservative position by approximately 10 percentage points. The left panel describes the average effect of an interaction between self-placed ideology and the liberal Trump treatment. Perhaps surprisingly, relatively stronger conservatives are the ones who are most likely to move in a liberal direction on policy by nearly 10 percentage points. These results indicate that self-identified conservatives are most likely to exhibit stronger treatment effects for both the conservative Trump and the liberal Trump treatments.Footnote 24
Average Treatment Effect by Self-Described Ideology
Note: Republicans at higher levels of conservatism exhibit stronger treatment effects for both the liberal Trump and the conservative Trump.

The fact that stronger conservatives are the ones most likely to react to the treatment—regardless of the ideological direction of the treatment—suggests that the nearly ubiquitous self-placed ideology measure is less a measure of principled conviction and more of a social identity (Grossmann and Hopkins Reference Grossmann and Hopkins2016). More likely, it appears to be an identity that indicates that such people are quite susceptible to partisan loyalty. If symbolic ideology was a powerful predictor of a person’s policy convictions, it should lead to behavior more like policy loyalism than party loyalism. However, we observe exactly the opposite: strong “conservatives” are the most likely to be partisan loyalists—following Trump in a liberal direction when told of his support for a liberal policy.
In the supplemental materials (Figure A.18), we present similar models that interact the treatment only among Republican respondents. In these figures, we see similar results among Republicans in the conservative Trump treatment. Republicans who identify as strongly conservative are much more likely to be moved by the treatment. In the liberal Trump treatment, we see something slightly different. The liberal Trump treatment appears to have a constant, positive (between 15 and 20 points), effect among all Republicans, regardless of ideological self-identification. Given that we should expect strongly conservative Republicans to reject a liberal treatment (which we do not observe), this indicates that seeing oneself as a strong conservative is no impediment to abandoning traditional conservative positions. This test conforms with the work of Ellis and Stimson (Reference Ellis and Stimson2012) which shows that there is a clear difference between operational and symbolic ideology. This work goes further in showing that even the “strongest” symbolic conservatives are just as likely, if not more so, to change their ideology in response to party-leader cues. It is one thing to say that group membership is powerful and that symbolic ideology is correlated with group membership, though still distinct; it is something else to say symbolic ideology is at odds with policy positions for many respondents when provided with those cues from their group leader. To our knowledge, this is a novel contribution and distinct from the work of others.
This result illustrates the importance of testing the unique Trump cue. It is very difficult to know in most survey settings, with any certainty, whether or not people who are strongly conservative are more likely to give conservative responses because they have a core set of operationally conservative convictions or because they are the most committed to taking the party cue, which nearly always aligns with the ideological position. Given the evidence here, it appears that for the case of Trump, such conservatives are more committed to the party label that happens to be associated with conservatism than they are any underlying conservative policies.
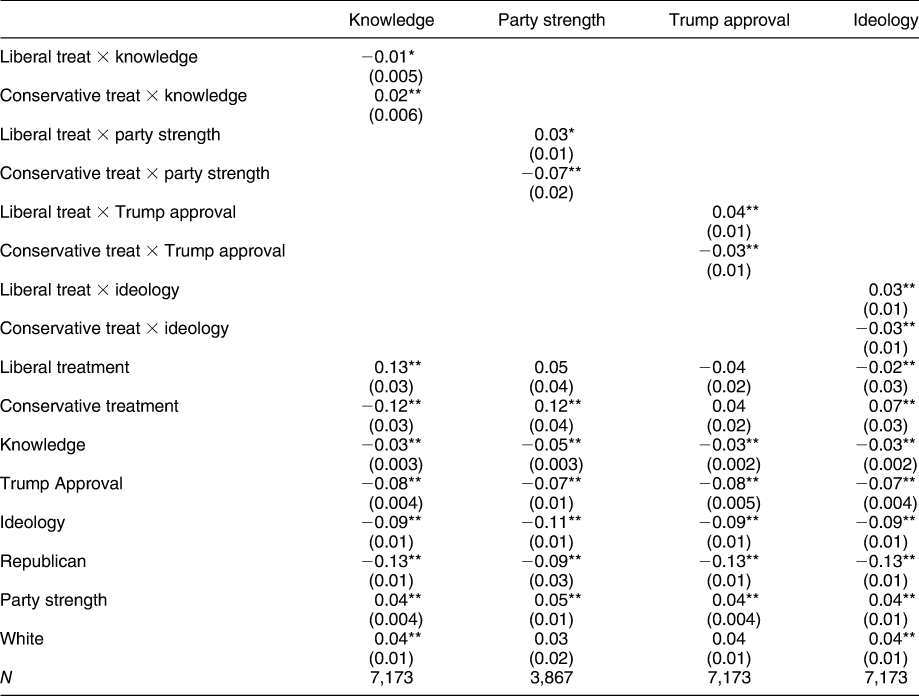
We note that each of the interaction effects we have tested here are correlated with one another. Those who identify as being strongly conservative are also more likely to identify strongly with the Republican Party and approve of Donald Trump’s performance as president. Thus, one possible concern that could arise is whether or not each of the effects shown above would hold after controlling for all of the other related factors. For example, do those who identify as strongly conservative show a larger treatment effect after accounting for the fact that they are also more likely to identify as Republicans? Table 1 below shows that in every case our results are robust to the inclusion of these control variables. The interaction effects in Model 1 show that those with higher levels of political knowledge are less likely to respond to the cue in either direction. Models 2, 3, and 4 show that strong partisans, those who approve of Trump, and those who identify as strongly conservative are more likely to respond to the liberal and conservative Trump cues. In every case, these results are consistent with those shown in the figures above. In Table A.3 in the supplemental materials, we present additional models that include all treatment interactions together. The results are broadly consistent with those in Table 1, though in the case of symbolic ideology the interaction effect attenuates slightly depending upon the specification.Footnote 25
Interaction Models, Including Control Variables

Coefficients reported from ordinary least squares regression model, with standard errors in parentheses. In each model the dependent variable is coded 1 if the respondent indicated supporting the liberal policy option and 0 if they supported the conservative policy option. In Model 2 we are testing the strength of Republican partisanship, so we exclude those who identify with the Democratic Party. Significance codes: *p < 0.05, **p < 0.01, two-tailed tests.
Robustness: Other Political Leaders as Tests
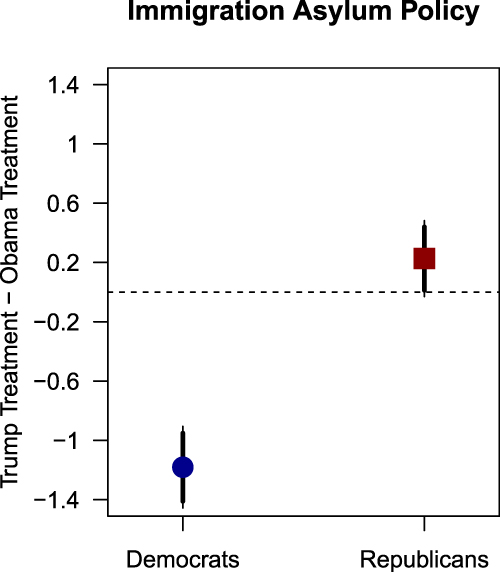
We do not believe that the conditions necessary for this test obtain often. The situation demands a very flexible leader who changes positions easily. This leader cannot simply be any member of the party, but a leader with a great deal of clout and influence who can plausibly move party member positions on key issues. We do not know of any leaders besides Trump who can fit these conditions. However, in the spring of 2018, a unique situation during the debate over immigration allowed us to test whether or not giving people a cue about a policy that was pursued, at various times, by both Obama and Trump would allow us to test something similar to what we find here. In this case we asked 1200 MTurk respondents “Do you favor or oppose the following immigration policy? When families, including children, are arrested by the border patrol, they will be held in a detention facility together while they await an immigration asylum hearing” (followed by a five-point scale of favorability). The experimental conditions here were driven by the fact that this new Trump policy (in the spring of 2018) was extremely similar to the Obama administration policy between 2009 and 2015. Taking that into consideration, we embedded two different treatments into this question. A third of respondents saw the question printed above and nothing else. Another third saw the same question above plus the sentence: “This is President Donald Trump’s current policy.” A final third of respondents saw the treatment that included this sentence: “This was President Barack Obama’s policy during most of his presidency.” Figure 6 displays the results of that study.
Treatment Effects by Partisanship
Note: The figure displays the difference between the Trump and the Obama treatments by partisanship of the respondents with wider bars displaying 90% confidence intervals and the lighter bars displaying 95% confidence intervals.

The results show large effects for Democrats and smaller, but still statistically significant effects for Republicans. Democrats were less likely to agree with the policy by more than a point (on a five-point scale) when told that the policy came from the Trump administration versus the Obama administration. Republicans were more likely to agree with the policy by about 1/3 of a point when told the policy came from Trump rather than Obama. The situation is different here, in that we were not able to justify the men taking completely opposite positions (Barack Obama is simply not as flexible as is Donald Trump, and we note that this was the only issue we could find that allowed us to test Obama in any sense). However, the results support our contention that people are very flexible on policy and heavily influenced by party-leader cues—at least under the right circumstances. While we are reluctant to draw too many conclusions from this limited experiment, it does provide a proof of concept that Democrats are also willing to adjust their preferences when told that the policy was coming from Obama, at least on the issue of immigration.
Ideal Point Distributions by Treatment Group
The previous results demonstrate conclusively that Trump’s influence (expressed in a cue) leads Republicans to respond to the cue, in some cases dramatically. Furthermore, those who are lower in knowledge, are strongly partisan, approve of Trump, or regard themselves as “very conservative” were especially susceptible to the cue. One limitation of the experiment is that it prevents us from measuring directly the proportion of the public that behave as policy loyalists or as partisan loyalists.Footnote 26 However, the experimental method does allow us to measure a key element of debate over partisan polarization: the distribution of opinion and how it varies by treatment group.
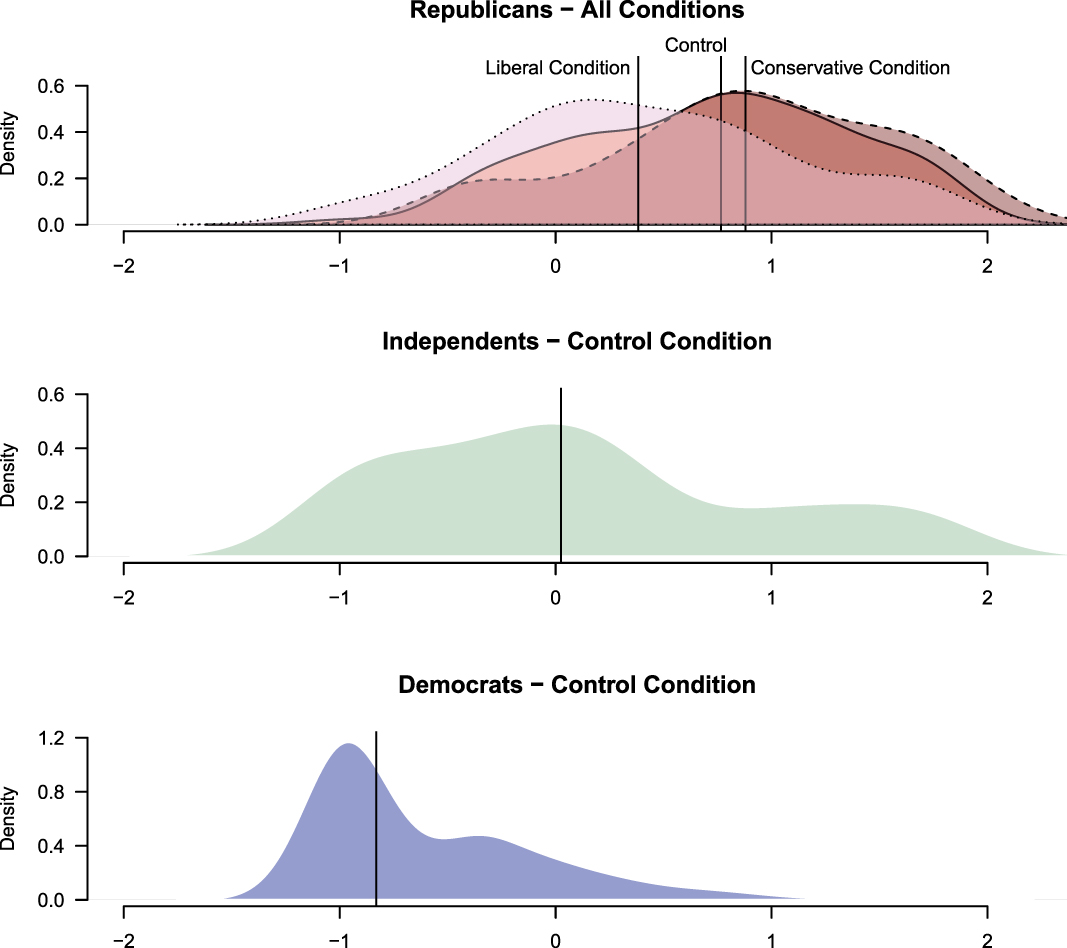
While the previous results show the change in respondent’s probability of taking a liberal policy position, we now consider how the aggregate change in opinion among Republicans in the different conditions compares to other important political groups. Figure 7 displays the density of a one-dimensional ideal point model for each treatment category among Republicans and compares it to Independents and Democrats in the control conditionFootnote 27. The ideal point model estimates the latent liberalism/conservatism for each respondent using the responses given to each issue question. Larger (smaller) values indicate respondents with more consistently conservative (liberal) positions. The distribution with the solid line in the top panel shows Republicans in the control condition and displays a decidedly right-leaning distribution (the vertical line shows the median of each distribution). There is only a small difference between this condition and the condition where Trump took conservative positions (heavy dashed line distribution).
Ideological Distribution by Condition
Note: Each panel displays the density for an ideal point model subset by treatment category and partisanship; the vertical lines indicates the median of each distribution.

The liberal treatment group is, however, a very different story. Here the distribution (light dotted line distribution) is obviously shifted to the left with many more Republicans taking liberal positions on issues. When those estimates are examined in a simple ideal point model, the results show that the liberal Trump condition led Republicans to move a little over halfway toward the position of pure independents—displayed in the middle panel of the graph. Republicans in the liberal Trump condition do not exactly become neutral in the partisan contest (some residual conservative positions remain despite the liberal Trump cue), but they look much closer to that position than do those who received a conservative Trump treatment or no treatment at all. For the sake of completeness, the final panel displays the estimated density for Democrats who received no cue. That distribution is relatively liberal.
There are two key points to come out of these results. Though we do not know exactly what proportion of the Republicans are partisan loyalists, we do see that the Trump cue, on average, moves this group halfway toward having the same average issue consistency as pure independents. That is a substantial shift and would represent a major change in the Republican Party.
Second, though discussion of polarization in the current climate is ubiquitous, these results present an important limitation for that discussion. Some argue that the parties are polarized in response to the demands of a polarized public. While this is a complex thesis that cannot be tested in a single paper, our results strongly suggest that a crafty leader who wanted to change the direction and themes of his or her party would likely face little resistance from the party’s rank and file. Perhaps interest groups or other partisan actors would prevent such a figure from dramatically changing the party (indeed in some respects, that appears to be true for Trump), but that would be the result of activists, organized interests and, perhaps, other political leaders—not the average party-line voter. It is not the case that the rank and file dissent so much that a leader could not reframe his or her positions in such a way as to change the party brand. Polarization—at least in the public—is less principled than we might imagine. It has much more to do with partisan loyalty than it does with ideological principle.
DISCUSSION
Writing of the “spirit of party,” George Washington, in his farewell address, claimed that “this spirit, unfortunately, is inseparable from our nature, having its root in the strongest passions of the human mind” and that in popular governments we see its “greatest rankness.” Indeed he clearly views this spirit as the “enemy” of popular government because he believes it will lead people to “seek security and repose in the absolute power of an individual.” Never have political scientists been able to provide as strong of a test of this claim until now. The simple truth is that many citizens behave as partisan loyalists rather than principled ideologues. In responding to the party-leader cue, this is especially true of Republicans and those who are low in political knowledge, highly partisan, approve of the leader, or self-described ideological “conservatives.” What do these results imply about the electorate more generally? How worried should we be?
First, it should be said that there are a lot of partisan loyalists in the electorate who are mostly motivated by their particular group affiliation (Achen and Bartels Reference Achen and Bartels2016). Though we would not expect our cue to affect everyone, we found that it moved the average Republican about halfway toward looking like a pure independent on a unidimensional ideological scale. This substantial amount no doubt masks some variation among those who are more or less immune to such partisan appeals. While we have shown that many simply parrot a traditionally liberal set of positions when the Republican Party leader embraces those issues, we do not claim that everyone responds that way.
And we doubt that our results are unique to the Republican Party (or even the United States), though they may be unique to this particular historical moment.Footnote 28 Given the right set of circumstances—a leader of the Democratic Party who began to embrace traditionally conservative principles—we would expect to see similar results on that side of the aisle. Similarly we expect these results generalize beyond the United States, but would require a particular set of circumstances to test. Until such a set of conditions arrives, we are left with the available—Republican—tests.
Second, the results of this paper undermine the idea of self-described, symbolic, ideology as a meaningful measure of operational ideology among the public. Self-described ideological conservatives were very quick to respond to the treatment of liberal Trump cues, moving an average of 12 points in a liberal direction across the issues. The results for more moderate and liberal Republicans were negligible. The clear implication of this is that when individuals describe themselves as conservatives it has more of a partisan tinge than is conventional wisdom in the literature. When citizens symbolically label themselves ideologically, they are reacting in a way that we would expect a partisan loyalist to react rather than someone with deeply held issue positions. Research that relies heavily on self-described ideology as a measure separate from partisan affiliation is therefore suspect. The results here show that self-described ideology may not truly reflect any ideological policy commitments but reacts more like a social identity, at least for conservatives.
It is also worth noting that we find very little evidence of “negative partisanship” in these results (Abramowitz and Webster Reference Abramowitz and Webster2016). It does not appear to be the case that Democrats react against Trump by simply taking the opposite stance. In some sense this is support for the idea that Democrats may more likely be policy loyalists, which coincides with some existing findings in the literature (Grossmann and Hopkins Reference Grossmann and Hopkins2016). Alternatively, it seems more likely that Democrats may not respond to the Trump cue but would perhaps respond to other cues, perhaps especially cues from Democratic leaders.
Third, we note that these results have implications for the coalition merchants theory of ideology (Noel Reference Noel2013). If it is the case that ideology can be reconstructed in the electorate by at least some enterprising and unpredictable party leaders, then it is quite possible that ideology is not simply being constructed in a grassroots fashion by intellectuals and activists. Instead, it may be the case, at least some of the time, that ideology is being constructed by party leaders, though perhaps in ways that are subtle and difficult to identify.
Finally, we believe the implications of this work for the debate over polarization and representation are profound. When we discuss “partisan polarization,” the assumption is that people’s partisanship and ideological predispositions run in the same direction. As soon as we break that link with a unique research design, brought to us by an ideologically unique president, we discover that partisanship is clearly the root cause of opinion for many respondents and that ideology—symbolic or operational—is simply less powerful than the pull of the spirit of party. One extension of these results is that any thought of voters choosing ideologically consistent or proximate candidates seems to take a back seat to partisan attachments and group loyalty (Ahler and Broockman Reference Ahler and Broockman2018). Voters, as shown here, are not polarized in the sense that they hold consistent ideological views. Rather their polarization is merely a reflection of the partisan team to which they happen to belong, and will remain loyal to, in whatever ideological direction the party moves. That kind of unprincipled, but loyal, behavior should probably worry political observers a great deal.
SUPPLEMENTARY MATERIAL
To view supplementary material for this article, please visit https://doi.org/10.1017/S0003055418000795.
Replication materials can be found on Dataverse at: https://doi.org/10.7910/DVN/38BFML.




Comments
No Comments have been published for this article.