





1. Introduction
High-Reynolds-number wall turbulence has been an active issue in the field of turbulence research recently (Marusic et al. Reference Marusic, Mckeon, Monkewitz, Nagib, Smits and Sreenivasan2010; Smits, Mckeon & Marusic Reference Smits, Mckeon and Marusic2011) due to the discoveries of some new and different physical phenomena, scaling laws and theories with respect to the low-Reynolds-number flows, in which the recognition of the very large-scale motions (VLSM) in the outer layer (Kim & Adrian Reference Kim and Adrian1999) is of landmark significance. In a fully developed turbulent pipe flow, Kim & Adrian (Reference Kim and Adrian1999) found that the premultiplied spectra of the streamwise velocity fluctuations have two peaks, and the low-wavenumber peak indicates very long-motions larger than  $3\delta$, which are much longer than the large-scale motions (LSM) identified in previous low-Reynolds-number experiments. Those structures are defined as the VLSM. Subsequently, VLSM were identified in pipe flows (Guala, Hommema & Adrian Reference Guala, Hommema and Adrian2006; Lee, Sung & Adrian Reference Lee, Sung and Adrian2019), channel flows (Balakumar & Adrian Reference Balakumar and Adrian2007; Lee et al. Reference Lee, Lee, Choi and Sung2014) and the turbulent boundary layers (TBL) (Hutchins et al. Reference Hutchins, Monty, Ganapathisubramani, Ng and Marusic2011; Vallikivi, Ganapathisubramani & Smits Reference Vallikivi, Ganapathisubramani and Smits2015; Squire et al. Reference Squire, Morrill-Winter, Hutchins, Schultz, Klewicki and Marusic2016). Further investigations revealed that the VLSM carry more than 50 % of the turbulent kinetic energy (TKE) (Balakumar & Adrian Reference Balakumar and Adrian2007) and have a significant amplitude modulation effect on the small-scale motions near the wall (Hutchins & Marusic Reference Hutchins and Marusic2007b; Mathis et al. Reference Mathis, Monty, Hutchins and Marusic2009). Recent studies also demonstrated that the VLSM have significant contributions to the sediment particle transport (Cameron, Nikora & Witz Reference Cameron, Nikora and Witz2020). For the first time, Hutchins & Marusic (Reference Hutchins and Marusic2007a) reported the existence of VLSM in the atmospheric surface layer (ASL) with
 $Re_\tau =6.6\times 10^5$ (
 $Re_\tau =u_\tau \delta /\nu$,
 $u_\tau$ is friction velocity,
 $\delta$ is boundary layer thickness,
 $\nu$ is air kinetic viscosity) based on the field observations at the Surface Layer Turbulence and Environmental Science Test (known as SLTEST) site and found that the VLSM have streamwise scales longer than 500 m. Later, Wang & Zheng (Reference Wang and Zheng2016) confirmed the presence of the VLSM in ASL based on the Qingtu Lake Observation Array (known as QLOA), which can obtain systematic observations of ASL turbulence. It was suggested that the energy transfer of the VLSM may not only be related to the ‘bottom-up’ mechanism (Kim & Adrian Reference Kim and Adrian1999), but also the ‘top-down’ mechanism (Hunt & Morrison Reference Hunt and Morrison2000). After that, Zheng's group revealed that it is the friction velocity rather than the Reynolds number affecting the inclination of the VLSM (Liu, Bo & Liang Reference Liu, Bo and Liang2017a), and revealed a multiscale amplitude modulation of the turbulent structures (Liu, Wang & Zheng Reference Liu, Wang and Zheng2019). In addition to the studies on the VLSM in the context of single-phase flows, for the first time, Zheng et al. (Reference Zheng, Zhang, Wang, Liu and Zhu2013) revealed the existence of the VLSM in particle-laden flows by observing sandstorms. The VLSM can play a significant role in sand and dust transport, that is, VLSM can promote streamwise transport of PM10 (particles with size less than
 $10\ \mathrm {\mu }\textrm {m}$) but suppress the wall-normal transport below 2.5 m (Wang, Zheng & Tao Reference Wang, Zheng and Tao2017). To date, no evidence has been reported that VLSM exist in the wind-blown sand-laden flows in a wind tunnel.
Due to the stochastic attributes of flow turbulence and the random distribution of a particulate phase, experiments and numerical simulations of turbulent multiphase flows have shown formidable challenges (Balachandar & Eaton Reference Balachandar and Eaton2010), in which the interaction between a turbulent flow and a particulate phase is of special importance and complexity (Elghobashi Reference Elghobashi1994). To date, works on the interaction between particulate and flow phases have mainly focused on the influence of turbulence on the motions of particles or the feedback of particles on turbulence statistics, such as the preferential accumulation of particle distribution (Caporaloni et al. Reference Caporaloni, Tampieri, Trombetti and Vittori1975) or its relationship with the burst-sweep events in the near-wall region (Marchioli & Soldati Reference Marchioli and Soldati2002). It has been generally accepted that particles with smaller Stokes numbers ( $St$ number, defined as the ratio of the relaxation time of particles to the characteristic time scale of ambient turbulence) follow the local carrier better, and the larger the
 $St$ number is, the particles follow the carrier more poorly. Substantial attenuation of TKE was found for
 $St<60$, while for
 $St>60$ the particles enhance it (Luo, Fan & Cen Reference Luo, Fan and Cen2005; Tanaka & Eaton Reference Tanaka and Eaton2010). Another factor is the particle-to-fluid length scale ratio, which is the ratio of the particle diameter (
 $d_p$) to the characteristic length scale (
 $\eta$) of the turbulence. It is concluded that particles smaller than
 $d_p/\eta =0.1$ can attenuate turbulence, whereas particles larger than
 $d_p/\eta =0.25$ augment it (Gore & Crowe Reference Gore and Crowe1989, Reference Gore and Crowe1991). In addition, based on the existing experimental results, Hetsroni (Reference Hetsroni1989) proposed that the particle Reynolds number
 $Re_p$, defined in terms of the relative velocity between the particle and ambient fluid, the particle size and fluid viscosity, can also be employed for evaluating turbulence modulation by particles. They found that particles with
 $Re_p<200$ can attenuate the turbulence, otherwise it is enhanced. Elghobashi (Reference Elghobashi1994) pointed out that the volume fraction occupied by the particulate phase (
 $\varPhi _v$) is also one critical parameter that determines the level of the effect imparted by particles to the fluid phase, that is, for
 $\varPhi _v<2\times 10^{-5}$, particles enhance turbulence, while for
 $\varPhi _v>2\times 10^{-4}$, particles reduce turbulence. Tanaka & Eaton (Reference Tanaka and Eaton2008) introduced a new dimensionless particle momentum number
 $Pa$, which is derived from the particle-laden Navier–Stokes equations, and defined by the
 $St$ number, the Reynolds number of unladen flow and the particle-to-fluid length scale ratio. It was suggested that particles reduce turbulence intensity at
 $Pa\sim O (10^{3}\text {--}10^{5})$, and otherwise enhance turbulence. More generally, many parameters have been proved to play a key role in evaluating the effect of particles on the turbulence statistics in turbulent particle-laden flows, such as the
 $St$ number, the particle-fluid scale ratio (or density ratio), the particle Reynolds number, the volume fraction and the particle momentum number. However, the effect of particles on turbulent structures was not considered in the abovementioned studies.
For turbulent structures in two-phase flows, there have been many studies on near-wall streaks, whereas few attempts have been made to study the VLSM to date. Portela & Oliemans (Reference Portela and Oliemans2003) conducted direct numerical simulations (DNS) and large eddy simulations (known as LES) of particle-laden turbulent flows in a vertical channel and found that for  $Re_\tau =500$,
 $St^{+}=0.1\text {--}1$ (
 $St^{+}=\tau _{p}u_\tau ^2/\nu$ is the wall-scaled Stokes number, in which
 $\tau _p=d_p^2\rho _p/18\mu$ is the relaxation time of particles,
 $\mu =\rho _a\times \nu$ is dynamic viscosity of air and
 $\nu$ is air kinematic viscosity,
 $\rho _a$ and
 $\rho _p$ denote the density of air and particles, respectively) and
 $\varPhi _v=2\times 10^{-5}$, the particles do not produce any significant changes in the sizes of the streamwise vortices. However, for horizontal channel flows, Dritselis & Vlachos (Reference Dritselis and Vlachos2008) presented DNS results indicating a larger diameter and length of the near-wall coherent structures in the particle-laden case than that of the particle-free case with
 $Re_\tau =177$,
 $St^{+}=200$ and
 $\varPhi _v=6.8\times 10^{-5}$. Later, Zhao, Andersson & Gillissen (Reference Zhao, Andersson and Gillissen2010) reported similar DNS results with
 $Re_\tau =350$ and
 $St^{+}=200$. In contrast, Li et al. (Reference Li, Wang, Liu, Chen and Zheng2012) conducted experimental studies on turbulence modification in a dilute gas–particle flow and concluded that the spatial scale of the coherent structures near the wall shrinks remarkably with the presence of particles when
 $Re_\tau \approx 430$,
 $St^{+}=100 \text {--} 290$ and
 $\varPhi _v=(1\text {--}5)\times 10^{-6}$. For particle-laden turbulent flow in a flat plate boundary layer, Li et al. (Reference Li, Wei, Luo and Fan2016) reported their DNS simulations with
 $Re_\tau \approx 400$,
 $St^{+}=10\text {--} 50$ and
 $\varPhi _v=6.67\times 10^{-4}$ that smaller particles with
 $St^{+}=10$ reduce the streak spacing while larger particles with
 $St^{+}=50$ widen it. Luo et al. (Reference Luo, Hu, Wu and Fan2017) revealed a decrease in the streak spacing in their DNS simulations with
 $Re_\tau \approx 400$,
 $St^{+}=24$ and
 $\varPhi _v=0.001$. To the authors’ knowledge, only two studies have examined the effects of particles on the LSM and VLSM in the outer layer. Tay, Kuhn & Tachie (Reference Tay, Kuhn and Tachie2015) investigated the effects of sedimenting particles on turbulent structures in a horizontal channel flow and demonstrated that large-scale structures are larger in the presence of particles than in the unladen flow with
 $St_{b} = 0.04$ (
 $St_{b}=\tau _{p}U_{max}/h$, where
 $U_{max}$ denotes the maximum streamwise mean flow velocity,
 $h$ is the channel half-height) and
 $\varPhi _v=(2 \text {--} 8)\times 10^{-4}$. The particle inertia in their experiment is relatively low. Wang & Richter (Reference Wang and Richter2019) emphasized the non-monotonic effects of particle inertia on the VLSM, that is, the low inertia and high inertia both strengthen the VLSM, whereas moderate and very high inertia have little influence. Nevertheless, the discussions about the influence of particles on the VLSM in their numerical studies neglected the impact of particle gravity. Actually, wind-blown sand movements near the surface are a typical example of two-phase wall turbulent flows laden with large-inertia and heavy sand particles. Many scholars have studied the effect of sand particles on near-wall turbulence through wind tunnel experiments. For example, Zhang, Wang & Lee (Reference Zhang, Wang and Lee2008) revealed that sand particles with diameters of
 $(100\text {--}125)\ \mathrm {\mu }\textrm {m}$ reduce the mean velocity profile and increase the turbulence intensity near the wall, while Li et al. (Reference Li, Wang, Liu, Chen and Zheng2012) found that the presence of polyethylene beads with diameters of
 $60$ and
 $110\ \mathrm {\mu }\textrm {m}$ increase the streamwise mean velocity but reduce the turbulence intensities near the wall. Li & McKenna Neuman (Reference Li and McKenna Neuman2012) conducted wind tunnel studies concerning the modification of turbulence by saltating particles and found that turbulence intensities and Reynolds stress increase with the mass transport rate in the near-bed region
 $z\leqslant 0.15\delta$ and aeolian saltation was demonstrated to increase the magnitude of burst-sweep events that primarily contribute to the total fluid stress. In summary, due to the complexity involved in wind-blown sand movements, it is difficult to achieve consistent conclusions about the turbulence modification imparted by the presence of saltating sand particles, which require more in-depth investigations. There has been a lack of research on the influence of particle–wall (P–W) interactions on the VLSM in two-phase turbulent flows.
In a certain kind of two-phase turbulent flow, especially wind-blown sand movements, particles that have a large inertia of  $St^{+}\sim O(10^{2}\text {--}10^{3})$ settle on the bottom wall under the effect of gravity and fluid drag and interact with the wall through impacting, rebounding and splashing. In the follow-up context, the particle motions near the wall are denoted as the P–W process, which is one of the basic processes that describes wind-blown sand movements. In the P–W process, particles impact and rebound from the wall, which introduces a non-uniform spatial distribution of particle concentrations and fluctuations. As a result, turbulence modifications imparted by the moving particles in wind-blown sand flows have different levels and results in different heights. For example, sedimentation particles augment the roughness of the bottom wall, leading to a larger streamwise velocity gradient near the wall. Therefore, for dispersed gas–solid or liquid–solid flows laden with large-inertia heavy particles, it is necessary to consider the effects of the P–W interactions when analysing the turbulence modification in the boundary layer. Although Zheng et al. (Reference Zheng, Zhang, Wang, Liu and Zhu2013) revealed the existence of VLSM in sandstorms, it is not clear whether VLSM exist in the near-wall region with a large number of inertia-heavy particles. Furthermore, how the P–W process affects the VLSM is also an open question. For this purpose, wind tunnel experiments were designed to clarify the effect and mechanism of turbulence modulation caused by P–W interactions. Simultaneous two-phase particle image/tracking velocimetry (PIV/PTV) measurements were conducted on a particle laden TBL over a horizontal smooth flat plate. Two types of sand-laden flows were generated by releasing sand particles by a sand feeder at the top wall and from a sand bed located at the bottom wall of the tunnel, respectively. For the first time, the results revealed the existence of the VLSM with streamwise scales larger than
 $3\delta$ in both types of particle-laden turbulent flows and demonstrated that the streamwise scales of the VLSM were obviously affected by the P–W process. This paper is organized as follows. Section 2 provides an introduction to the experimental set-up and methods. Section 3 presents the experimental results of the wind and sand particle velocities in the two types of wind-blown sand flows. Section 4 provides the analysis on the influence of the P–W process on the LSM/VLSM in the boundary layer. Finally, § 5 draws the conclusion.
2. Experimental set-up and validation
The experiments were conducted in a blow-type multifunctional environmental wind tunnel at Lanzhou University. The tunnel is 55.0 m long in total. The test section has a rectangular cross-section with a height of 1.45 m, a width of 1.3 m and a length of 20.0 m. The floor and sidewalls of the test section are made of Plexiglass for full optical access and the floor surface is smooth, as shown in figure 1. The free stream wind velocity  $U_{0}$ of this tunnel varies from
 $4.0$ to
 $40.0\ \textrm {ms}^{-1}$. In the present experiments,
 $U_{0}$ was set to
 $6.0\ \textrm {ms}^{-1}$ for both sand-free and sand-laden cases so that the background flow fields are consistent between the particle-free and particle-laden cases. The friction wind velocity
 $u_\tau =0.23\ \textrm {ms}^{-1}$ was assessed by the Clauser chart with log-law constants of
 $\kappa =0.41$ and
 $B=5.0$ based on the single-phase sand-free flow. It was used as a parameter to normalize the velocities of air and sand particles, as well as the wall-normal distance. The boundary layer shape factor was
 $H=1.36$, close to the prediction of the empirical correlation suggested by Chauhan, Monkewitz & Nagib (Reference Chauhan, Monkewitz and Nagib2009). In the same way, the thickness of the boundary layer was estimated as
 $\delta =0.148$ m by Coles law (Coles Reference Coles1956), the air kinematic viscosity was
 $\nu =1.7\times 10^{-5}\ \textrm {m}^2\ \textrm {s}^{-1}$ and the friction Reynolds number based on
 $\delta$ and
 $u_\tau$ was
 $Re_\tau = u_\tau \delta /\nu \approx 2002$.
Working section of the wind tunnel taken from the inside.

To clarify the influence of the P–W interactions on the near-wall turbulent structures in the wind-blown sand-laden flows, two initial conditions were designed for particle releasing, as shown in figure 2. In the first case, hereinafter named case 1, sand particles were released from a sand bed with dimensions of  $1.0\ \textrm {m}\ (\textrm {long}) \times 1.3\ \textrm {m}\ (\textrm {wide})\times 0.02\ \textrm {m}$ (deep) located 1.5 m downstream of the wind tunnel test section entrance and shown as the yellow area in figure 2. The equivalent sand-grain roughness height was approximately
 $k_s^{+}\sim 16$, which was estimated according to Ligrani & Moffat (Reference Ligrani and Moffat1986). In this way, sand particles were entrained by wall shear, transported by wind drag, impinged on and rebounded from the wall continuously so that it established a fully developed saltation flow. In the second case, termed case 2, sand particles were released from the ceiling at the entrance of the test section through a feeder located at 2 m downstream from the wind tunnel test section entrance, as shown in figure 2. Herein, the sand particles fell downward due to gravity and were transported along the flow direction under the same wind shear as in case 1, which further formed a sand-laden flow. It should be noted that there is one difference between the sand-laden flows formed in case 1 and case 2, i.e. all the transported particles in the former case participated in the flow through the P–W process, while only a fraction of particles in the second case were transported through the P–W process. The PIV measurements in case 2, case
 $2'$ and case 0 (see table 1) all lasted 640 s and we captured 3200 pairs of images, respectively, without artificial interruption which ensured the flow condition remained stable in each case. As for case 1 the sand mass lost due to surface erosion was supplemented to ensure the stable release of sand particles as far as possible. In detail, the experiments of case 1 were repeated in eight runs, and for each run 400 pairs of images were captured. The consumption of the sand bed due to surface erosion was approximately 0.0015 m in height over a typical experiment duration of 80 s. During the interval between two adjacent experimental runs, new sand particles were supplemented to keep the size and smoothness of the sand bed consistent in each run without adjusting the incoming wind conditions. In the follow-up analysis of this paper, the statistical averaging of eight runs (3200 pairs of images, the same as in case 2, case
 $2'$ and case 0) in case 1 are carried out to eliminate the discreteness of the statistical results. The characteristic conditions of the four cases mentioned above are listed in table 1. The eddy turnover time (
 $\delta /U$) was approximately 0.247 s and the viscous time (
 $\nu /{u_\tau }^2$) was approximately
 $3.3\times 10^{-4}$ s, thus the PIV system recorded approximately 2560 eddy turnovers. In addition, to reduce the sedimentation of sand particles on the bottom wall, the maximum feeding rate of the sand feeder was controlled below
 $38\ \textrm {gs}^{-1}$. To compare the influence of the volume fraction on the results, two different feeding rates were set,
 $35$ and
 $6\ \textrm {gs}^{-1}$, denoting case 2 and case
 $2'$, respectively. The sand particles employed in this experiment were from natural sand sampled from the Badain Jaran Desert, China. The sand particle diameters (
 $d_{p}$) follow a lognormal distribution ranging from
 $74 \ \mathrm {\mu }\textrm {m}$ to
 $352\ \mathrm {\mu }\textrm {m}$ with a mean value of
 $189\ \mathrm {\mu }\textrm {m}$. Correspondingly, the Stokes numbers (
 $St^{+}$,
 $St^+=\tau _p{u_\tau }^2/\nu$, where
 $\tau _p=\rho _p{d_p}^2/(18\rho _f\nu )$ is the particle relaxation time,
 $\rho _p$ and
 $\rho _f$ are the particle and air density, respectively) of the employed sand particles range from 147 to 2069.
Schematic view of the wind tunnel configuration and experimental set-up.

Measurement conditions of the four cases, where SRT, FR, SR, SE denote sand-releasing type, sand feeding rate, PIV sampling rate and PIV sampling ensemble, respectively.

A two-dimensional PIV system was used to measure the two-phase flow field on the symmetric streamwise-wall-normal ( $x$–
 $y$) plane of the TBL, as shown in figure 2 (Zhang et al. Reference Zhang, Wang and Lee2008; Li et al. Reference Li, Wang, Liu, Chen and Zheng2012). The sand-laden flows were fully developed. In particular, the concentration, spatial distribution and velocities of the sand phase were statistically stationary. Considering the free stream wind velocity
 $U_{0}= 6\ \textrm {ms}^{-1}$, the developing duration for wind-blown sand flow on an erodible bed (1.6 s according to Zheng, Huang & Zhou Reference Zheng, Huang and Zhou2006) and the settling time of the sand particles from the ceiling, the required distances from the centre of the sand bed in case 1 and the sand feeder in case 2 and
 $2'$ to the field of view (FOV) of the PIV system should be greater than 6 and 4 m, respectively, to ensure that the wind-blown sand flows are statistically steady. Therefore, the FOV of the PIV system was set 6 m downstream from the centre of the sand bed in case 1 and the sand feeder in cases 2 and
 $2'$, which is 8 m downstream from the inlet of the test section. In this PIV system, a dual-head Nd:YAG laser with a wavelength of 532 nm and an energy output of
 $200\ \textrm {mJ}\ \textrm {pules}^{-1}$ was used as the light source. The laser beam was shaped into a planar sheet to illuminate the symmetric plane of the test section with a thickness of 1 mm. To minimize the wall reflection that affects the near-wall measurement, the laser sheet was directed along the upstream direction via a refractor mirror placed approximately 0.58 m downstream of the measurement region and 9.4 m downstream from the inlet of the test section. The width of the reflection mirror is 0.03 m, and the distance from the mirror to the downstream edge of the measurement is more than 5 m, equivalent to approximately 18 times the width of the mirror. By the hot-wire measurement of single-phase flow with the same conditions, the mean statistics in the PIV-FOV with and without the mirror in place match. Oil droplets with an average diameter of
 $2\ \mathrm {\mu }\textrm {m}$ generated by a pressurized liquid-droplet seeding generator were released into the free stream from the entrance of the tunnel to serve as the tracer particles of the gas phase. To capture the LSM/VLSM in the FOV, four synchronized frame-straddled charged-coupled device (CCD) cameras (IMPERX ICL-B2520M) were employed and aligned along the streamwise direction. Using four Nikon 50 mmf/1.8D lenses, the laser-sheet-illuminated domain was jointly imaged with an FOV of approximately
 $82.4\ \textrm {cm}\times 18.4\ \textrm {cm}$, corresponding to
 $5.6\delta \times 1.2\delta$ scaled by the thickness of the boundary layer. The resolution of the CCD was
 $2058 \times 2456$ pixels, and the optical magnification was approximately
 $89.4\ \mathrm {\mu } \textrm {m}\ \textrm {pixel}^{-1}$. The sampling rate of all three cases was 5 Hz, and the time interval between the two straddle frames was fixed at
 $170\ \mathrm {\mu }\textrm {s}$.
2.1. Extraction of wind and sand velocities
For the three particle-laden cases, the wind and sand velocities were extracted by a method similar to the one employed in Khalitov & Longmire (Reference Khalitov and Longmire2002), Zhang et al. (Reference Zhang, Wang and Lee2008) and Zhu et al. (Reference Zhu, Pan, Wang, Liang and Ji2019). Figure 3 demonstrates the image processing of separating raw two-phase images into images of particles and fluid tracers through three main steps, i.e. background subtraction, particle identification and two-phase separation. Figure 3(a) shows a raw image obtained by the CCD camera, from which it can be seen that the background noise and light pollution caused by wall reflection are inevitable, especially in the near-wall region. To improve the accuracy of the following particle identification and phase separation steps, a Gaussian blur filter was first adopted to reduce the high-frequency spatial noise in the raw image, and the filtered image is shown in figure 3(b). Based on the filtered images, the images of fluid tracers and sand particles can be obtained separately. Then, a digital mask for the sand particles was generated to separate the signals from the two phases in a pair of recordings by the predetermined thresholds of particle image diameter and intensity. The particle image diameters of the tracers and sand particles were estimated with the assumption of diffraction-limited imaging and the Gaussian intensity distribution (Adrian Reference Adrian1991), i.e.  $d_{e}=(M^{2}d_{p}^{2}+d_{s}^{2})^{1/2}$, where
 $M$ is the magnification factor,
 $d_{p}$ is the particle diameter and
 $d_{s}$ is the spot size of a diffraction-limited lens, as
 $d_{s}=2.44(1+M)f^{*}\lambda$,
 $f^{*}$ is the
 $f$-number of the lens and
 $\lambda$ is the wavelength of the laser light. Substituting the diameter of the sand particles, the pixels occupied by a sand particle in this experiment were 5–50 pixels (
 $M =1$,
 $f^{*}=5.6$ and
 $\lambda =532$ nm), while the averaged fluid tracer particle was estimated to be approximately 2 pixels. Once an image had its background subtracted, as figure 3(b), it was convoluted with a median filter with large kernel size to block the tracer particles, so as to get the image with sand particles, see figure 3(c). The original image was filtered again by another median filtering with a smaller kernel size. The yielded image component was then subtracted from the original component to remove large sand particles, see figure 3(d). After a trial-and-error test, the size of the smaller filter was chosen to be
 $2\times 2\ \textrm {pixels}^2$, equivalent to the typical size of the tracer particles, and that of the larger filter was
 $5\times 5\ \textrm {pixels}^2$, equivalent to the smallest size of the sand particles. In addition, the sand particle images show high light intensity, mostly with a grey level of more than 600. The intensity threshold (IT) is used to separate the sand particles with low brightness which are outside the laser light sheet but illuminated by the strong scattering of the sand particles in the laser sheet. It is necessary to exclude these particles from the sand-only image, so as to make the PTV matching more accurate (Baek & Lee Reference Baek and Lee1996; Ohmi & Li Reference Ohmi and Li2002). Therefore, a diameter threshold (DT) of
 $5$ pixels and an IT of 600 were determined to distinguish the sand particles from tracers, as shown in figure 3(c). Subtracting figure 3(c) from 3(b), it can obtain the image of the tracers, as shown in figure 3(d).
Image processing for separating raw two-phase images (image size:  $1200\ \textrm {pixel} \times 500\ \textrm {pixel}$) into images of particles and wind traces: (a) raw image; (b) image after background subtraction; (c) sand-only images after particle identification; and (d) tracer-only images after two-phase separation. The white lines that are clearly visible at the bottom of panels (a,b) represent the floor surface.

After the phase separation, the tracer-only images were used to extract the wind velocity field through the PIV cross-correlation algorithm, while the particle velocities can be derived via the two-frame PTV algorithm. The former is the adaptive PIV algorithm of the Dantec Dynamic Studio with an interrogation widow of  $16 \times 16$ pixels and an overlap ratio of
 $50\,\%$. The relative error in the gas phase velocity measurement was estimated to be approximately
 $1\,\%$. The latter is the 2-frame two-dimensional PTV algorithm of the Dantec Dynamic Studio, which is also a modified version of Sciacchitano, Wieneke & Scarano (Reference Sciacchitano, Wieneke and Scarano2013). It is worth mentioning that the regions of removed sand particle images were replaced with the locally averaged background intensity in advance to minimize the influence on the two-point correlations of the subsequent calculations as much as possible.
For the P–W process in sand-laden cases, a definition is provided here. Figure 4 shows the sand particles identified in an arbitrarily selected particle image, in which red and white dots represent the upward and downward-moving sand particles, respectively. On the one hand, the set-up of the PIV system shown in figure 2 is reasonable, that means, the distribution of sand particles along the wind direction is relatively uniform in the FOV to ensure the statistical stationarity required in the following analysis. On the other hand, it illustrates great differences in the distribution of the vertical velocities of the sand particles and the number of descending particles near the bottom wall between case 1 and case 2. By counting the number of ascending and descending sand particles at a given height, denoted as  $n_{up}$ and
 $n_{down}$, respectively, the P–W process is defined via the ratio
 $\gamma =n_{up}/(n_{up}+n_{down})$. That is,
 $\gamma \approx 0$ indicates that the particles at
 $z$ are dominated by downward-moving particles, while very few particles jump to this height through the P–W process. In contrast,
 $\gamma \approx 0.5$ represents that the numbers of ascending and descending sand particles are almost equal, and thus, most sand particles jump to this height after the P–W process. It should be pointed out that mid-air collisions may also introduce ascending sand particles without contacting the wall, but the probability of mid-air collisions has been proved to be very small (Sørensen & McEwan Reference Sørensen and McEwan2006). Even if the mid-air collisions are considered, it is also more stringent to define the P–W process using the ratio
 $\gamma \neq 0$.
The detected ascending and descending sand particles in an instantaneous particle image of (a) case 1 and (b) case 2. The red and white dots represent the ascending and descending sand particles, respectively.

It is noted that the diameter and IT adopted in the phase separation process may affect the particle number identified in each two-phase image. To test the sensitivity of the results in misidentifying particles, the DT is changed from 5 pixels to 10 pixels, the IT is changed from 600 to 1000, and some statistical results are analysed and compared in figure 5. Figure 5(a) presents the results of the volume fraction with the original and new thresholds. It is found that the number of the identified particles is reduced by more than  $40\,\%$ using the new thresholds, but the variations of the volume fractions versus height display similar trends. Furthermore, the streamwise particle velocity and the ascending-total ratio of sand particles extracted based on the two thresholds are compared in figures 5(b) and 5(c), respectively. It can be found that the results are basically not affected by the misidentification. This is because the misidentification of sand particles due to different thresholds takes place uniformly within the whole FOV, and no specific types of particles (such as ascending or descending ones) are preferentially selected out by the threshold. Therefore, the statistics of sand particles including the velocity and the ascending–descending ratio are not significantly affected by the identification threshold.
Variations of (a) the volume fraction ( $\varPhi _v$), (b) the streamwise velocities of sand particles (
 $U_{p}^{+}$) and (c)
 $\gamma$ with height based on different identification thresholds.

2.2. Validation of wind velocity field
To validate the reliability of the experimental measurements, the flow fields of single-phase flows were firstly measured, denoted as case 0. The profiles of the mean streamwise wind velocity ( $U^{+}$) and the streamwise TKE (
 $u^{2+}$) normalized by the inner scale are compared with the DNS simulation results of TBL with similar Reynolds number conditions (Sillero, Jiménez & Moser Reference Sillero, Jiménez and Moser2013). Figure 6(a) shows that the PIV-measured
 $U^{+}$ in this experiment almost overlaps with the DNS result, with a maximum difference of less than
 $5\,\%$. The profile of
 $u^{2+}$, as shown in figure 6(b), also agrees well with the DNS data, with local differences coming from the lack of a time resolution in the PIV measurement, which means that the small-scale turbulent structures may not be fully resolved. Since the topic of this study is large turbulent structures, especially the LSM/VLSM in the outer region, the lack of PIV resolutions for the small-scale structures near the wall may not affect the accuracy of the following analysis.
Comparison between the PIV and DNS results (Sillero et al. Reference Sillero, Jiménez and Moser2013) for single-phase flow: (a) time-averaged streamwise velocity  $U^{+}$ and (b) streamwise TKE
 $u^{2+}$.

3. Velocity characteristics
Based on the measurements introduced in § 2, this section presents the results and analysis of the velocity characteristics of the air phase and particulate phase in the two kinds of sand-laden flows, focusing on the P–W process and the volume fraction, as well as their effects on the statistics of flow and particle velocities.
3.1. The P–W process
In § 2.1, it has been pointed out that the ratio of the ascending and total particle numbers  $\gamma =n_{up}/(n_{up}+n_{down})$ can serve as a parameter to judge whether the P–W process occurs in sand-laden flows. The ascending particles can be regarded as particles after the P–W process and rebound into the boundary layer, while the descending particles consist of two parts, one is the falling particles newly entering the boundary layer, and the other is the particles undergoing continuous saltation near the wall. The height range of the latter part of the descending particles should be generally consistent with that of the ascending particles. Therefore, the ratio of the ascending to total particles provides a probe to distinguish the region with or without obvious P–W effect through identifying the inflection point where the ratio varies significantly. For further analysis, the positions and the vertical orientations of sand particles in case 1 and case 2 are marked, as shown in figures 7(a) and 7(b), respectively. The background is the instantaneous flow field of the air phase, and the red and blue ‘squiggles’ denote the ascending and descending velocities, respectively. Then, the variations of
 $\gamma$ with height in the bottom-releasing case (case 1) and top-releasing case (case 2 and case
 $2'$) can be estimated through the time-average of the
 $n_{up}$ and
 $n_{down}$ at each height, as shown in figure 8(a). Figure 8(b) demonstrates the convergence of
 $\gamma$ at different heights with sampling picture numbers (
 $n_{sampling}$). It can be seen that the statistical means of
 $\gamma$ at different heights converge well into constant values and the
 $n_{sampling} =3200$ is enough to present reliable analysis on
 $\gamma$.
Instantaneous positions and vertical orientations of the moving particles in (a) case 1 and (b) case 2. The background colour maps represent the instantaneous flow field.

(a) Variations of  $\gamma$ with height in the bottom-releasing case (case 1) and top-releasing case (case 2 and case
 $2'$). (b) The variations of
 $\gamma$ at different heights with sampling picture numbers (
 $n_{sampling}$).

Denoting  $\gamma _1$,
 $\gamma _2$ and
 $\gamma _{2'}$ as the ratios in case 1, case 2 and case
 $2'$, respectively, figure 8(a) shows significant differences between
 $\gamma _1$ and
 $\gamma _2$ that vary with height. First,
 $\gamma _1$ is almost equal to
 $0.5$ at all heights, while
 $\gamma _2$ is almost equal to 0 above a certain height
 $z_0^+=400$. This critical height of the P–W process is defined as the first position at which the slope of the
 $\gamma$ curve occurs large variation along the height. For case 1,
 $\gamma _1$ is mainly approximately
 $0.5$ with certain fluctuations near the wall, which means that the number of sand particles jumping upward from the bottom wall is almost the same as those falling downward to impinge on the wall, which is also demonstrated in figure 7(a). Although the number of sand particles in figure 7(a) is relatively small and most of them move near the wall,
 $n_{up}$ and
 $n_{down}$ in this case are almost equal at various heights, which indicates a strong P–W process in the whole boundary layer in case 1. For case 2,
 $\gamma _2$ is approximately equal to zero at
 $z^+>z_0^+$, which implies that there are almost no ascending sand particles from the bottom of the wall above this height, as also shown in figure 7(b). In addition, figure 7(b) demonstrates that the closer to the wall the location is, the more ascending sand particles there are. With increasing height, the number of ascending particles decreases significantly above
 $z^+=400$, where descending particles are dominant. This decrease indicates that in the sand-laden flow of case 2, the particles moving above
 $z_0^+$ are mainly descending particles that have not collided with the bottom wall after their release, so there is no P–W process above
 $z^+\sim 400$ in case 2.
Second, as shown in figure 8(a), the curve of  $\gamma _2$ gradually increases with the decrease in height at
 $z^+<z_0^+$, approaching close to
 $0.5$ near the bottom wall, which indicates that the number of sand particles jumping upward from the wall increases. Therefore, it is suggested that the P–W process takes place within the range of
 $z^+<z_0^+$ in case 2. Moreover, denoting the height at which
 $\gamma _2= \gamma _1$ as
 $z_{21}^+$ (
 $z_{21}^+\sim 50$), it can be found that the degree of the P–W process in case 2 is weaker than that in case 1 in the range (
 $z_{21}^+$,
 $z_0^+$) due to
 $\gamma _1> \gamma _2$. It should be mentioned that the location of
 $z_0^+$ in case 2 is obviously related to the mass loading (or feeding rate) released from the sand feeder. Therefore, another case, case
 $2'$, was added with a lower feeding rate in the experiments. Through analysing the variation in the ratio
 $\gamma$ versus
 $z^+$, it can estimate the height judging whether or not the P–W process happens in case
 $2'$ is
 $z_0'^{+}\sim 1000$. The inflection points of the
 $\gamma$ curves in case 2 and case
 $2'$ are different. That is, the critical heights for judging that range of the P–W process are different, because the average velocities of the particles in case
 $2'$ are higher than those in case 2, which makes the take-off particles undergoing the P–W process have higher jumping velocities in case
 $2'$. Furthermore, particles in case
 $2'$ have higher rebound heights, and thus higher critical height in the statistics.
3.2. The volume fraction
As mentioned in the introduction, many parameters have been proved to play key roles in evaluating the effect of particles on the turbulence statistics in turbulent particle-laden flows. To investigate the influence of the P–W process, the sand particles employed in case 1, case 2 and case  $2'$ have the same size distribution and the free stream wind velocity
 $U_{0}$. Meanwhile, the corresponding friction Reynolds number was also kept the same during each experimental run, so that the
 $St$ numbers, particle-fluid scale ratios (density ratios), particle Reynolds numbers and particle momentum numbers of the two types of sand-laden flows were generally the same. One exception is the particle volume fraction. The particle volume fraction (
 $\varPhi _v$) can be estimated based on the box counting method (Kulick, Fessler & Eaton Reference Kulick, Fessler and Eaton1994; Aliseda et al. Reference Aliseda, Cartellier, Hainaux and Lasheras2002). The entire FOV domain (
 $82.4\ \textrm {cm} \times 18.4\ \textrm {cm}$) was divided into a set of sub-boxes, each of which having a size of
 $\Delta x\times \Delta y = 14\times 1.4\ \textrm {mm}^{2}$ with an overlap ratio of
 $50\,\%$. The local particle volume fraction in each sub-box is calculated as
 $\phi _{v}(x,y,t)={{\rm \pi} d_{p}^{3} N(x,y,t)}/{(6\Delta x \Delta y \Delta z})$, where
 $\Delta z$ represents the thickness of the light sheet, and
 $N (x, y, t)$ is the number of the identified sand particles within one sub-box. The distributions of
 $\varPhi _{v}$ in case 1, case 2 and case
 $2'$, denoted as
 $\varPhi _{v1}$,
 $\varPhi _{v2}$ and
 $\varPhi _{v2'}$, respectively, are presented in figure 9. It shows that in the higher flow layer,
 $\varPhi _{v1} \sim O(10^{-8})$, while
 $\varPhi _{v2}\sim O(10^{-4})$. For the lower feeding rate case (case
 $2'$),
 $\varPhi _{v2'}$ has a similar trend as
 $\varPhi _{v2}$ but less than
 $\varPhi _{v2}$ by an order of magnitude, which is approximately
 $O(10^{-5})$ in the higher flow layer. The reason for both
 $\varPhi _{v2}$ and
 $\varPhi _{v2'}$ being much larger than
 $\varPhi _{v1}$ in the higher layer may be that the sand particles released from the top in case 2 and case
 $2'$ settle downward from the outside of the boundary layer to the wall under the action of gravity, which leads to the sand particles being distributed at various heights in the whole boundary layer. However, in case 1, sand particles are released from the surface, the jump height of sand particles is limited, and only a few particles could jump to the higher positions of the boundary layer. Therefore, case 2 and case
 $2'$ can be regarded as dense gas–solid flows in the whole boundary layer, whereas case 1 is a dense gas–solid flow only in the near-wall and logarithmic region and a dilute gas–solid flow outside the logarithmic region.
The variations of the volume fraction with height in cases 1, 2 and  $2'$.

It is worth noting that the particle volume fractions in case 1, case 2 and case  $2'$ increase as the bottom wall is approached. In case 1, the sand particles are released from the bottom wall and cannot escape the near-wall region which introduce a higher particle volume fraction near the wall. Therefore,
 $\varPhi _{v1}$ shows a monotonous decreasing trend with the wall-normal location. While in case 2 and
 $2'$, the particles are released from the ceiling of the wind tunnel, falling through the boundary layer, which induce a higher volume fraction at higher place than case 1. The trends of
 $\varPhi _{v2}$ and
 $\varPhi _{v2'}$ may be related to the occurrence of the P–W process. Thus, in figure 9,
 $z_0^+$ and
 $z_0'^{+}$ described in § 3.1 are marked as the critical height for the P–W process in case 2 and case
 $2'$, respectively, and it shows that they correspond to the heights at which the particle volume fractions in case 2 and case
 $2'$ begin to increase significantly. It can be understood that the sand particles falling below this height rebound and continue to saltate after interactions with the wall. The continuous saltating sand particles sharply increase the local particle volume fraction near the wall. The closer to the wall the location is, the greater the number of saltating sand particles there will be, and thus the greater the particle volume fraction is. As a result, the mechanism of the variation trends of
 $\varPhi _{v2}$, and
 $\varPhi _{v2'}$ is different from that of
 $\varPhi _{v1}$. That is, particles are trapped closer to the wall in case 1 due to the effect of gravity, and that turbulent transport is not sufficient to transport them farther from the wall, while the local increase in the particle volume fraction in case 2 and case
 $2'$ is introduced by the presence of rebounding particles from the bottom wall due to the P–W process.
3.3. Flow and particle velocities
To investigate the influence of the P–W process, the time-averaged profile of flow and particle velocities in case 1 and case 2 are analysed, which is shown in figure 10, where  $U_f$ and
 $U_p$ represent the mean velocity of air flow and particles, respectively. First, the streamwise velocities of the sand particles in case 2 are higher than those in case 1 at any height in the whole boundary layer, which is mainly due to the acceleration of the top-released particles in case 2 by the high-speed flows outside the boundary layer during their descent. The falling particles in case 2 have greater velocities than the local mean air velocity and thus are analogous to sweep events. The sand particles in case 1 are initiated from the sand bed and sustain their continuous saltation by momentum exchange with the local fluid in the boundary layer, resulting in smaller velocities than the local mean flow velocity. Therefore the particle velocities in case 1 are less than those in case 2. Second, comparisons between the mean streamwise velocity profiles of the flow fields in the two particle-laden flows cases (case 1, case 2) and that of the single-phase flow case (case 0) illustrate that the mean streamwise flow velocity of case 2 is higher than that of case 0 above the middle of the logarithmic region, as a result of the invasion of the high-velocity falling sand particles from the outside of the boundary layer in case 2. At the bottom of the boundary layer, the mean streamwise flow velocities in case 1 and case 2 are both lower than that in case 0 because of the momentum loss of the flow fields in the particle-laden flows to sustain the near-wall saltations and sedimentations of the sand particles, which have a blocking effect on the flow fields. With increasing height, the P–W particle numbers decrease, and the blocking effect becomes weak. In case 1, the mean streamwise velocity is lower than that of the single-phase flow along the whole boundary layer. This is because the sand particles have smaller velocities than that of the local fluid flow, which act as impediments to the fluid.
The variations of the streamwise velocity of the carrier and particulate phases in case 1, case 2 and case  $2'$, compared with case 0. Here
 $U_{f}^{+}$ and
 $U_{p}^{+}$ represent the mean velocities of air flow and particles normalized by
 $u_{\tau }$, respectively.

Finally, the differences between sand particle velocities and flow velocities in cases 1 and 2 are analysed. As shown in figure 10, the velocities of sand particles in case 1 are always lower than that of the flow field. This difference is because the saltating sand particles released from the surface are accelerated by air drag but slowed down due to the momentum loss through the P–W process, and thus, the average velocity of sand particles does not exceed the mean velocity of the flow field. In other words, the P–W process makes the velocities of sand particles in equilibrium lower than that of the flow. For case 2, above a certain height, the sand velocity is almost the same as the flow field velocity because the sand particles have been accelerated outside the boundary layer during their fall to the bottom, and the velocities of these particles are nearly consistent with the local average wind velocities without contacting the wall. Below this height, the average velocity of the sand particles is lower than that of the flow field, and with the decrease in height, the difference increases. Since the height is  $z_0^+$, that is, the height below which the sand particles falling from the sand feeder undergo the P–W process in case 2, the P–W process leads to a rapid decrease in particle velocity below this height, which further introduces a velocity difference between the average velocities of sand particles and the mean velocity of the flow field due to momentum exchange. Nevertheless, the velocities of sand particles and the flow field of case 2 are higher than those of case 1. This difference can be explained by the fact that below the height
 $z_0^+$, both case 2 and case 1 undergo the P–W process, while as mentioned earlier, above the logarithmic region of the boundary layer, the P–W process of case 2 is weaker than that of case 1, which means that the velocities of sand particles and the flow field of case 2 are higher than that of case 1.
It is worth pointing out that the differences in the velocities of sand particles and wind flow between case 2 and case 1 do not originate from the difference in the particle volume fraction between them. Since case 2 has a higher particle volume fraction than case 1, it is reasonable to infer that the decrease in the mean wind velocity in case 2 should be more significant due to its higher particle volume fraction. However, the mean wind velocity profile of case 2 is significantly higher than that of case 1. Therefore, the difference in the particle volume fractions between case 2 and case 1 is not the key factor leading to the difference between the velocities of sand particles and wind flow fields.
4. Characteristics of the VLSM
The instantaneous velocity fields were measured and analysed based on the tracer-only images of PIV. Typical instantaneous  $u$-component flow fields in case 0, case 1 and case 2 are shown in figure 11(a–c), in which the black dots and arrows denote the instantaneous positions and velocity vectors of sand particles. As seen from figure 11(a), there exist continuous low-speed regions alternating with high-speed regions in the flow field, corresponding to the VLSM and LSM in the outer region. For the sand-laden flows displayed in figure 11(b,c), the presence of many moving sand particles (yellow spots) can induce a significant decrease in the flow velocity near the wall, especially in the logarithmic region. The quasi-periodic alternating high- and low-speed regions become less obvious than those in figure 11(a), which means that the presence of sand particles in the wind-blown sand-laden flows has a significant impact on the turbulent structures in the outer region. In addition, by comparing the distribution of the sand particles in figure 11(b,c), it can be directly found that the spatial distributions of sand particles in the two types of sand-laden flows are significantly different, i.e. most of the sand particles in case 1 move near the wall, while in case 2, there are a large number of sand particles moving in the middle and upper region of the boundary layer. Because the saltating sand particles cannot easily jump into the upper part of the boundary layer under the flow conditions in the experiment, it infers that a large part of the moving sand particles in case 2 are carried by the flow and directly enter the measurement region without any P–W process. This occurrence also confirms once again that the P–W process has a significant effect on the spatial distribution of sand particles in sand-laden flows.
Instantaneous  $u$-component velocity fields of the carrier phase in the
 $x$–
 $z$ plane. (a) Case 0, (b) case 1 and (c) case 2.

To further analyse the VLSM in sand-laden flows and the influence of the P–W process, two-point autocorrelations of the streamwise velocity components at different reference points were calculated, as shown in figures 12 to 15. The white solid lines are the contours of the correlation coefficient  $R_{uu} = 0.15$. The reference points are taken as the location at the bottom of the logarithmic region,
 $z^{+}=72$, as shown in figure 12, that in the middle of the log layer,
 $z^{+}=202$, as shown in figure 13, the location at the top of the log layer,
 $z^{+}=404$, as shown in figure 14 and that in the wake region,
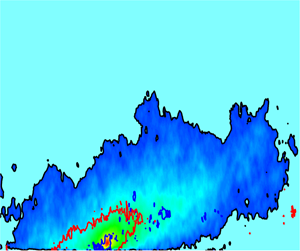
 $z^{+}=1212$, as shown in figure 15. Panels (a), (b) and (c) in each figure correspond to case 0, case 1 and case 2, respectively. From figure 15(c), it is seen that in the flow fields of the sand-laden flows, there exist VLSM with length scale larger than
 $3\delta$ in the streamwise direction at
 $z^{+}=1212$. This finding is being reported for the first time in sand-laden flows generated in the TBL. However, except for the obvious difference in the streamwise scales of the VLSM in the particle-laden flows and that in the single-phase flow, no VLSM can be identified in figure 12(b,c). In this paper, this finding suggests that this is mainly caused by the P–W process in the wind-blown sand flow.
Contours of the spatial two-point correlation coefficient of the streamwise flow velocity fluctuations in the single-phase flow (a) and the two types of sand-laden flows (b,c) with the reference point at  $z^{+}=72$.

Contours of the spatial two-point correlation of the streamwise flow velocity fluctuations in the single-phase flow (a) and the two types of sand-laden flows (b,c) with the reference point at  $z^{+}=202$.

Contours of the spatial two-point correlation of the streamwise flow velocity fluctuations in the single-phase flow (a) and the two types of sand-laden flows (b,c) with the reference point at  $z^{+}=404$.

Contours of the spatial two-point correlation of the streamwise flow velocity fluctuations in the single-phase flow (a) and the two types of sand-laden flows (b,c) with the reference point at  $z^{+}=1212$.

First, the VLSM exist at the bottom of the logarithmic region in the single-phase flow, as the region surrounded by the white contours shown in figure 12(a). However, in figure 12(b), it is almost impossible to identify any region enclosed by the white contours, which indicates that the VLSM at the bottom of the log layer are destroyed by the presence of moving sand particles. Similarly, the enclosed region given by the white contour in figure 12(c) is significantly smaller than that in figure 12(a), indicating that the sand particles released from the top of the wind tunnel also significantly reduce the scales of the VLSM in case 2. Considering that the reference point is at  $z^{+}=72$ (
 $<z_0^+$ ), the P–W process occurs in the regions in both case 1 and case 2. Furthermore, since
 $z^{+} >z_{21}^+$ indicates that the P–W process in case 2 is weaker than that in case 1 in this region, the scales of the enclosed region in figure 12(c) are larger than those in figure 12(b).
Second, for the VLSM in the middle of the logarithmic region, i.e.  $z^{+}=202$, the scales of the VLSM, as shown in figure 13(a), are relatively larger than those at
 $z^{+}=72$, as shown in figure 12(a) in the single-phase case. This finding is consistent with the conclusion given by Liu, Wang & Zheng (Reference Liu, Wang and Zheng2017b) that the scales of the VLSM increase with height in the log layer. At
 $z^{+}=202$ (
 $<z_0^+$), the scales of the VLSM in the sand-laden flows, as indicated by the enclosed regions in figure 13(b,c), are obviously reduced compared with that in the single-phase flow in figure 13(a). Compared with figure 12(b,c), the VLSM in the middle of the log layer are relatively larger than those at the bottom of the log layer for both sand-laden flows because the P–W processes at this height are relatively weaker than those at
 $z^{+}=72$. This result means that the influence of sand particles on the VLSM is weakened in the middle of the log layer, which to a lesser extent reduces the scales of the VLSM. Similarly, since the P–W process in case 2 is weaker than that in case 1, the enclosed region in figure 13(c) is larger than that in figure 13(b). For figure 14, similar analyses are conducted to that at the top of the log layer
 $z^{+}=404$. The comparison of the statistical morphology of the VLSM in figure 14 shows that the VLSM in case 1 have similar shapes but a reduced size as that in case 0. Affected by the presence of the moving sand particles near the wall, the bottom edge of the VLSM in case 1 does not extend to the wall. The shape of the VLSM in case 2 is significantly different from that in case 0. On the one hand, VLSM in case 2 have less inclination to the wall, which seems almost parallel to the wall. On the other hand, the presence of the moving sand particles near the wall also make them farther from the wall. The streamwise length scales of the enclosed regions in figure 14(c) are close to those in figure 14(a) because the height is very close to the critical height
 $z_0^+$, where the P–W process is very weak in case 2.
Finally, figure 15 illustrates the VLSM in the wake region in the single-phase and sand-laden flows. It shows that the scales of the VLSM are slightly smaller than those at the top of the log layer, which agrees with the existing results (Tomkins & Adrian Reference Tomkins and Adrian2003). For the sand-laden flows, the P–W process still occurs at  $z^{+}=1202$ in case 1 but does not occur in case 2. Therefore, for case 1, the region enclosed by the white contours in figure 15(b) is smaller than that in the single-phase flow, as shown in figure 15(a). Since the sand particles are sparsely distributed at this height, the effect of the P–W process is relatively weaker than that at the bottom of the log layer, and the scales of the VLSM are not obviously reduced in this region. For case 2, the region enclosed by the white contours in figure 15(c) is significantly larger than that in figure 15(a) because no P–W process occurs at this height in case 2 and the falling sand particles obtain energy outside the log layer that enhance the VLSM here.
Based on the above observations and analysis, the variations in the scales of the LSM/VLSM with reference height ( $z_{ref}^{+}$) of case 0, case 1 and case 2 are plotted in figure 16. From figure 16, it can be seen that in the single-phase flow, the turbulent structures identified by the two-point correlations with the coefficient
 $R_{uu} = 0.15$ are larger than
 $3\delta$ in the logarithmic region, which corresponds to the VLSM. The scales of the VLSM first increase with
 $z_{ref}^{+}$ approaching the top of the log layer and then decrease with height in the wake region, which further confirms the variation law of the scales of the VLSM with height in the middle of the log layer and the outer region given by the existing results in the TBL (Tomkins & Adrian Reference Tomkins and Adrian2003). Second, it is found that for the sand-laden flow of case 1, the maximum turbulent structure identified in the flow field is larger than
 $3\delta$, while at the bottom of the log layer, it is difficult to identify an enclosed region where the flow fluctuations are significantly correlated. This finding indicates that the presence of the saltating sand particles in case 1 reduces the correlations of the flow field and that the VLSM are destroyed in this region. For the sand-laden flow in case 2, as shown in figure 16, the streamwise scales of the turbulent structures in the higher flow layer are significantly larger than those in case 1 and even larger than those in case 0, which indicates that the sand particles moving without the P–W process in the higher flow layer enhance the scales of the VLSM. With the decrease in
 $z_{ref}^{+}$, the streamwise scales of the turbulent structures in case 2 gradually decrease after reaching a maximum value and are smaller than those of case 0 below a certain height, which happens to be the determined critical height
 $z_{0}^{+}$ of the P–W process in figure 8(a). To avoid luck, the variation in the scales of the turbulent structures with height in case
 $2'$ is also shown in figure 16, which demonstrates the same trend as that of case 2, that is, the height below which the scales of the turbulent structures are lower than that of case 0 also corresponds to the critical height
 $z_{0}'^{+}$ of the P–W process. The fact that the intersection heights of case 2 and case
 $2'$ below which the scales of the turbulent structures are smaller than those in the single-phase case are basically consistent with the critical heights of the P–W process further reveals that a key factor affecting the turbulent structure scales in this experiment is the sand-particle movement near the wall, the essence of which is the P–W process of the wind-blown sand flows. Notably, as shown in figure 9, the particle volume fractions of case 1 and case 2 are also different, but this difference is not the reason for the quantitative difference in the scales of the turbulent structures between these cases. It should be noted that there is no clear relationship between the volume fraction and the variations of the size of VLSM. More specifically, the particle volume fraction in case 2 is higher than that in case 1 over the whole boundary layer, the size of the turbulent motions in case 2 should be smaller than those in case 1, as expected. However, figure 16 presents an opposite result that the scales of the turbulent motions in case 2 are apparently larger than those in case 1, even than those in case 0 in the wake region. From this perspective, it is reasonable to conclude that the difference of the volume fraction is not a key factor affecting the scales of LSM/VLSM in the turbulent particle-laden flow. This change is precisely because of the existence of the P–Wprocess, as the interaction between a particle and a wall may lead to momentum and energy losses of the particle and thus results in a decrease in the kinetic energy of the fluid, which makes the VLSM difficult to maintain, and their scales are reduced or even destroyed. In the region without the interaction between the particles and wall, i.e. the regions higher than
 $z_{0}^{+}$ and
 $z_{0}'^{+}$ in case 2 and case
 $2'$, respectively, the length scales of VLSM are increased. Through conditional average of the streamwise velocity fluctuations at
 $z = 0.6 \delta$ in case 0 and case 2, it is found that the magnitudes of both the low- and high-speed regions in case 2 are significantly decreased but the their spatial scales are increased due to the presence of particles. In addition, energy spectrum analysis on the streamwise velocity fluctuations also reveals the similar law, that is, the magnitude of turbulent kinetic energy corresponding to VLSM decreases, but its peak shifts to a larger wavelength which results in an increase in the statistical correlation scale of VLSM.
Variations of the scales of the VLSM in the single-phase flow and sand-laden flows.

It is noted that in case 2 and case  $2'$ (top-releasing cases) the bottom wall is kept as smooth as that in case 0 (the single-phase flow case) which means no apparent variations of surface roughness. Therefore, the variation of the surface roughness can be excluded from the reasons introducing the variations of the flow fields in case 2 and case
 $2'$. In case 1 (sand-bed-releasing case) the surface roughness over the sand bed was definitely changed, which was estimated as
 $k_s^+\sim 16$. Considering the distance between the sand-bed and the field of the measurement was larger than 5 m, it is reasonable to regard the bottom condition for the field of measurement was smooth wall during the experiments. On the other hand, Squire et al. (Reference Squire, Morrill-Winter, Hutchins, Schultz, Klewicki and Marusic2016) reported a good similarity between the coherent structures in the outer layer over a rough and a smooth wall. Furthermore, two-point correlations showed that the structures over a rough wall have slightly larger scales than those over a smooth wall, which indicates that even if the sand bed laid on the bottom wall increase the roughness of the boundary layer, the scales of the VLSM would be slightly increased due to the effect of wall roughness. However, the two-point correlation results of this paper show that the scales of the VLSM are obviously shortened at various heights in the sand-bed-releasing case, which is opposite to the influence of the rough-wall effect. Therefore, it is reasonable to regard the P–W process as a key factor affecting the variations of the turbulent structures in the outer layer.
5. Conclusions
To analyse the influence of the P–W process on the LSM/VLSM in gas–solid two-phase flows, two types of sand-laden flows with heavy and high  $St$ number particles were experimentally designed and measured in a wind tunnel. In the first type, sand particles are initiated and entrained from a sand bed located on the bottom wall by wind shear. In the second type, sand particles are released into the air flow field by a sand feeder at the top wall. In the former case, the sand particles sustain continuous saltation by colliding with the wall, and the effect of the P–W process is ubiquitous in the region with sand particles. In the latter case, the effect of the P–W process only works below a certain height because only part of the sand particles participates in the P–W interaction during their movements. The critical height of the P–W process in the latter case can be represented by the ratio of the ascending and total particle numbers
 $\gamma$, which is close to 0.5. Based on simultaneous two-phase PIV/PTV measurements and analysis of the wind and sand velocities in the two types of wind-blown sand-laden flows with the same free stream wind velocity, flow Reynolds number and particle
 $St$ number, the main conclusions can be obtained as follows. First, the distribution of the particle volume fraction of the sand-laden flow is significantly affected by the P–W process. In the region without the P–W effect, the particle volume fraction varies relatively slowly with height, while in the region with the P–W effect, the particle volume fraction increases rapidly because the rebound particles enhance the local particle number. Second, the effect of the P–W process can significantly reduce the sand and wind velocities. In the region without the P–W process, the sand particles continuously obtain energy from the fluid so that the velocities of sand particles are higher than the local fluid velocity at the same height, while in the region with the P–W process, the sand particles collide with the wall along with the loss of kinetic energy, which reduces the velocity of the sand particles. For the flow velocity, in the region without the P–W process, the high-velocity sand particles falling from the outer layer accelerate the local fluid, which makes the flow velocity of the sand-laden flow higher than that of the single-phase flow at the same height. With the decrease in height, the P–W process gradually plays an increasing role that results in a rapid decrease in sand velocities and an increase in particle volume fraction, which in turn lowers the velocity of the local fluid. Finally, the scales of the LSM/VLSM in both types of wind-blown sand-laden flows are significantly affected by the P–W process. The presence of particles increases or reduces the scales of the LSM/VLSM, which are primarily dominated by the presence or absence of the P–W process. In the region without the P–W process, the scales of the VLSM are increased. While in the region with the P–W process, the scales of the VLSM are reduced to a large extent. However, there is no clear relationship between the volume fraction and the scales of VLSM, which requires further investigations. In the region with the P–W process, the scales of the VLSM are smaller than those in the single-phase flow, which is due to the continuous loss of kinetic energy through the collisions between sand particles and the wall. The decreases in the scales of the VLSM in the wind-blown sand-laden flows are related to the strength of the P–W process. In the higher boundary layer, the effect of the P–W process is weaker and the scale reductions in the VLSM are relatively smaller. When approaching the bottom wall, the effect of the P–W process becomes stronger, and the scales of the VLSM scale obviously decrease. These scales are difficult to maintain and are destroyed below a certain height. The analysis of the effect of the P–W process on the turbulent motions in sand-laden flows provides a new perspective for the study of particle–turbulence interaction, which is helpful for deepening the understanding of the interphasial interaction mechanism.
Acknowledgements
We are also thankful to Dr R. Hu for his careful proofreading of the manuscript and to the anonymous reviewers for their helpful comments.
Funding
The authors acknowledge funding support from National Natural Science Foundation of China (nos 92052202, 11702122).
Declaration of interests
The authors report no conflict of interest.



