


Introduction
To the casual observer, all glaciers should be ‘arctic’ as they all consist of snow and ice and only survive in relatively low temperatures. However, I will demonstrate that some glaciers are more arctic than others are and that glaciers on the arctic islands of North America and Eurasia have distinct mass-balance characteristics compared with glaciers around the Arctic. This is not just a question of taxonomy, as the arctic islands carry such large glacier areas that they could dominate the response of the global cryosphere to climate change. Furthermore, if we want to develop new ways of monitoring arctic glaciers we must understand their behaviour better. For example, the mass-balance forcing of surface-elevation changes depends upon the standard deviation of the mass balance (Reference BraithwaiteBraithwaite, 1994), which is itself a climatological characteristic (Reference Braithwaite and ZhangBraithwaite and Zhang, 1999).
There is no clear definition of an ‘arctic glacier’, although the term implies location in the arctic geographical region. The concept has a recent social construction. The International Arctic Science Committee set up a Working Group on Arctic Glaciology in 1992, and the activities of this group included analysis of observation from glaciers in Alaska, Iceland, Scandinavia and mainland Russia, as well as glaciers on the arctic islands (see map in fig. 1.1 in Reference Jania and HagenJania and Hagen, 1996). This implies a broad understanding of ‘arctic glacier’, but most glaciers in Alaska and Scandinavia, and all Icelandic glaciers, actually lie south of the Arctic Circle. In the 1930s and 1940s, H.W. Ahlmann and P.A. Shumskii developed glacier classifications that show how glaciers exist over a wide range of climatic conditions. Reference AhlmannAhlmann (1948) classed glaciers as polar, subpolar and temperate. His concepts of polar and subpolar glaciers were informed by Koch and Wegener’s work in Greenland (1912–13) and his own work in Nordaustlandet, Svalbard, in 1931 (Reference AhlmannAhlmann, 1948) and we may suppose that subpolar glaciers in Ahlmann’s classification do occur on arctic islands, especially as an earlier version of Ahlmann’s classification refers to ‘sub-arctic’. A subpolar glacier is one where summer melting occurs at the surface but the interior of the glacier is below the freezing temperature (Reference AhlmannAhlmann, 1948), which is a sure recipe for refreezing of meltwater as it percolates into the cold underlying strata to form superimposed ice (Reference KoernerKoerner, 1970) or ice layers (Reference Braithwaite, Laternser and PfefferBraithwaite and others, 1994). However, some refreezing and internal accumulation occurs on most glaciers (Reference Hughes and SeligmanHughes and Seligman, 1939; Reference Markl and WagnerMarkl and Wagner, 1978; Reference Trabant and MayoTrabant and Mayo, 1985), so there is no direct link between meltwater refreezing and ‘arctic’ in a geographical sense, and Ahlmann’s ‘subpolar’ class does not necessarily refer to the Polar Regions either. Significant refreezing of meltwater can occur on any glacier with annual air temperature below –6 to –8˚C (Reference HuangHuang, 1990; Reference Braithwaite, Zhang and RaperBraithwaite and others, 2002).
‘The zones of ice formation’ concept, developed by Shumskii in the 1940s but published later (Reference ShumskiiShumskii, 1964), avoids any association between classification and geography. Shumskii’s ‘infiltration zones’ can occur both on arctic islands and in very high mountain ranges (see Reference ShumskiiShumskii, 1964, ch. 20). Our modern concept of glacier zones (Reference PatersonPaterson, 1994, fig. 3.1) rests mainly on work in Greenland (Reference BensonBenson, 1961) and on arctic islands (Reference BairdBaird, 1952; Reference MüllerMüller, 1962) but, again, avoids any geographical association, as does our modern temperature classification of glaciers (Reference PatersonPaterson, 1994, p.205).
Approach
My approach to the mass balance of arctic glaciers is an empirical one: I look at all available mass-balance data up to 1999 to see if there is any association between geographical location (e.g. glaciers lying in the Arctic) and mass-balance behaviour. I use the dataset of Reference BraithwaiteBraithwaite (2002) with many updates and corrections from Reference DyurgerovDyurgerov (2002) to give 302 glaciers for 1922–99, from all over the world, with measured mass balance for at least 1 year.
I set the scene by plotting mass-balance data (Fig. 1) for two greatly contrasting glaciers: the northwest sector of Devon Ice Cap, Arctic Canada, and A Ålfotbreen, west Norway. There is almost an order-of-magnitude difference in standard deviation for the mass balances of the two glaciers, although they are both ‘arctic glaciers’ according to Reference Jania and HagenJania and Hagen (1996) or ‘circum-arctic glaciers’ according to Reference DowdeswellDowdeswell and others (1997). These large differences in interannual variability of glacier mass-balance series (Reference Braithwaite and ZhangBraithwaite and Zhang, 1999) are concealed when mass-balance time series for different glaciers are published in uniform size, as in Reference DowdeswellDowdeswell and others (1997) and Reference Nesje and DahlNesje and Dahl (2000), rather than in uniform scale.
The contrast in mass-balance variability between the northwest sector of Devon Ice Cap, Arctic Canada, and Ålfotbreen, west Norway.
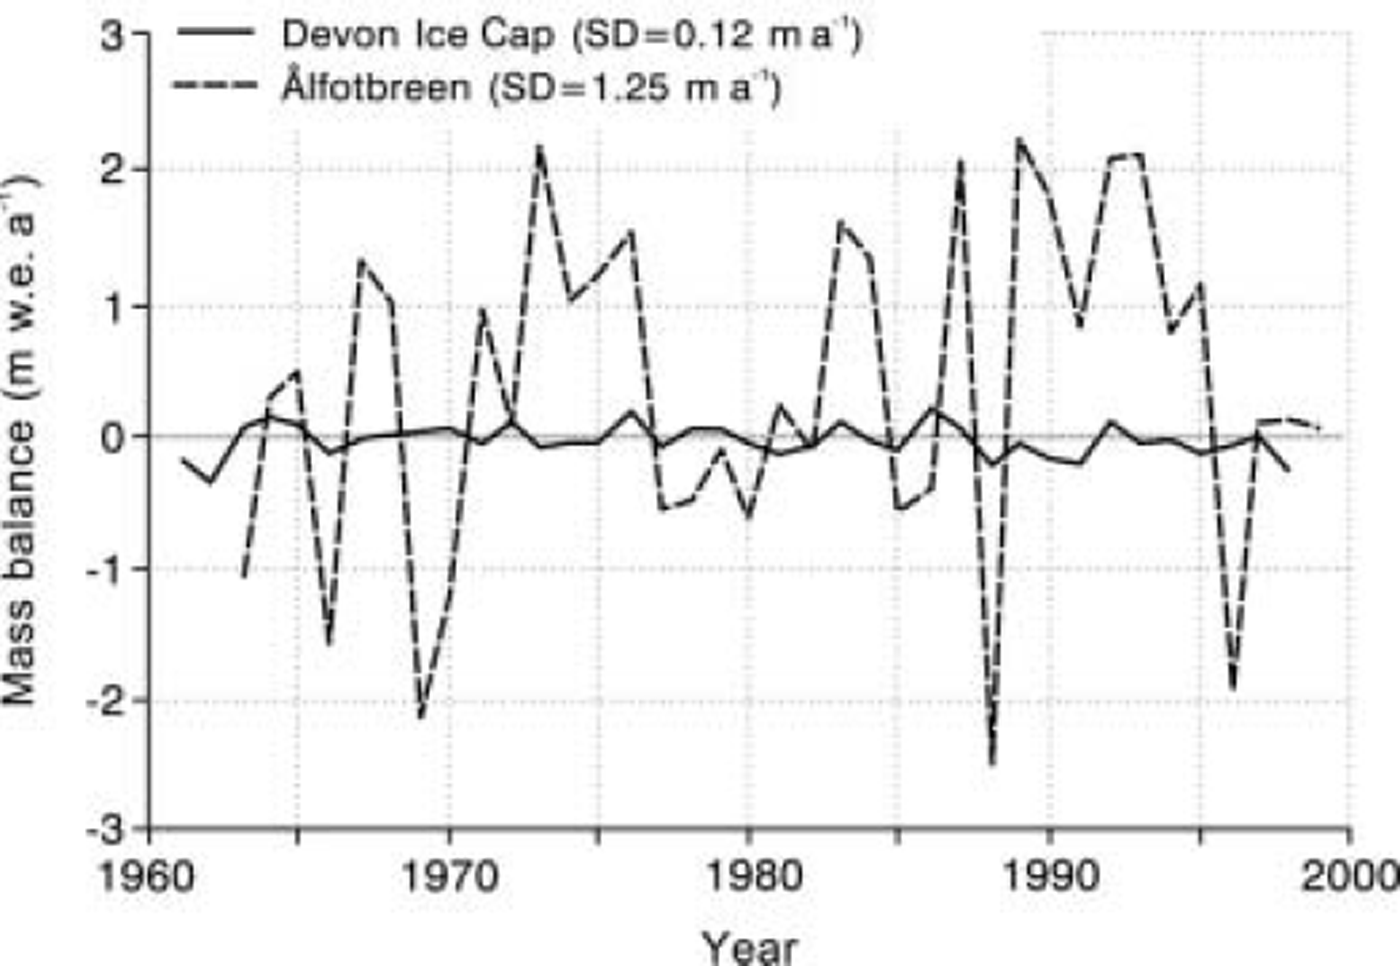
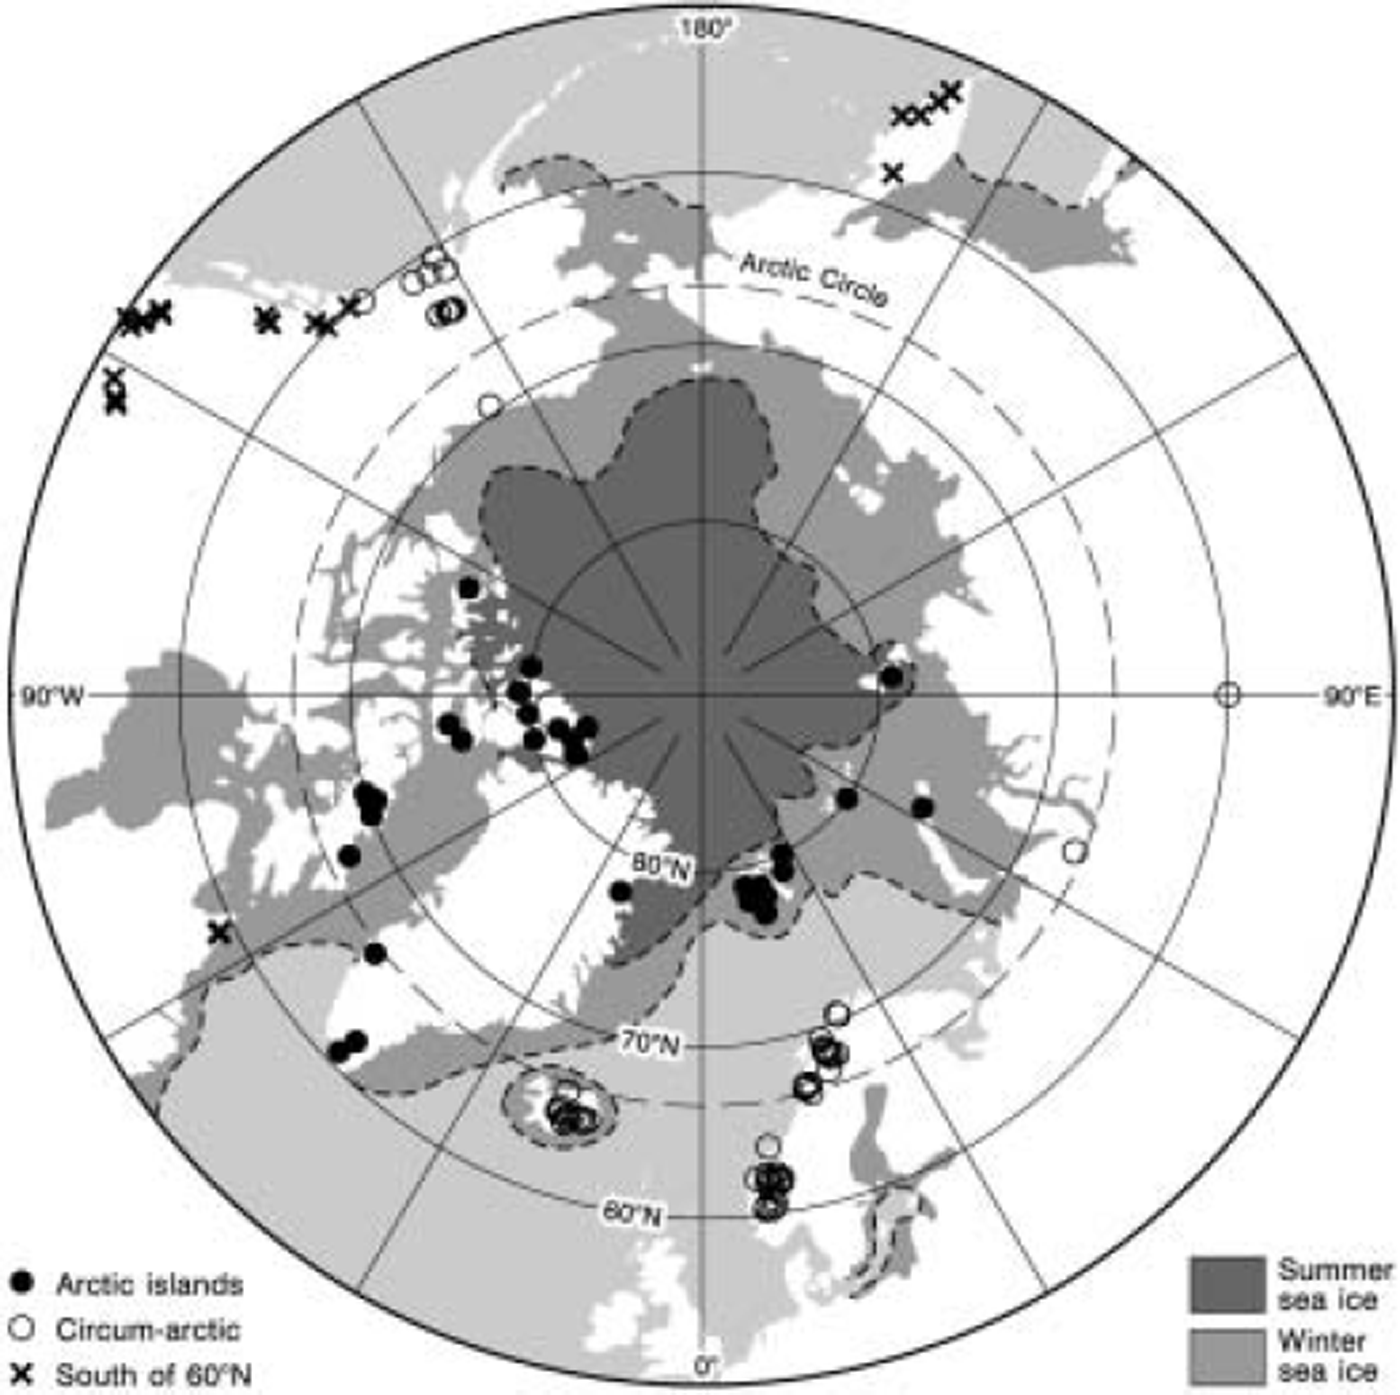
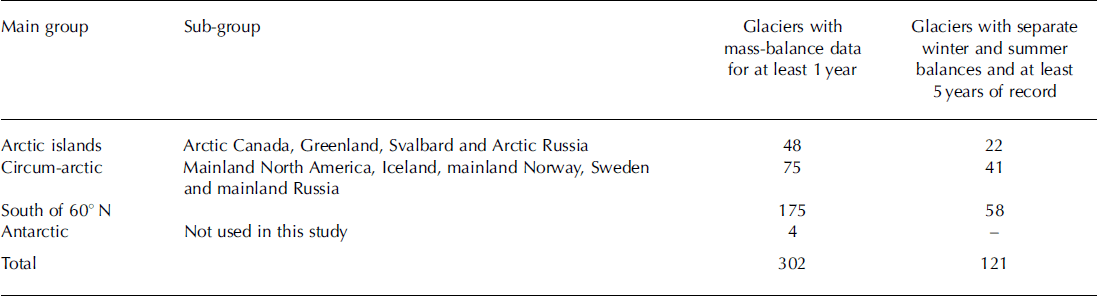
It is important to know the mass balances of individual glaciers, and regional (Reference DowdeswellDowdeswell and others, 1997) and global averages of mass balance (Reference Dyurgerov and MeierDyurgerov and Meier, 1997; Reference Cogley and AdamsCogley and Adams, 1998), but we must be careful about simple averages of data that are known to have ‘complex spatial and temporal patterns’ (Reference Chappell and AgnewChappell and Agnew, 2004). Figure 1 demonstrates that mass balances for individual glaciers can vary from year to year in very different ways. The contrast in Figure 1 suggests the hypothesis that glaciers on arctic islands have different mass-balance characteristics to more southerly glaciers. (Note that the two glaciers in Figure 1 have very similar mean equilibrium-line altitudes.) Although rather arbitrary, to test the hypothesis it is convenient to split the southerly glaciers into two groups: glaciers immediately surrounding the Arctic (circum-arctic glaciers) and glaciers south of 60˚N. For the present study, the circum-arctic glaciers are those found in mainland North America north of 60˚ N, in Iceland, Scandinavia and in northern Russia (Fig. 2; Table 1). The group of glaciers south of 60˚ N includes several tropical glaciers, but I exclude four glaciers in the Antarctic from the present study. The four data points in Figure 2 for Greenland refer to three local glaciers and one sector of the Greenland ice whose mass balance is determined from top to toe. We do not yet have a series of mass-balance measurements for the whole Greenland ice sheet considered as one large glacier.
Location of glaciers in and around the Arctic with measured mass balance according to Reference BraithwaiteBraithwaite (2002) and Reference DyurgerovDyurgerov (2002).
Glaciers with mass-balance data used in the present study, based on Reference BraithwaiteBraithwaite (2002) updated and corrected with data from Reference DyurgerovDyurgerov (2002)
Climatic Setting
Annual precipitation and annual temperature range are important climatological characteristics for glaciers. In classical climatology, high temperature range and low precipitation characterize continental climate, and low temperature range and high precipitation generally characterize maritime climate, although low temperature ranges occur in the tropics irrespective of precipitation (Reference VisherVisher, 1923a, b). Each point in Figure 3 represents a 0.5˚ latitude/ longitude grid square that contains a glacier with measured mass balance. The annual precipitation and annual temperature range are from the gridded climatology of Reference New, Hulme and JonesNew and others (1999) and refer to the mean altitude of topography within each grid square. The mean altitude of topography in the arctic islands is generally close to the mean glacier altitude, while the altitude difference can be up to several thousand metres for more southerly glaciers.
Annual precipitation vs annual temperature range for 0.5˚ latitude/longitude grid squares containing glaciers whose mass balance has been measured for at least 1 year. Climatological data taken from the gridded climatology of Reference New, Hulme and JonesNew and others (1999).
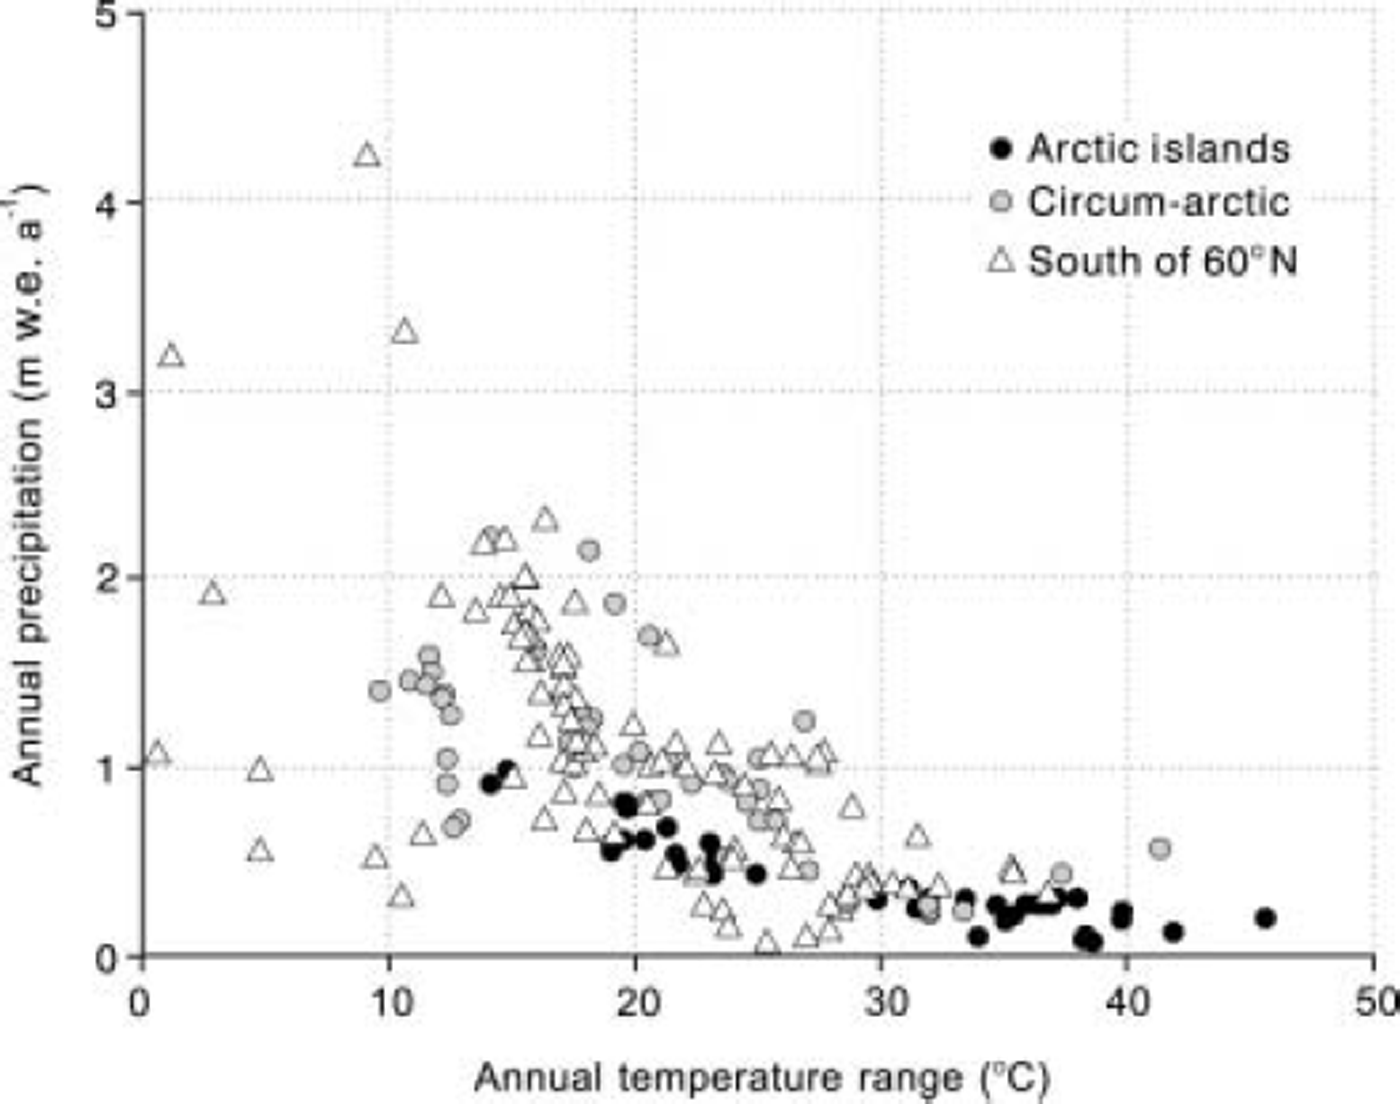
Annual temperature range is high and annual precipitation is low for grid squares with arctic island glaciers, which appear in two groups in Figure 3. The highest ranges (30–45˚C) and lowest precipitation (<0.5m w.e. a–1) occur in the Canadian and Russian arctic islands, while Svalbard has a more moderate temperature range (around 15–25˚C) and annual precipitation up to 1 mw.e. a–1. The arctic islands obviously have extremely continental climate, but parts of Svalbard are less continental. Some glaciers south of 60˚ N, in the high mountains of Asia, are also continental in climatic terms. Many circum-arctic glaciers are quite maritime, with low annual temperature range and high annual precipitation, but we must remember that there are also strong maritime/continental contrasts within this group of glaciers (e.g. between the coast and interior of Alaska (Reference Østrem, Haakensen and ErikssonØstrem and others, 1981)).
Mass-Balance Variability
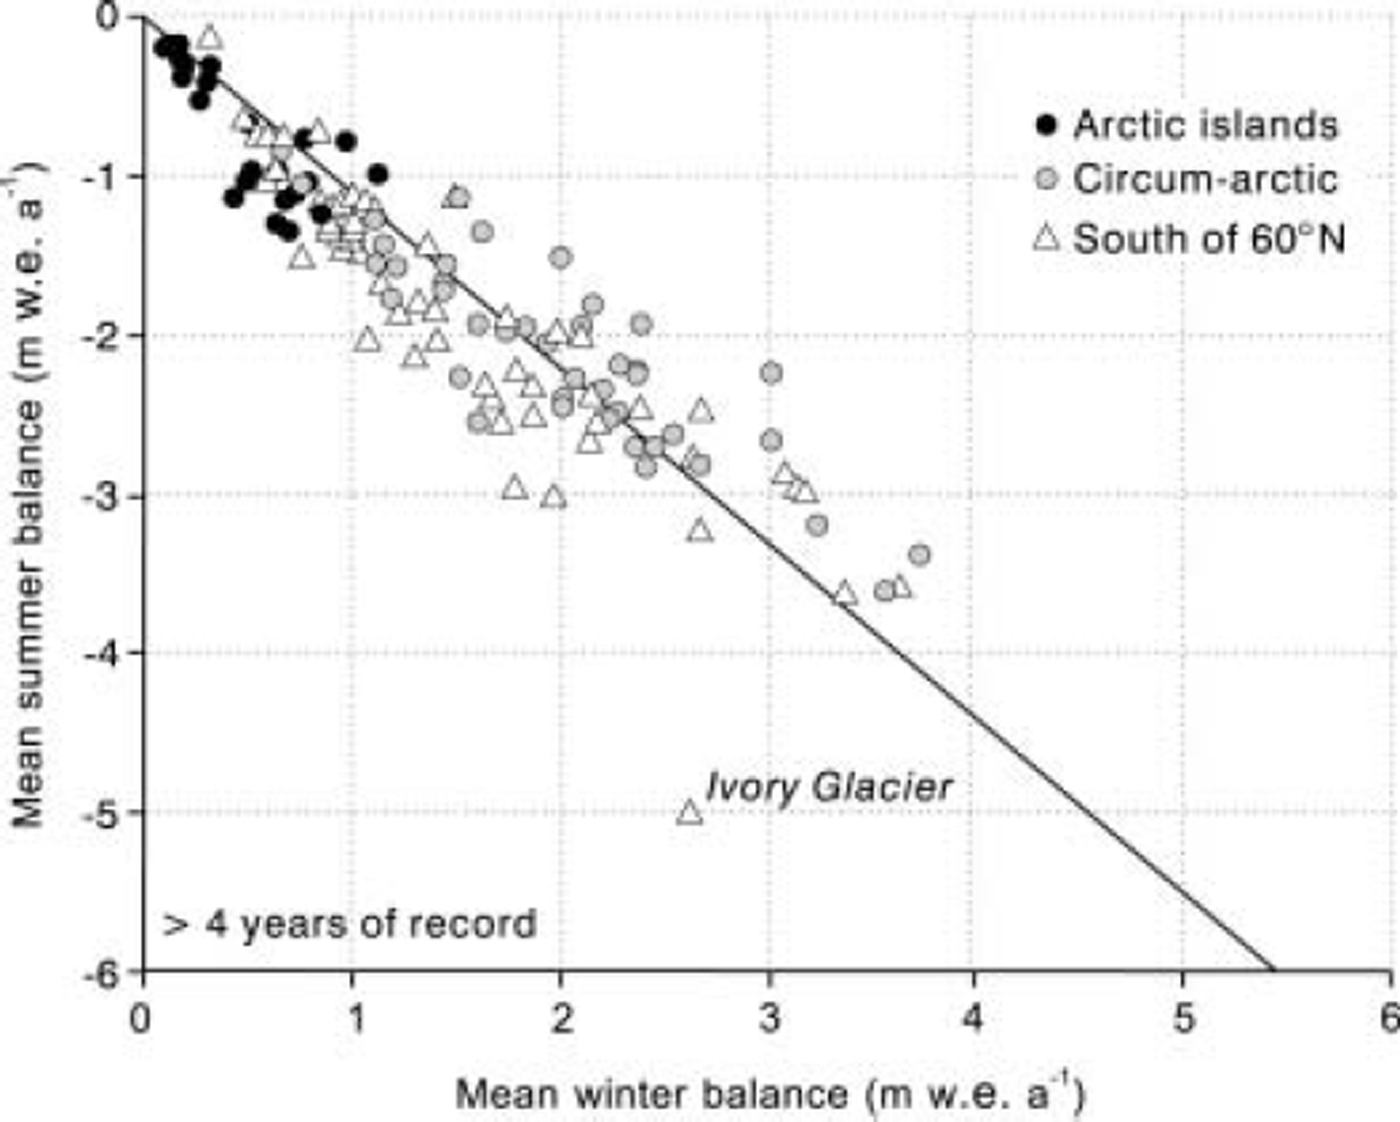
Figure 4 shows available data for winter and summer balances. The data points refer to mean values of mass-balance series that are at least 5years old, in the hope of avoiding artefacts due to short series measured around ‘exceptional years’. The number of glaciers is therefore greatly reduced (Table 1) because winter and summer balances are not measured on all glaciers and because short mass-balance series predominate (Reference BraithwaiteBraithwaite, 2002; Reference DyurgerovDyurgerov, 2002). In particular, McCall Glacier in northern Alaska, which probably qualifies as a truly arctic glacier, falls out of further analysis because we do not have separate winter and summer balances. I will not discuss the one clear anomaly in Figure 4 (Ivory Glacier, New Zealand) but suspect that it may be an error. Aside from this anomaly, there is a strong correlation between mean summer and mean winter balances. The difference between these quantities is the mean mass balance, and the deviation from a straight line reflects the effects of non-zero mass balance. Clearly, most of the glaciers have negative mass balance, but mass balance is generally the small difference between the two larger quantities. Arctic island glaciers have low values of winter and summer balance compared with some much larger values for circum-arctic glaciers. Some glaciers south of 60˚ N (e.g. in central Asia) also have low summer and winter balances due to their extreme continental climate. The low winter balances for arctic island glaciers partly reflect the low annual precipitation for these glaciers (Fig. 3) but also reflect the effects of meltwater refreezing whereby a glacier can exist with lower snow accumulation than it would need under the same temperature conditions without refreezing (Reference Braithwaite, Zhang and RaperBraithwaite and others, 2002).
Mean summer balance vs mean winter balance for glaciers with at least 5 years of record for both variables.
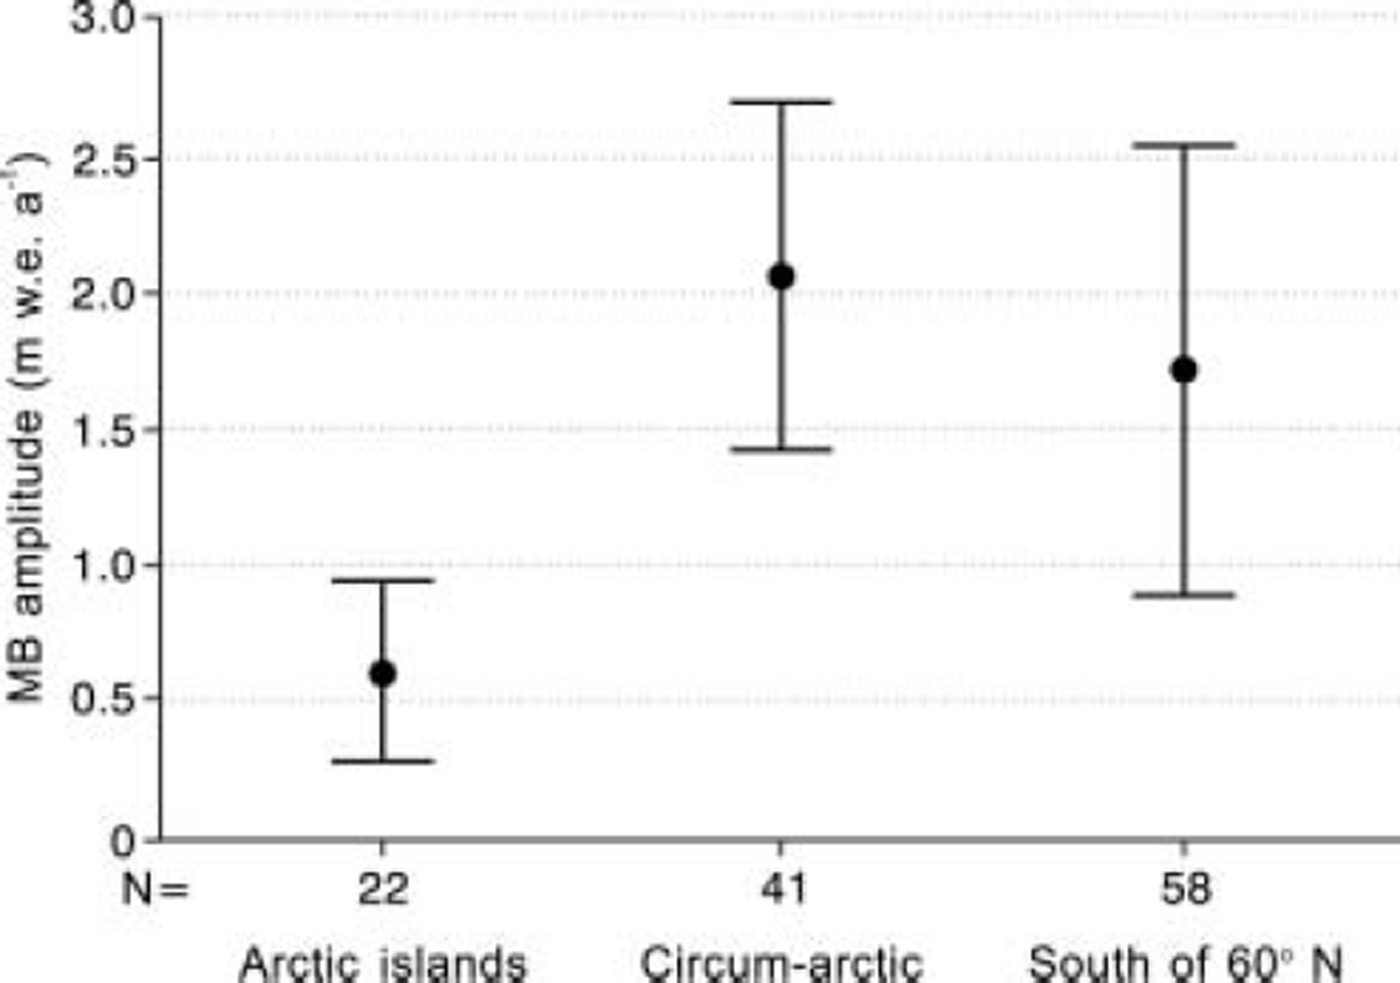
Because of the strong correlation between winter and summer balance, several authors (Reference MeierMeier, 1984; Reference Braithwaite and ZhangBraithwaite and Zhang, 1999) choose to use the average of their magnitudes as a mass-balance characteristic. This is the mass-balance amplitude, which is close to the average winter balance and generally somewhat less than the annual accumulation. There are signs of secular variation in mass-balance amplitude (Reference Dyurgerov and MeierDyurgerov and Meier, 1999) but it is much less variable than annual or net balance and can be regarded as a quasi-constant characteristic, or parameter, of mass balance. The mean mass-balance amplitude in the arctic islands is much less than in the circum-arctic (Fig. 5), once again expressing the continental climate of the arctic island glaciers. However, within the arctic islands group, Svalbard glaciers have higher mass-balance amplitude than glaciers in the Canadian and Russian arctic islands.
Mean and standard deviation of mass-balance amplitude for 121 glaciers divided into three classes: Arctic islands, circum-arctic and south of 60˚ N.
The interannual variability of mass-balance series (e.g. as expressed by the standard deviation) is strongly controlled by the mass-balance amplitude according to Reference Braithwaite and ZhangBraithwaite and Zhang (1999). I update these earlier results in Figure 6 using glaciers with at least 5 years of record. The length of record to use for such graphs is a judgement call: choice of a longer record reduces the number of points but improves the correlation. I have also chosen to ‘force’ the regression line through the origin because this makes more sense physically than the simple regression of Reference Braithwaite and ZhangBraithwaite and Zhang (1999). Arctic island glaciers have low interannual variability and low mass-balance amplitude, while circum-arctic glaciers generally have high variability and high amplitude. Once again, high mountain glaciers south of 60˚ N can have similar characteristics to glaciers on arctic islands. Aside from the climatic setting, the standard deviation of mass balance may also depend upon glacier size by analogy with meteorological variables whose anomalies become smaller when the average is taken over a larger area (personal communication from J. Oerlemans, 2004).
Standard deviation (S.D.) of mass-balance time series vs the mean mass-balance amplitude for glaciers with at least 5 years of mass-balance record. The straight line is a regression line forced through the origin.
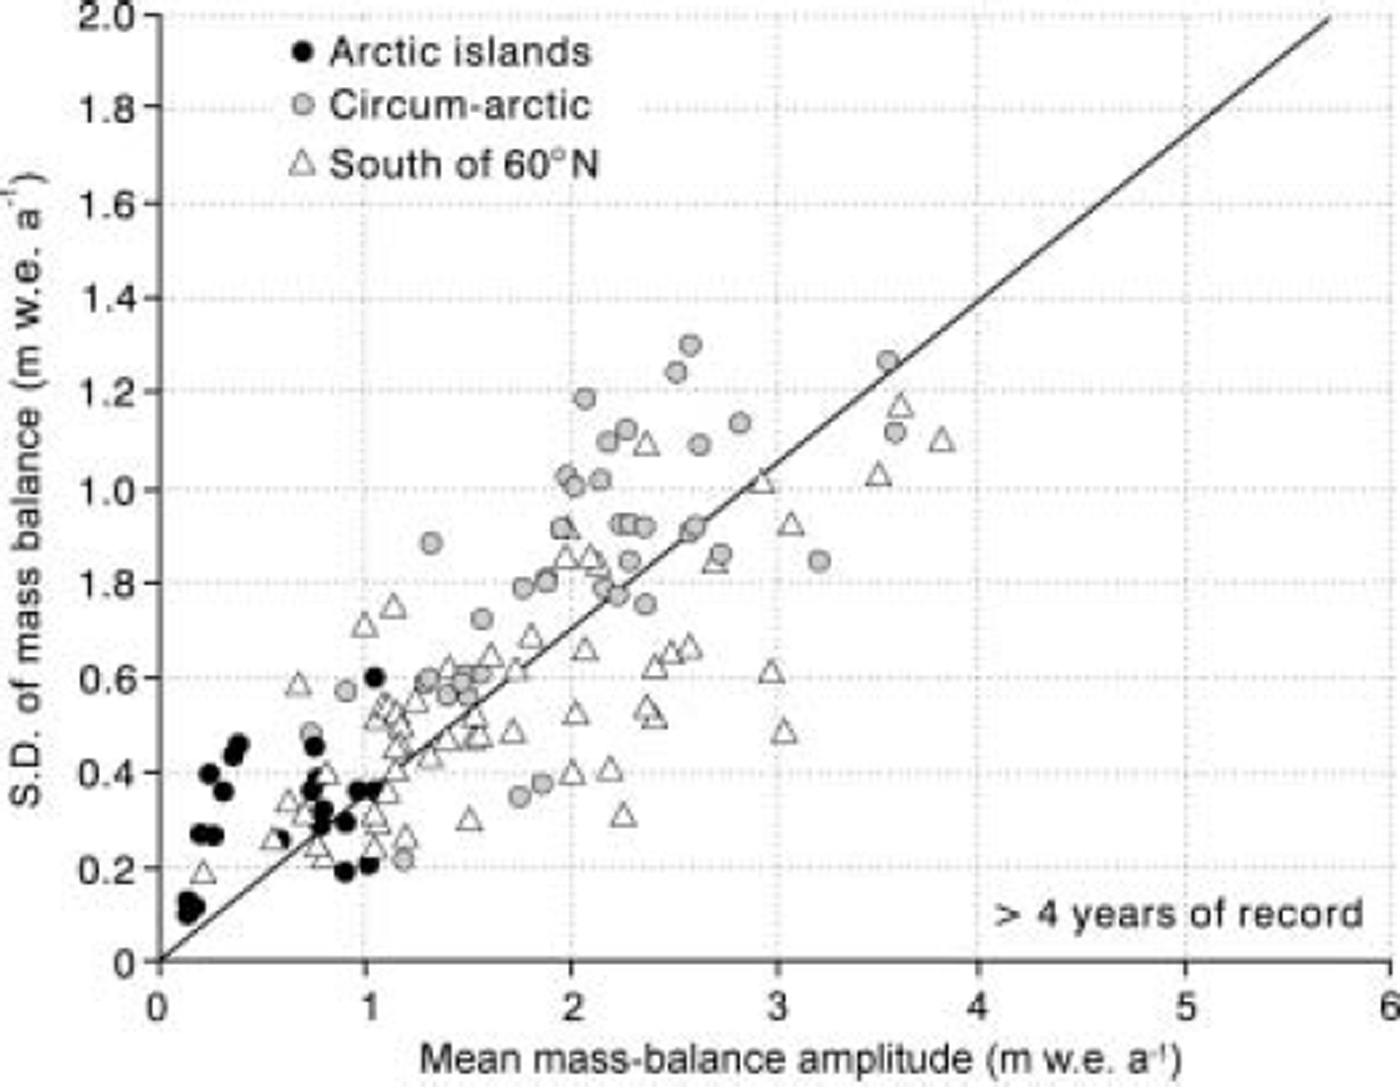
The average annual accumulation over the Greenland ice sheet is about 0.3 mw.e. a–1 (Reference Ohmura and ReehOhmura and Reeh, 1991). For this value of mass-balance amplitude, the regression line in Figure 6 gives an estimated standard deviation of about 0.1 m w.e. a–1 for the average mass balance of the Greenland ice sheet. Although this indicates a relatively low inter-annual variability for mass balance compared with other glaciers, it may explain apparent contradictions in short-term measurements of thickness change (Reference Zwally, Brenner, Major, Bindschadler and MarshZwally and others, 1989; Reference BraithwaiteBraithwaite, 1994; Reference Van der VeenVan der Veen, 2001).
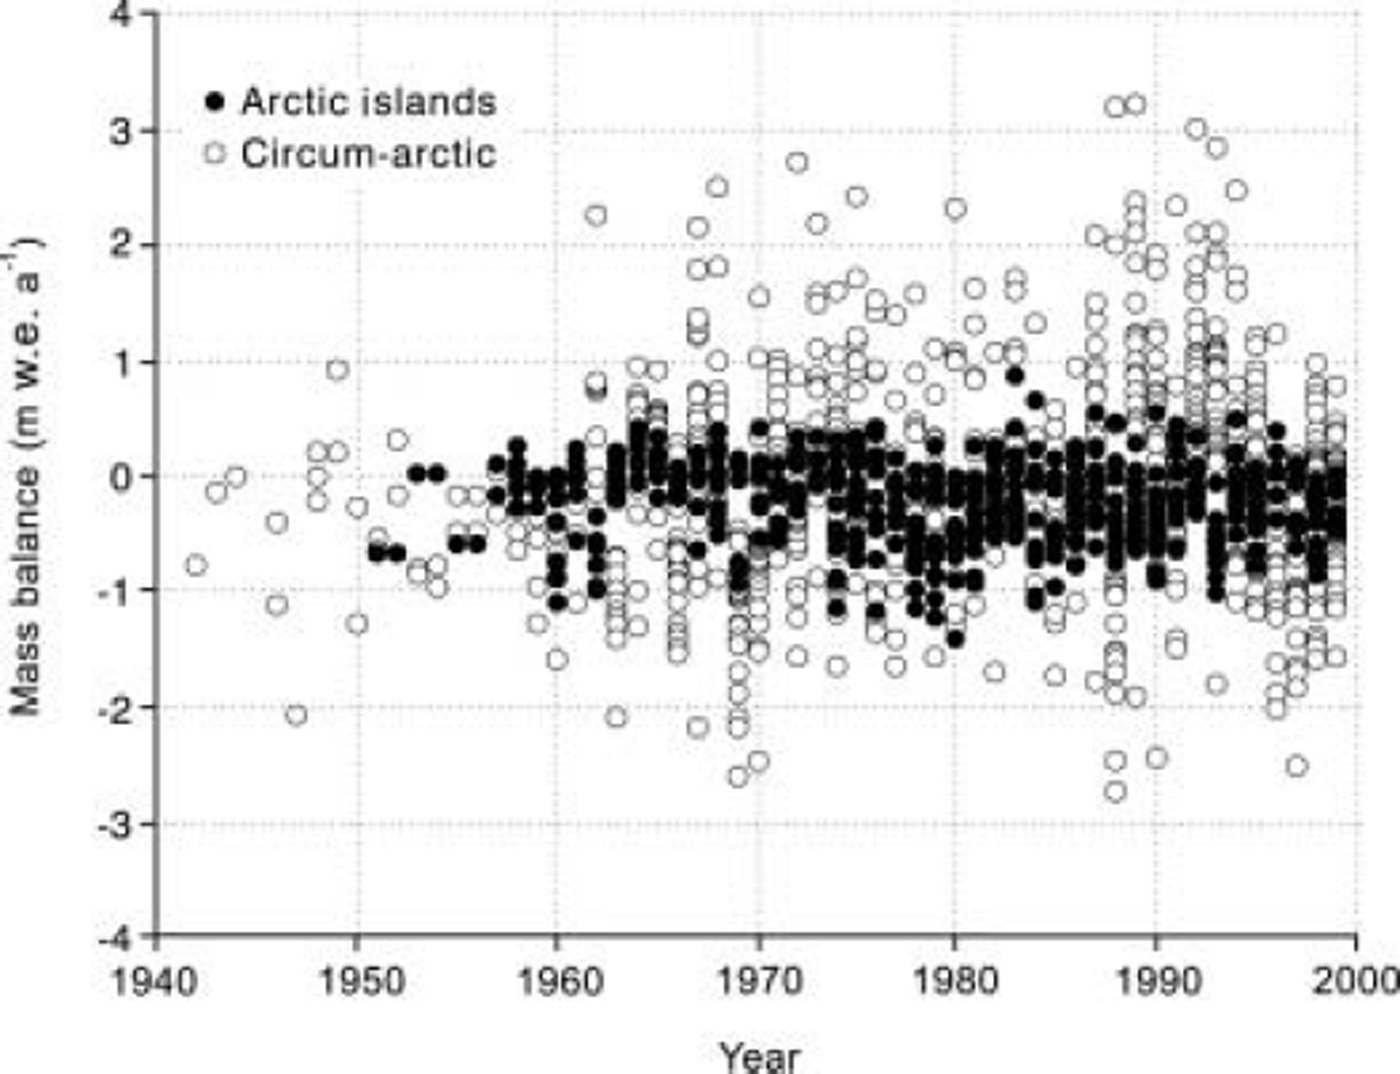
Figure 7 is an update of figure 4.1 in Reference Jania and HagenJania and Hagen (1996) that graphed all available data from what those authors termed ‘arctic glaciers’. In this graph, I distinguish between glaciers on arctic islands and glaciers in the circum-arctic. There is obviously a large amount of scatter, reflecting the importance of year-to-year fluctuations in mass balance. Leaving aside the criticism that such graphs are based on a fluctuating number of measurements in each year, it is clear that the mass balance of arctic island glaciers is much less variable than that of the circum-arctic glaciers. There is no sign of any trend of increasing or decreasing mass balance up to 1999, which we would have to detect against the background of year-to-year fluctuations. The impression of a greater range of variation at the end of series is due to the start of new measurements in the 1990s on Icelandic glaciers with large accumulation and mass-balance amplitude.
Mass balance vs year for all available mass-balance data from arctic island and circum-arctic glaciers.
Effects of Climate Change
Reference Oerlemans and FortuinOerlemans and Fortuin (1992), Reference Braithwaite, Zhang and RaperBraithwaite and others (2002) and Reference De Woul and Hockde Woul and Hock (2005) use glacier–climate models to calculate the hypothetical change in mass balance due to a 1˚C temperature increase. The resulting temperature sensitivity for mass balance depends on precipitation regime (Reference Oerlemans and FortuinOerlemans and Fortuin, 1992; Reference De Woul and Hockde Woul and Hock, 2005) or mass-balance amplitude (Reference Braithwaite, Zhang and RaperBraithwaite and others, 2002). The glaciers of the arctic islands have low precipitation, low mass-balance amplitude and thereby low temperature sensitivity. The latter fits well with the low variability (standard deviation) of mass balance as the glaciers are making their own temperature sensitivity experiment every year. Even with increased temperature (e.g. due to global warming) in the immediate neighbourhood of the glacier, the negative mass balance of an arctic island glacier cannot be very high and cannot increase by much. Arctic island glaciers cover a vast area (Reference Dowdeswell, Hagen, Bamber and PayneDowdeswell and Hagen, 2004), but a relatively small negative mass balance over a large area will only cause moderate sea-level rise. The small variations in mass balance of arctic island glaciers are due to low annual precipitation and high annual temperature range, but we should re-examine Figure 3 and ask ourselves why the arctic islands have such a climate.
The climate of the arctic islands, as represented by annual precipitation and temperature range in Figure 3, is dominated by the effects of sea ice that ensure low temperature in winter and reduced summer temperatures compared with Alaska, Iceland and mainland Scandinavia which are readily accessible to extratropical cyclones and warm sea surface temperatures. The low precipitation in the arctic islands reflects the generally low temperatures and the distance from moisture sources. The strong gradient in accumulation across Devon Ice Cap (Reference KoernerKoerner, 1966) is a good example of how a local moisture source (the ‘North Water’ polynya in northern Baffin Bay) might enhance the accumulation. However, a bigger change of climate in the Arctic could occur if slightly higher summer temperatures melted the sea ice, thereby increasing winter temperatures and reducing the annual temperature range in Figure 3, to allow greater access of extratropical cyclones and an increase in precipitation. The glaciers of the arctic islands might then show greater mass-balance variability and sensitivity to climate change like glaciers around the Arctic. We need more work on arctic glaciers to assess the likelihood of this scenario.
Acknowledgements
The ARCICE programme of the UK Natural Environment Research Council did not support this work. This study uses mass-balance data that many individual scientists and organizations collected and made freely available for further study and analysis. The International Arctic Science Committee has done an especially good job in encouraging workers to publish previously unavailable data from glaciers in and around the Arctic. J. Oerlemans was the Scientific Editor for this paper.



