Introduction
Nepheline is a framework silicate with the ideal formula K2Na6Al8Si8O32 (Z = 1), which occurs characteristically in silica-undersaturated alkaline rocks. Buerger et al. (Reference Buerger, Klein and Donnay1954) first solved the crystal structure of nepheline of volcanic origin from Monte Somma, Italy, in the hexagonal system with space group P63. Later refinements were made by Hahn and Buerger (Reference Hahn and Buerger1955). As reviewed by Palmer (Reference Palmer, Heaney, Prewitt and Gibbs1994), the general features of nepheline are: (1) the structure of nepheline consists of two sets of tetrahedral sites. One set of tetrahedral sites (T1 and T2 sites) resides on special equivalent positions, along the [001] triads (forming distorted oval rings), whereas the second set (T3 and T4 sites) lies on general equivalent positions (forming hexagonal rings). (2) Approximately equivalent amounts of Si and Al occupy each set of tetrahedral sites. For each set of tetrahedral sites, two kinds of tetrahedra arise by ordering of Al and Si atoms. This reduces topological symmetry and results in the space group P63. (3) K and Na are distributed in open hexagonal rings and distorted oval rings, respectively, as interstitial charge-balancing cations. (4) The apical oxygen atom in special positions connecting adjacent layers of AlO4 and SiO4 tetrahedra at the T1 and T2 sites, respectively, is deviated ~0.3 Å from the triad axis.
The structural formula of nepheline is represented as A 2B 6T14T24T34T44O32, where A implies the general equivalent positions of open hexagonal rings, hereafter referred to as the A position; and B signifies the special equivalent positions of distorted oval rings, hereafter referred as the B position.
The relationship between the occurrence of nepheline and its structural properties has long been an interesting research subject. According to Hahn and Buerger (Reference Hahn and Buerger1955), the Al and Si atoms distributed in one set of T1 and T2 sites are in the ordered state, whereas those in the second set of the T3 and T4 sites are in the disordered state. Conversely, Simmons and Peacor (Reference Simmons and Peacor1972) obtained the opposite result by structural refinement of Hahn and Buerger's sample, i.e. with fully ordered Al and Si distributions in the T3 and T4 sites, and the highly disordered Si–Al distributions in the T1 and T2 sites. Alternatively, Dollase (Reference Dollase1970) suggested an intermediate degree of ordering of the Si and Al atoms in all tetrahedral sites of a plutonic nepheline. In contrast, Foreman and Peacor (Reference Foreman and Peacor1970) indicated full ordering of the Al and Si atoms over all tetrahedral sites in both volcanic and plutonic nephelines with the space group P63. New data on nephelines from metamorphic or magmatic ejecta and on pumice deposits from the Somma–Vesuvius volcanic complex by Balassone et al. (Reference Balassone, Kahlenberg, Altomare, Mormone, Rizzi, Saviano and Mondillo2014) also indicated a distinct ordering of Al and Si atoms in the tetrahedral sites. Although Vulić et al. (Reference Vulić, Balić-Žunić, Belmonte and Kahlenberg2011) recognised some disordering of Al and Si atoms in parts of nepheline specimens from ijolites and pegmatites from various localities, the degree of disorder (as evaluated from T–O distances) was only 10–20%.
In addition to the question of the Al and Si distributions in the tetrahedral sites, some differences between high-temperature volcanic nepheline and low-temperature plutonic nepheline have also been observed. Such differences include variations in optical properties (Sahama, Reference Sahama1962); twinning (Sahama, Reference Sahama1962; Foreman and Peacor, Reference Foreman and Peacor1970); and atomic positions (Dollase, Reference Dollase1970). Balassone et al. (Reference Balassone, Kahlenberg, Altomare, Mormone, Rizzi, Saviano and Mondillo2014) reported some variations in the chemical composition of nephelines, due to differences in the mineralisation process. They found that the nephelines in pumice and metamorphic ejecta from the Somma–Vesuvius volcanic complex were poorer in K than those in some samples from magmatic nodules.
As the K and Na atoms in nepheline occupy the A and B positions, respectively, the Na:K ratio is ideally 3:1, corresponding to [NaAlSiO4 (Nph)]75[KAlSiO4 (Kls)]25 in end-member mol.%. Although Sahama (Reference Sahama1958) and Hovis et al. (Reference Hovis, Spearing, Stebbins, Roux and Clare1992) synthesised highly potassian nephelines (72 mol.% and 63 mol.% Kls components, respectively) by annealing of nepheline–kalsilite exolution lamellae and ion-exchange experiments, respectively, most natural nephelines have chemical compositions within the Morozewicz–Burger convergence field (Tilley, Reference Tilley1954), which lies close to the ideal Nph75Kls25 composition or has a Kls component of <25 mol.%. However, nepheline containing >25 mol.% Kls component (hereafter, abbreviated as K-rich nepheline) has been reported from at least two localities. Nepheline with a Kls component of 25–27 mol.% was noted from peralkaline nephelinite from Oldoinyo Lengai in Tanzania (Dawson, Reference Dawson1998), and nepheline with a 27.1–31.8 mol.% Kls component was described from volcanic melilite–olivine nephelinite lava from Hamada, Shimane Prefecture, Southwest Japan (Hamada, Reference Hamada2011). The presence of K-rich nepheline suggests that K+ ions are not only distributed in the A position, but also distributed in the B position by replacing Na+ ions. However, the distribution of K+ and Na+ ions in K-rich nepheline has not yet been reported, and thus the effect on the crystal structure of substitution of Na+ by K+ in the B position is unknown.
In the present study, we investigated the crystal structure and crystal chemistry of K-rich nepheline in the Hamada melilite–olivine nephelinite using electron probe microanalysis and single-crystal X-ray structure analysis, with the aim of determining the crystal structure and cation distributions in the A and B positions and structurally independent T1–T4 tetrahedral sites, and to clarify the effect on the crystal structure of the cation distributions in the structural channels and tetrahedral sites. An electron diffraction method was also employed to examine incommensurate modulation in the Hamada K-rich nepheline.
Experimental methods
Specimen
The Hamada melilite–olivine nephelinite is the most silica-undersaturated lava in Japan, and the only known example of nephelinite in the country (Yoshizawa, Reference Yoshizawa1952; Fujii, Reference Fujii1974; Tatsumi et al., Reference Tatsumi, Arai and Ishizaka1999). Details of the occurrence and chemical compositions of nepheline in Hamada nephelinite have been reported by Matsubara et al. (Reference Matsubara, Miyawaki, Kato and Matsuyama1998) and Hamada (Reference Hamada2011).
Nepheline occurs commonly as an interstitial mineral between forsterite, åkermanite, augite, ulvöspinel and apatite microphenocrysts, and also as pale yellow euhedral crystals in druses, in association with zeolite, diopside and calcite (Hamada, Reference Hamada2011). One nepheline single crystal with dimensions of 0.45 mm × 0.35 mm × 0.26 mm picked from a druse of the melilite-olivine nephelinite was divided into several sub-samples. One sub-sample with dimensions of 0.28 mm × 0.15 mm × 0.05 mm was used for X-ray diffraction (XRD) analysis. A thin film prepared from the one nepheline sub-sample was employed for electron diffraction analysis.
Single-crystal XRD data collection, structure solution and refinement
Single-crystal XRD data for a sub-sample was collected using a Bruker SMART APEX II CCD diffractometer (Bruker AXS K.K.) at the Department of Geoscience of Shimane University. The nepheline crystal was mounted on a glass fibre, and intensity data were measured at 296 K using graphite-monochromatised MoKα radiation (λ = 0.71069 Å). Diffraction data were collected with ω scans at different φ settings (φ-ω scan) (Bruker, Reference Bruker1999). Data were processed using SAINT (Bruker, Reference Bruker1999), and an empirical absorption correction using SADABS (Sheldrick, Reference Sheldrick1996) was applied. The reflection statistics and systematic absences were consistent with space group P63. Preliminary lattice parameters and an orientation matrix were obtained from intensity data integrated from five sets of frames. Subsequent attempts to solve the structure indicated that the observed average structure is chiral, and for this reason P63 is the correct space group.
Structural refinements were performed using SHELXL-97 (Sheldrick, Reference Sheldrick2008). The B position, the T3 and T4 sites were assigned to the 6c general-equivalent-positions (x, y, z; –y, x–y, z; –x–y, –x, z), the T1 and T2 sites to the 2b special-equivalent-positions (⅓, ⅔, z; ⅔, ⅓, z+½), and the A position to the 2a special-equivalent-position (0, 0, z+½). The labels for oxygen positions are after Buerger et al. (Reference Buerger, Klein and Donnay1954): the O1 position is assigned to the 2b special position with (⅓, ⅔, z), which is changed to the 6c general position by its deviation from the triad axis, and O2, O3, O4, O5 and O6 to 6c general positions with (–x, –y, z+½; y, –x + y, z+½; x–y, x, z+½). The occupancies at the T2 and T3 sites were fixed at 1.0 Si, and at the T1 and T4 sites as 1.0 Al, although Si and Al are indistinguishable due to their similar X-ray atomic scattering factors. In the preliminary refinement, occupancies of K and Na in the A and B positions were refined, respectively, without any constraint. As a result, the refined occupancy of K at the A position was <1, and that of Na at the B position was >1. Thus, the occupancies of Na and K at the B position were refined applying the constraint of Na + K = 1. Scattering factors for neutral atoms were employed. The structural refinement based on the space group P63 and the above structural model did not converge well, however (R 1 = 14.32–15.53%). Hippler and Böhm (Reference Hippler and Böhm1989) and Kahlenberg and Böhm (Reference Kahlenberg and Böhm1998) overcame similar difficulties in their crystal structural refinement of a synthetic NaAlSiO4-nepheline with space group P63 and a hexagonal NaAlSiO4-trinepheline with space group P61, respectively, by considering twinning by merohedry, which is often encountered in tridymite derivatives. Consequently, we also took twinning by merohedry into account for the structural-refinement calculation. After this treatment, the R value was reduced to acceptable levels. In the last stage of refinement, the anisotropic displacement factors for all atoms were refined.
Chemical analysis of nepheline
Following the single-crystal XRD analysis, the chemical composition was determined using a JEOL JXA-8530F electron probe microanalyser (EPMA) at the Department of Geoscience of Shimane University. The EPMA was operated with accelerating voltage, specimen current and beam diameter of 15 kV, 2 nA and 5 μm, respectively, to avoid loss of Na and damage from the electron beam. Natural wollastonite was used as the standard for Ca and Si, and halite for Na. Synthetic standards were used for other elements, namely TiO2 (Ti), spinel (Al and Mg), Cr2O3 (Cr), hematite (Fe), MnO (Mn) and KTiPO5 (K). The ZAF method was used for data correction.
Selected area electron diffraction analysis
The thin film of a nepheline sub-sample was examined using a JEOL JEM-2010 transmission electron microscope (TEM) at the Geodynamics Research Center of Ehime University. The TEM was operated at 200 kV. The selected area electron diffraction (SAED) method was employed to characterise the microstructure of the sample.
Results
Chemical composition of Hamada nepheline crystal
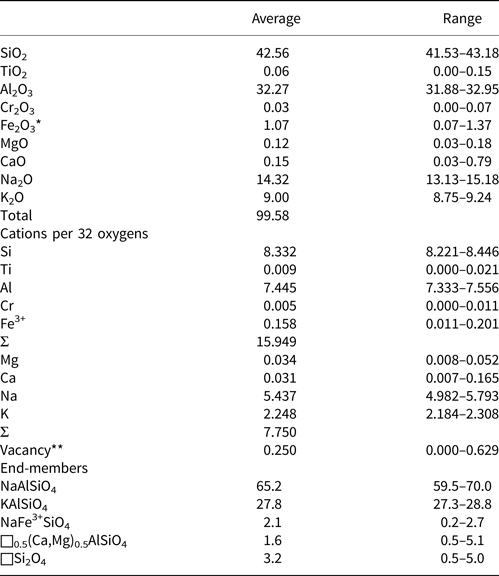
The chemical composition of the Hamada nepheline single crystal used for XRD analysis is shown in Table 1. The Na and K contents are 5.437 and 2.248 atoms per formula unit (apfu, for O = 32), respectively, corresponding to 65.2 and 27.8 mol.% of the NaAlSiO4 and KAlSiO4 end-member components, respectively. The nepheline crystal contained 1.07 wt.% Fe2O3, corresponding to 2.1 mol.% NaFe3+SiO4 component. The Si content reached 8.332 apfu. Excess Si in the Hamada nepheline has been also reported by Fujii (Reference Fujii1974) and Matsubara et al. (Reference Matsubara, Miyawaki, Kato and Matsuyama1998). The excess Si value suggests the presence of a vacancy of 0.332 pfu, similar to the value calculated from the deficiency at the channels (0.250 pfu). The vacancy in this nepheline crystal is represented by □0.5(Ca,Mg)0.5AlSiO4 and □Si2O4 components of 1.6 and 3.2 mol.%, respectively.
Composition of a nepheline crystal used for XRD analysis.

Notes: Under the conditions described, analytical errors are ± 2% relative for major elements and ± 5% relative for minor elements as estimated from the reproducibilty observed in multiple measurements. Calculations based on n = 9 samples.
*Total Fe as Fe2O3; **the vacancy is assumed to be a deficiency in the channels: vacancy = 8 – (Na + K + Ca + Mg).
Single-crystal X-ray structure solution and refinement
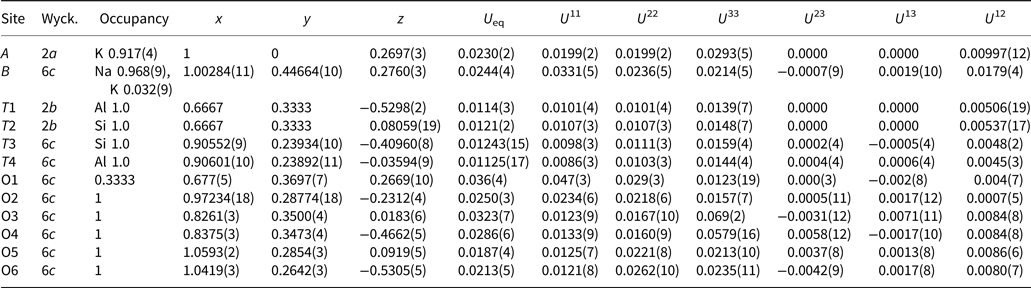
The refinement with space group P63 was converged to an acceptable R 1 (all data) value of 3.69%. The resulting twin ratio of 0.223 and Flack factor of –0.09 indicate that the major twin component (77.7%) adopts the absolute structure (Table 2). This refinement determined 77.7% of the absolute structure and 22.3% of the a and b axis reversed absolute structure in the Hamada nepheline. Crystallographic data and refined parameters are summarised in Table 2. The unit-cell parameters are a = 10.0270(3) and c = 8.4027(3) Å. The cation occupancies of the A and B positions and the refined atomic positions are listed in Table 3. The refined occupancy of K in the A position is 0.917(4), and the shortfall (0.083) is the vacancy. The refined Na and K occupancies at the B position were 0.968(9) and 0.032(9), respectively. These site occupancies give the site populations of 1.834 K + 0.166 □ and 5.808 Na + 0.192 K apfu in the A and B positions, respectively, resulting in Na and K contents of 5.808 and 2.026 apfu, respectively.
Crystallographic data for the Hamada nepheline and experimental details of the single-crystal XRD analysis.

Notes: Data were processed using SAINT (Bruker, Reference Bruker1999). An empirical absorption correction using SADABS (Sheldrick, Reference Sheldrick1996) was applied. Structure solution and refinement were performed using Direct method and SHELXL-97 (Shedrick, Reference Sheldrick2008). Weighting scheme, P = (Max(F o2,0) + 2F c2)/3.
Atomic positions, isotropic and anisotropic displacement parameters (Å2).

Wyck. – Wyckoff positions.
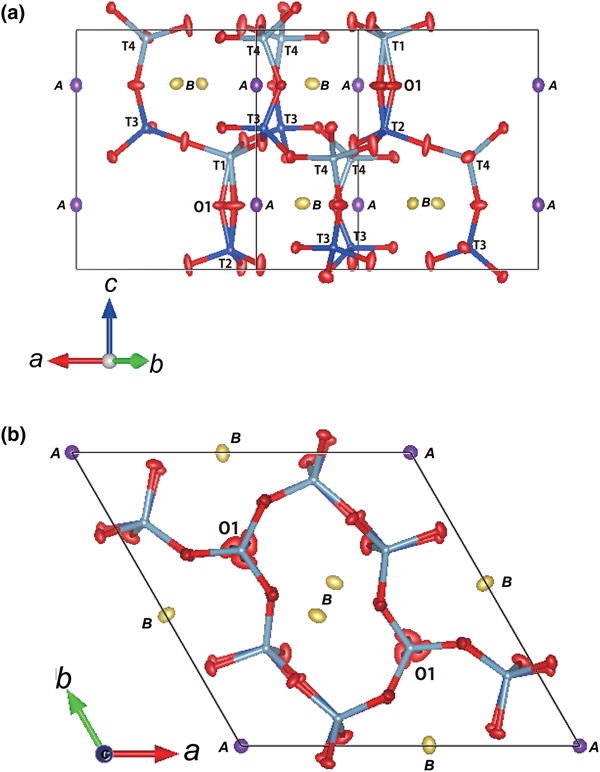
The isotropic and anisotropic displacement parameters are given in Table 3. The crystallographic information files have been deposited with the Principal Editor of Mineralogical Magazine and are available as Supplementary material (see below). Deviation of the O1 atom from the triad axis was recognised, as shown in Fig. 1a and b.
Crystal structure of Hamada nepheline viewed from the [100] direction (a) and viewed down the [001] direction (b). The crystal structures were drawn using the VESTA program (Momma and Izumi, Reference Momma and Izumi2008).

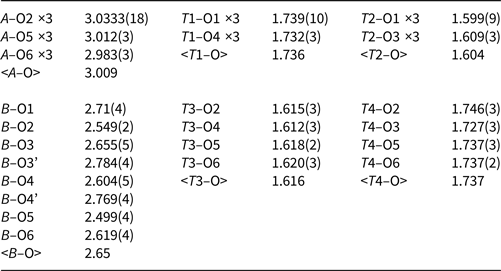
The interatomic distances calculated from the refined atomic positions are shown in Table 4. The average A–O and B–O distances are 3.009 and 2.65 Å, respectively, and the average T–O distances are <T1–O> = 1.736, <T2–O> = 1.604, <T3–O> = 1.616 and <T4–O> = 1.737 Å. By applying a function of T–O distance vs. Al occupancy of the tetrahedral site by Jones (Reference Jones1968), the relative Al and Si occupancy at each tetrahedral site is estimated to be Al0.85(5)Si0.15 for the T1 site, Si1.00 for T2, Al0.08(2)Si0.92 for T3, and Al0.85(2)Si0.15 for the T4 sites.
Interatomic distances (Å).

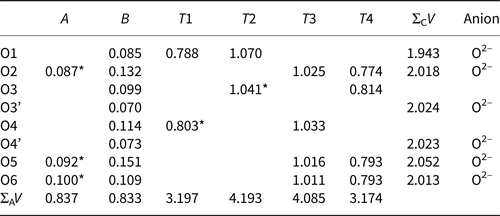
To verify the determined site populations and structural model, bond-valence sums were calculated using the function of the electrostatic strength as defined by Brown and Altermatt (Reference Brown and Altermatt1985), and the bond-valence parameters of Brese and O'Keeffe (Reference Brese and O'Keeffe1991). The result of the bond-valence sum calculation indicates strong self-consistency between the site populations and the bond lengths (Table 5).
Estimated bond-valence (valence units) in nepheline.

Notes: ΣAV is the bond valence emanating from cations summed over the bonded anions. ΣCV is the bond valence reaching the anions.
* Three bonds per cations.
Selected area electron diffraction analysis
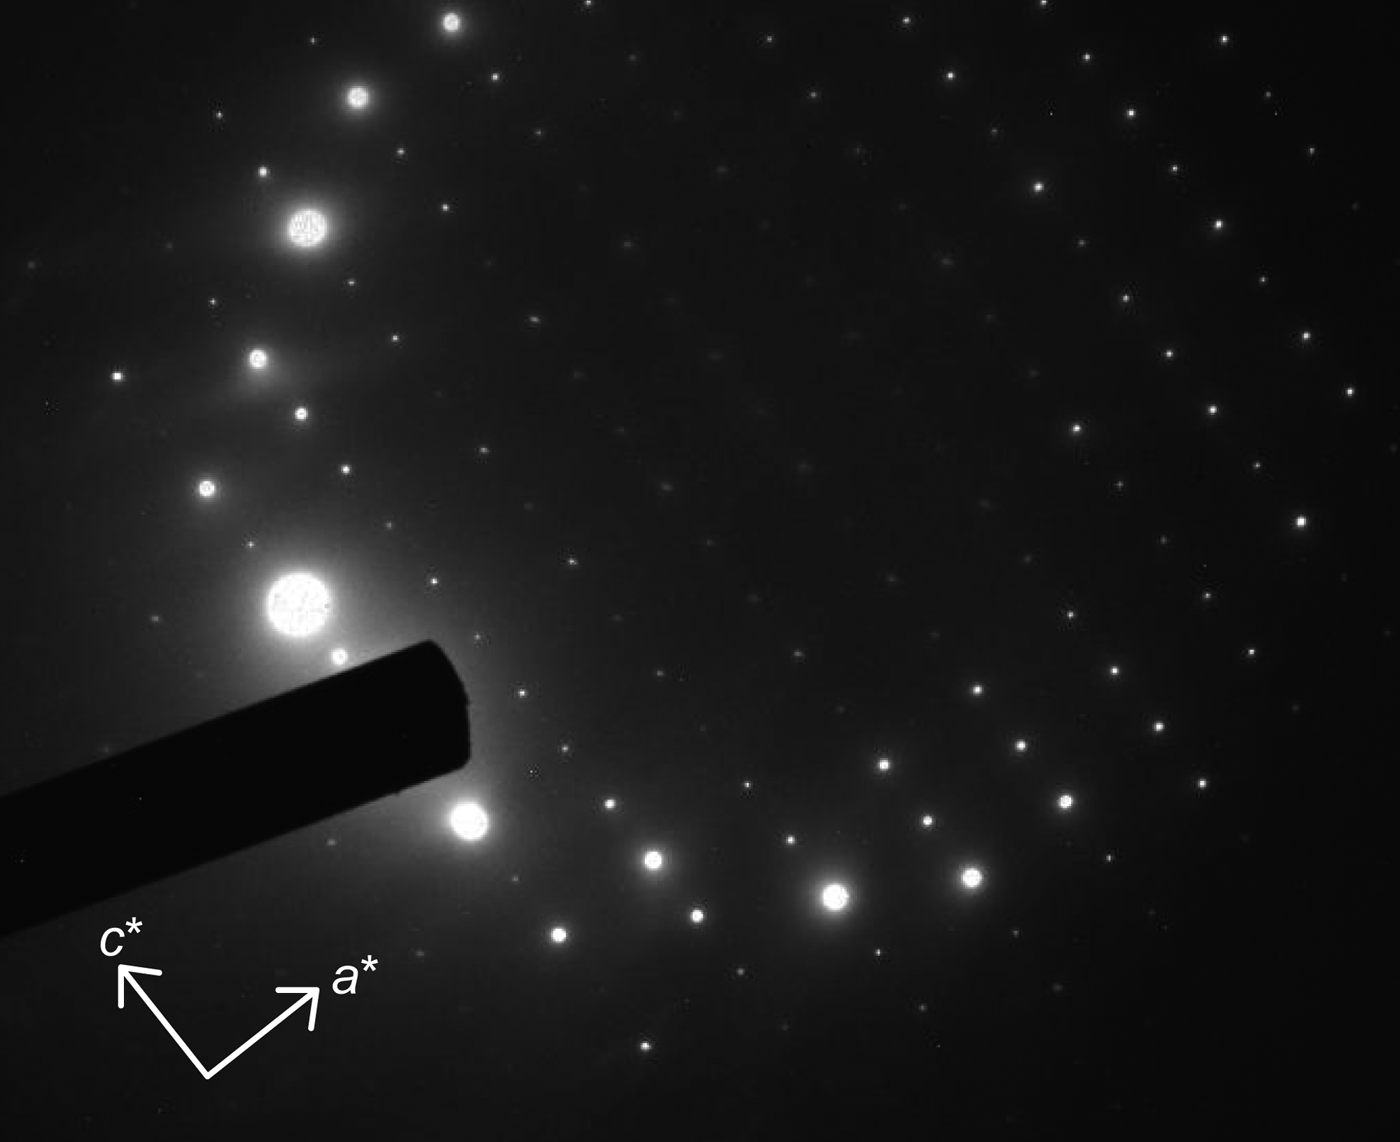
The SAED image viewed down the [010] direction shows that the electron diffraction spots are those of a hexagonal P63 lattice, and no satellite spots and streaks were observed (Fig. 2). Thus, the electron diffraction data are consistent with the result from XRD.
Selected area electron diffraction image of Hamada nepheline viewed down the [010] direction.

Discussion
Al/Si ordering in Hamada nepheline
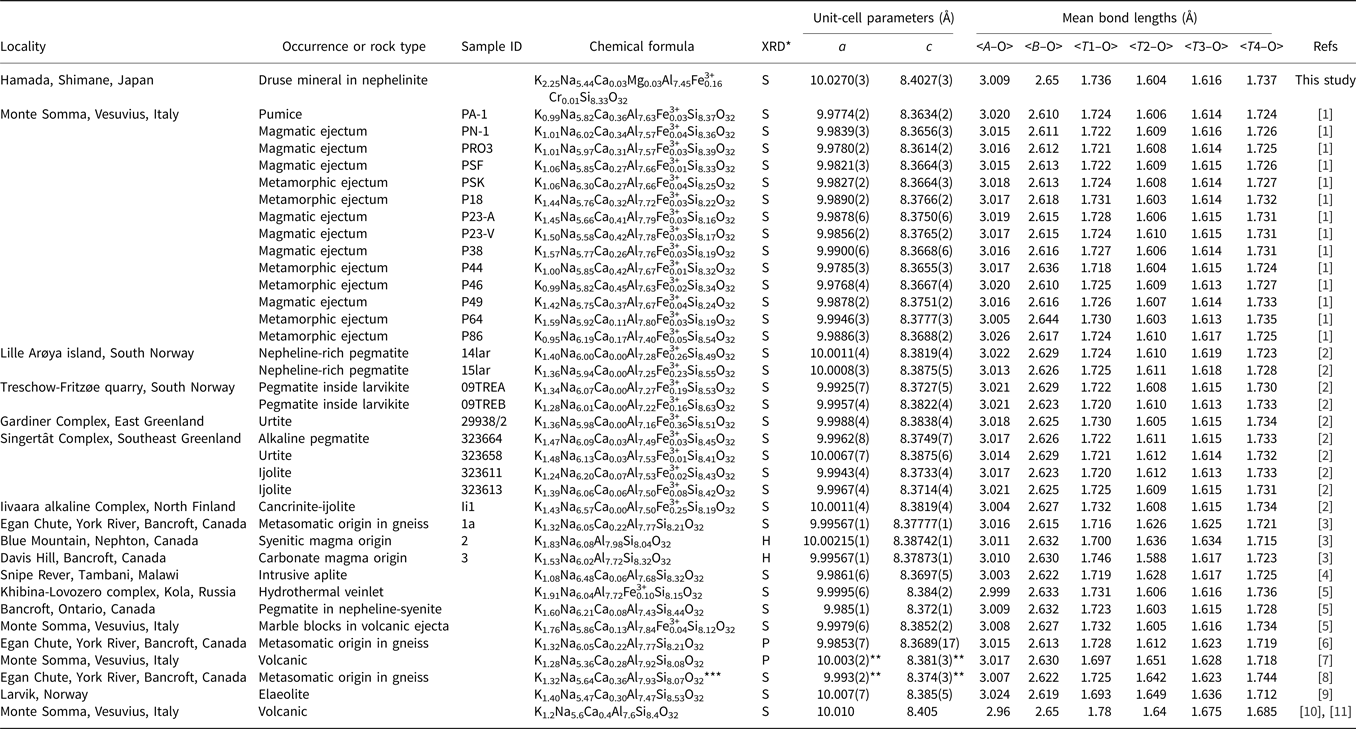
As described in the Results section, the average T–O distances (<T–O>) of the Hamada nepheline show a high degree of order of Al and Si ions in the four tetrahedral sites, with Al preferring the T1 and T4 sites, and Si the T2 and T3 sites. Such an ordered arrangement of Al and Si ions in the tetrahedral sites is consistent with the space group P63. As shown in Table 6, the <T–O> distances and the Al–Si ordering in the tetrahedral sites in the Hamada nepheline are the same as those reported for nephelines from low-temperature pegmatites (Foreman and Peacor, Reference Foreman and Peacor1970; Vulić et al., Reference Vulić, Balić-Žunić, Belmonte and Kahlenberg2011), metasomatised gneiss (Antao and Hassan, Reference Antao and Hassan2010), and intrusive aplite (Angel et al., Reference Angel, Gatta, Ballaran and Carpenter2008): <T1–O> = 1.70–1.75, <T2–O> = 1.60–1.64, <T3–O> = 1.61–1.63 and <T4–O> = 1.72–1.74 Å. Moreover, reported <T1–O>, <T2–O>, <T3–O> and <T4–O> distances for a synthetic nepheline (synthesised at 1000°C for 1 day) by Gregorkiewitz (Reference Gregorkiewitz1984), magmatic nephelines by Balassone et al. (Reference Balassone, Kahlenberg, Altomare, Mormone, Rizzi, Saviano and Mondillo2014) and Antao and Hassan (Reference Antao and Hassan2010), and metamorphic nephelines by Balassone et al. (Reference Balassone, Kahlenberg, Altomare, Mormone, Rizzi, Saviano and Mondillo2014) are almost the same as those of the Hamada nepheline and low-temperature nephelines. The present study and recent results on natural nephelines from various localities thus support the conclusion by Gregorkiewitz (Reference Gregorkiewitz1984) that the degree of ordering does not depend on conditions of crystal formation, such as growth rate or thermal history. Hahn and Buerger (Reference Hahn and Buerger1955) reported <T3–O> and <T4–O> distances of 1.675 and 1.685 Å, respectively, for volcanic nepheline from Monte Somma, implying a high degree of Al–Si disorder in the T3 and T4 sites. However, their data have not been supported by subsequent studies of nepheline at the same locality by Simmons and Peacor (Reference Simmons and Peacor1972), Tait et al. (Reference Tait, Sokolova and Hawthorne2003) and Balassone et al. (Reference Balassone, Kahlenberg, Altomare, Mormone, Rizzi, Saviano and Mondillo2014) (Table 6). Thus, the T–O distances reported by Hahn and Buerger (Reference Hahn and Buerger1955) seem to be invalid.
Unit-cell parameters, mean T1–O, T2–O, T3–O and T4–O distances of nephelines from various localities.

* XRD method: S – single-crystal XRD; H – high-resolution powder XRD; P – powder XRD.
**Unit-cell parameters determined by powder-diffraction method; ***After Tilley (Reference Tilley1954).
Refs: [1] Balassone et al. (Reference Balassone, Kahlenberg, Altomare, Mormone, Rizzi, Saviano and Mondillo2014); [2] Vulić et al. (Reference Vulić, Balić-Žunić, Belmonte and Kahlenberg2011); [3] Antao and Hassan (Reference Antao and Hassan2010); [4] Angel et al. (Reference Angel, Gatta, Ballaran and Carpenter2008); [5] Tait et al. (Reference Tait, Sokolova and Hawthorne2003); [6] Hassan et al. (Reference Hassan, Antao and Hersi2003); [7] Simmons and Peacor (Reference Simmons and Peacor1972); [8] Foreman and Peacor (Reference Foreman and Peacor1970); [9] Dollase (Reference Dollase1970); [10] Buerger et al. (Reference Buerger, Klein and Donnay1954); [11] Hahn and Buerger (Reference Hahn and Buerger1955).
Distribution of Na, K ions and vacancy in two channels and structural properties
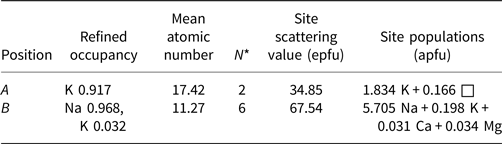
As described above, the refined occupancies yielded site populations in the A and B positions of 1.834 K + 0.166 □ and 5.808 Na + 0.192 K in apfu, respectively. Exclusive occupation of K+ ions and existence of vacancies in the A position due to the excess Si have been also confirmed by published XRD studies of nephelines with Kls components of <25 mol.% (Table 6).
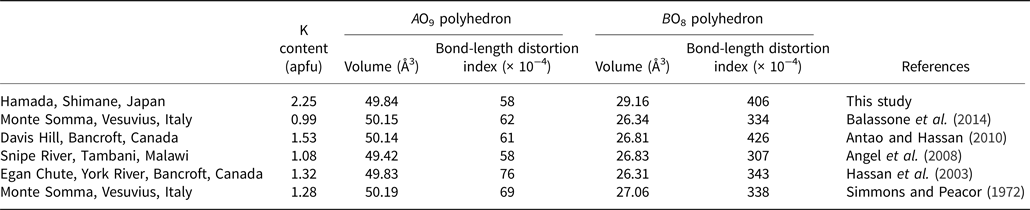
The vacancy in the A position is related to the volume of the AO9 polyhedron by the regression equation formulated by Vulić et al. (Reference Vulić, Balić-Žunić, Belmonte and Kahlenberg2011), namely: A[the number of vacancy (pfu)] = 0.5817 × [the volume (Å3) of AO9-polyhedron] – 28.5633. As the vacancy of the Hamada nepheline derived from the EPMA data is 0.250 pfu, the volume of the AO9 polyhedron is calculated as 49.5 Å3, using the above regression equation. While the vacancy of 0.166 pfu given by the refined site occupancy in the A position yields a calculated volume of 49.4 Å3 for the AO9-polyhedron. These calculated AO9-polyhedral volumes match fairly well with the observed volume of the AO9-polyhedron of the Hamada nepheline of 49.84 Å3 (Table 7). Thus, the K population and vacancy in the A position from the EPMA data are supported by the XRD data.
Volumes and bond-length distortion indices* of AO9 and BO8 polyhedra in the Hamada nepheline and selected published nephelines

*The volume and bond-length distortion index defined by Baur (Reference Baur1974) was calculated using VESTA program by Momma and Izumi (Reference Momma and Izumi2008).
The atomic population in the B positions calculated from the refined site occupancies indicates that K+ ions of 0.192 apfu substitute for Na+ ions. However, the EPMA data indicate small amounts of Ca2+ and Mg2+ are present in the nepheline crystal studied (Table 1). Due to their appropriate ionic radii, both Ca2+ and Mg2+ are regarded as distributed in the B position. As shown in Table 8, the atomic-site populations in the B positions were thus recalculated, using the observed site-scattering values derived from the refined K and Na occupancies, after the method by Hawthorne et al. (Reference Hawthorne, Ungaretti and Oberti1995). The determined atomic-site population in the B position is 5.705 Na + 0.198 K + 0.031 Ca + 0.034 Mg, where Ca and Mg contents (apfu) were fixed to the values determined by EPMA. The resulting total K content is as much as 2.032 apfu, and hence is reasonably consistent with the EPMA data.
Refined occupancy, multiplicity, mean atomic number, site-scattering values and atomic populations in the A and B positions.

*N – number of equivalent positions in the structural formula; epfu - electrons per formula unit.
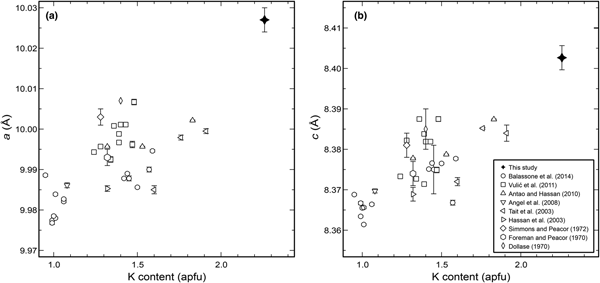
As summarised in Table 6, the crystal structures of nephelines reported to date are for those with Kls components of <25 mol.%. According to the accurate and precise data published after 1970, the a and c dimensions of those nephelines fall in the ranges of 9.9768–10.007 Å and 8.3614–8.3875 Å, respectively (Table 6; Fig. 3). However, the a and c dimensions of the Hamada nepheline contain 27.8 mol.% Kls (Table 1) with a = 10.0270(3) and c = 8.4027(3) Å, values that are significantly larger than the cell dimensions of nephelines with Kls components of <25 mol.%.
Cell parameters of a (a) and c (b) as a function of K content (apfu). Closed symbol: this study; open symbols: reported data. Symbols and sources: circles (Balassone et al., Reference Balassone, Kahlenberg, Altomare, Mormone, Rizzi, Saviano and Mondillo2014), square (Vulić et al., Reference Vulić, Balić-Žunić, Belmonte and Kahlenberg2011), triangle (up) (Antao and Hassan, Reference Antao and Hassan2010), triangle (down) (Angel et al., Reference Angel, Gatta, Ballaran and Carpenter2008), triangle (left) (Tait et al., Reference Tait, Sokolova and Hawthorne2003), triangle (right) (Hassan et al., Reference Hassan, Antao and Hersi2003), diamond (Simmons and Peacor, Reference Simmons and Peacor1972), hexagon (Foreman and Peacor, Reference Foreman and Peacor1970), narrow diamond (Dollase, Reference Dollase1970).

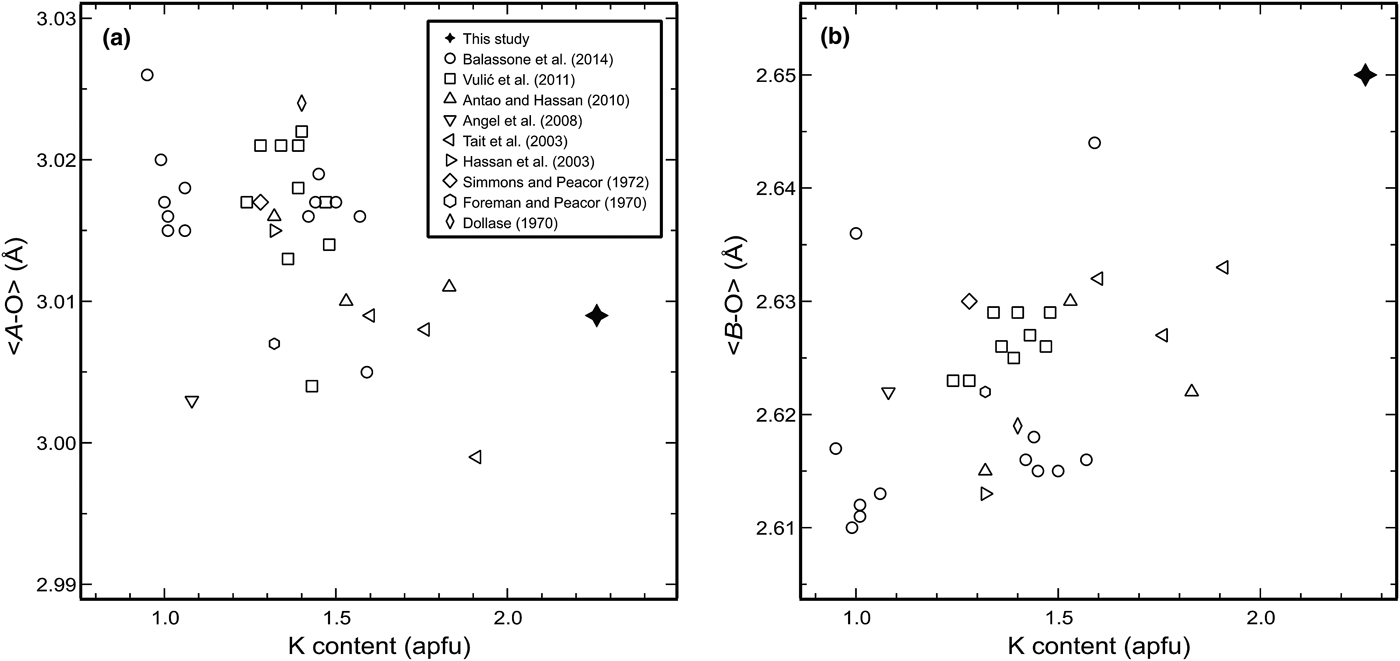
The cause of the larger unit-cell parameters of the Hamada nepheline compared to lower-K nephelines cannot be explained in terms of the K content in the A position and A–O distance, as: (1) the A position in the Hamada nepheline is essentially filled with K+ ions; (2) the <A–O> distance of the Hamada nepheline (3.009 Å, Table 4) falls in the 2.96–3.026 Å range of nephelines with Kls <25 mol.% (Table 6; Fig. 4). In contrast to the <A–O> distance, the <B–O> distance (2.65 Å) of the Hamada nepheline is longer than those of the nephelines with Kls <25 mol.%, <B–O> = 2.610–2.644 Å (Table 6; Fig. 4), provided the <B–O> = 2.65 Å value of Hahn and Buerger (Reference Hahn and Buerger1955) is ignored, as it has not been supported by subsequent studies of the nepheline from the same locality, as well the T–O distances. This is due to the substitution of K+ for Na+ in the B position. As the <A–O> distance in nepheline does not vary with K content, the increase of the <B–O> distance is considered to cause the increased cell dimensions of the Hamada nepheline.
The relationship between K content and <A–O> (a) and <B–O> distances (b). Symbols as in Fig. 3.

An effect of the substitution of K for Na on distortion of the structural channels
The incommensurate structure in nepheline has been rationalised as arising from the disordering of K+ ions and vacancies on the large structural channels and a displacive mechanism, such as the off-centring of the O1 apical oxygen atoms (McConnell, Reference McConnell1962; Palmer, Reference Palmer, Heaney, Prewitt and Gibbs1994). Although the Hamada nepheline satisfies two requirements, an incommensurate structure was not recognised using X-ray and electron diffraction techniques. As described above, there are no significant differences for the K + □ combination and the <A–O> distances in the A position between the Hamada nepheline and natural nephelines described previously. However, the bond-length distortion index (D.I.) defined by Baur (Reference Baur1974) of the Hamada nepheline, D.I. = 58 × 10–4, corresponds to the lowest published value for K-poor nephelines, which range from D.I. = 58 × 10–4 to 76 × 10–4 (Table 7). As shown in Tables 4, 6 and 8, the Hamada nepheline is further characterised by large and distorted BO8 polyhedra (<B–O> = 2.65 Å; volume = 29.16 Å3; D.I. = 406 × 10–4), compared with the K-poor nephelines (<B–O> = 2.610–2.644 Å; volume = 26.31–27.06 Å3; D.I. = 307 × 10–4–426 × 10–4). We believe this result indicates that substitution of K+ for Na+ in the B position causes expansion of the BO8 polyhedra and increases its distortion, which reduces distortion of the AO9 polyhedra. Such change of distortion of the AO9 and BO8 polyhedra may lessen the effect of the deviation of the O1 atom from the triad axis on the incommensurate modulation.
Significance of twinning by merohedry in Hamada nepheline
The Hamada nepheline examined in this study contains twinning by merohedry. P63 nepheline containing such twinning has been reported previously only for synthetic NaAlSiO4 modification, and not for natural samples. This study is thus the first report of natural P63 nepheline containing twinning by merohedry. In Hamada nepheline, 77.7% of the absolute structure and 22.3% of the a and b axes reversed absolute structure were determined by the refinement. In crystals with twinning by merohedry and pseudo-merohedry, lattices of twin individuals are the same as each other, and the boundary between twin individuals is complex (Takeda, Reference Takeda1975). The results of this study suggest that twinning by merohedry in natural nepheline may not be rare, even if such twins have not been reported in published studies to date.
Conclusions
Published studies on the crystal structures of the natural nephelines have confirmed two causes of the deviation of the Na:K ratio of nepheline from the ideal value of 6:2. The first is formation of a vacancy in the A position by the K+ + Al3+ ↔ □ + Si4+ substitution, and the other is substitution of Na+ for K+ in the A position (Dollase and Thomas, Reference Dollase and Thomas1978). These mechanisms explain reasonably the reason for some depletion of K and enrichment of Na in natural nephelines. Our present study identifies a third mechanism for the deviation of Na:K ratio from the ideal 6:2 value in a natural nepheline, namely the substitution of K+ for Na+ in the B position. The Na and K distribution in the A and B positions of nepheline thus deviate somewhat from the complete ordered state. Possible factors controlling the three mechanisms need to be clarified by further study.
Acknowledgements
The authors thank Mr. Ryuzo Kuwata of the Association of Earth Sciences of Shimane and Mr. Noriyuki Izawa of Hazama Corporation for their guidance during nephelinite sample collection from the construction site of the Naka-Uchida tunnel, and to Assistant prof. Terumi Ejima of Shinshu University for her support during sample collection. We thank Dr. Barry Roser of the Department of Geoscience, Shimane University, for his critical reading of several versions of the manuscript, Dr. Kenji Yoza of Bruker AXS K.K. for his guidance in structural analysis using APEX II, and Prof. Akira Yoshiasa of Kumamoto University and Associate Prof. Mariko Nagashima of Yamaguchi University for their critical and helpful comments. The first author (M.H.) was supported by a Grant-in-Aid for Scientific Research (No. 22-1791) from the Ministry of Education, Culture, Sports, Science and Technology (MEXT) of Japan.
Supplementary material
To view supplementary material for this article, please visit https://doi.org/10.1180/mgm.2018.133