Introduction
The economic crisis that took hold in 2008 has resulted in the level of health spending stagnating or falling in many OECD countries after years of continuous growth. According to health expenditure figures collected by OECD and stretching back as far as 1960, the average growth rate across the OECD zone fell close to zero for the first time in 2010 and stayed at that level in the following year. Furthermore, preliminary data suggests that this trend continued through 2012. However, behind this average growth rate, there is considerable variation in spending trends since 2009, both regarding the countries and the sectors of health care spending most affected.
Although all sectors of health spending appear to have been affected by the crisis, initial analysis suggest that the greatest decreases has been experienced in pharmaceutical spending and that many governments appear to have also made significant cuts in the amount allocated to prevention and public health services.
In a few countries public health budgets were kept stable either because the country was less affected by the crisis or because commitments were made to ring-fence existing health budgets – at least in the initial aftermath of the economic downturn. In other countries, however, various measures were adopted to reduce public deficits either by adjusting the public resources allocated to health or by increasing efficiency. In some cases, planned reforms may have been accelerated or intensified in face of a worsening fiscal situation.
Governments, for the most part, wield a certain degree of control over the supply, demand and cost of health services and goods. Measures that control inputs, set caps to budgets, or freeze prices, can lead to significant cost savings or strongly contain the rate of growth in health spending. A broad categorisation of the different policy instruments to control public health care spending has previously been proposed along these lines (OECD, 2010, Mladovsky et al., Reference Mladovsky, Srivastava, Cylus, Karanikolos, Evetovits, Thomson and McKee2012). Such policy measures have been utilised widely, albeit to varying degrees over time and across countries.
The rest of this article starts with a brief presentation of the framework and data limitations. A broad review of the recent spending trends across the OECD by country follows, before examining the changes in the level of public expenditure and the possible impacts on private spending. The analysis then turns towards an investigation of the different sectors of public expenditure on health. Reference is made throughout to additional evidence and information in order to illustrate the various approaches and types of policy instruments that have been adopted by certain countries and groups of countries during the economic crisis.
It should be made clear that the overview focuses on identifying the trends in health expenditure between countries and across sectors and does not discuss the effectiveness of policy responses to the crisis or indeed the effect of such policies on the health status of the population. Furthermore, the central focus of remains on health spending, rather than the financial resources used to fund such spending. This is important since the analysis does not track the reductions in taxes and social contributions that have occurred as result of the economic crises.
Framework and data limitations
The analysis of health spending trends covers the countries of the OECD. In terms of the exogenous shock arising from the global financial crisis (GFC), a distinction is often made between the trends in health spending in the European arena compared with countries away from this region. Examining the economic effects clearly shows this gulf with real GDP in the European OECD economies falling by 0.5% on average each year between 2008 and 2011 compared with annual 2.0% growth in the non-European OECD economies.
The 2012 WHO report ‘Health policy responses to the financial crisis in Europe’Footnote 1 has served as a rich source of information, documenting some of the early measures taken by European countries through a series of questionnaires conducted in March and April 2011. Additional information is available in the National Reform Programmes as presented by Member States in the framework of the EU Stability and Convergence programmes.Footnote 2
The analysis makes use of OECD Health Statistics 2013 (OECD, 2013). For health expenditure data, there exist certain limitations in terms of timeliness since at the time of writing the most recent detailed health expenditure data for most OECD countries refers to 2011; preliminary data for 2012 are only available for a handful of countries. Therefore, the impact of measures or decisions taken in 2011 or 2012 as economic conditions continued to be difficult in some countries are unlikely to show in the available spending data. Moreover, there is a lower level of detail available for some of the countries most affected and those imposing the more severe cuts in public spending.Footnote 3
Similarly, little information is available concerning the impact on the cost structure of the providers of health services (essentially this is limited to salaries and, to a lesser extent, drugs given in in-patient settings). Finally, the lack of a price deflator specific to the health sector means that there is no clear separation of the price and volume trends. Available information is limited to the consumption of health care goods and services in nominal terms deflated using the economy-wide GDP deflator.
Recent health spending trends
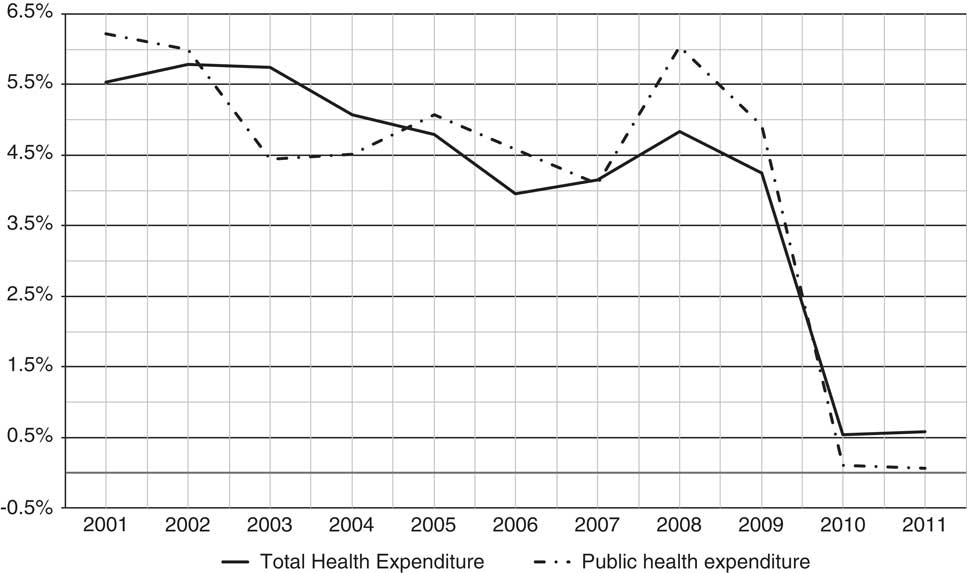
As the effects of the GFC started to take effect, average health spending growth across the OECD dropped to 0.6%, in real terms, from 2009 to 2011 compared with an average of 4.8% over the whole period from 2000 to 2009 (Figure 1). Preliminary estimates for a number of countries suggest that growth is likely to have remained at a similar level through 2012.
Average OECD health expenditure growth rates in real terms, 2000 to 2011, public and total Source: OECD (2013).

During the pre-crisis period from 2000 to 2008 health spending continually outpaced economic growth resulting in an ever-increasing share of GDP (reaching 8.9% on average in 2008). In 2009, however, health spending jumped to 9.6% of GDP on average across OECD countries as overall economic conditions deteriorated and health spending was essentially maintained in many countries. As a result of the subsequent low growth in health spending across OECD countries in 2010 and 2011, the percentage of GDP devoted to health declined. The continuing reductions in health spending have resulted in this share of GDP falling to 9.3% by 2011.
However, the extent of the slowdown has varied considerably across the OECD. While a number of European countries experienced drastic cuts in spending, other countries made commitments to safeguard health care budgets, at least in the immediate wake of the economic crisis. For those countries mainly outside of Europe, there has tended to be a continuation in the growth of health spending, albeit at a reduced pace.
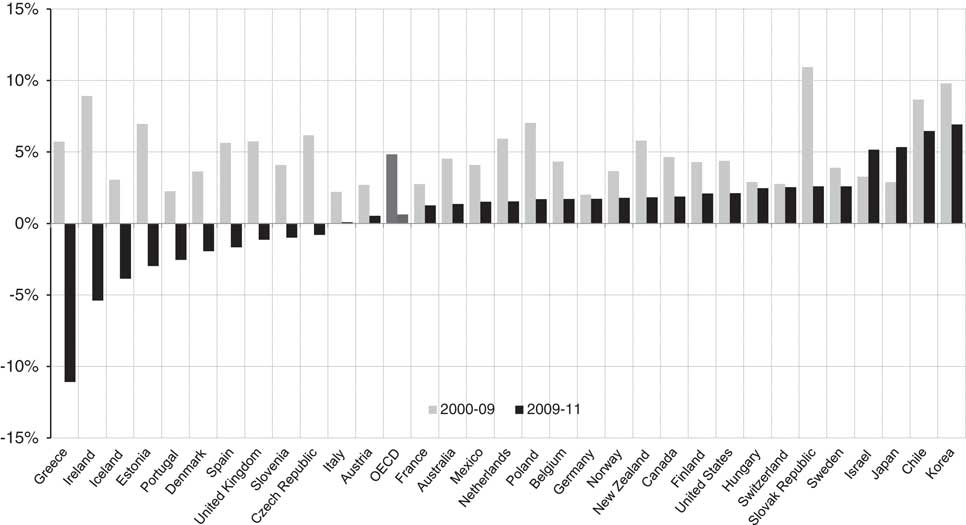
In the European countries hardest hit by the economic downturn, some dramatic reversals in health spending were observed, compared with the period before the crisis (Figure 2). In Greece, overall health spending dropped by 11% in 2010 and again in 2011 after a yearly growth rate of more than 5% on average between 2000 and 2009. These reductions were mainly driven by deep cuts in government spending. Ireland, Iceland and Spain also experienced two consecutive years of reductions in health spending. Some countries, such as Estonia and the Czech Republic saw severe falls in spending in 2010 (−6.9% and −4.2% growth in health spending in real terms), followed by a modest rebound in 2011 (+1.25 and +2.5%, respectively). Others, such as Portugal and Italy, delayed any cuts in their health budgets in 2010, but subsequently took measures to reduce public health spending in 2011. Public spending on health in Portugal dropped by 8% in 2011, after the level of spending had been maintained in 2009 and 2010.
Average annual growth in health spending across OECD countries, 2000–2011 Notes: Growth rates for Australia, Denmark, Japan, Mexico and Slovak Republic refer to 2009–2010. Growth rates for 2009–2011 are not available for Luxembourg and Turkey. Growth rates for Chile calculated using the Consumer Price Index (CPI). Source: OECD (2013).

The range of budgetary instruments available to governments is to an extent linked to the type of financing system in place, with those countries with tax-based central financing having more leeway to put in place immediate caps and impose cuts compared with social insurance-based systems. Comparing public expenditure growth for OECD countries predominantly financed through general taxation with those financed through social insurance contributions shows similar real-term growth rates in public health spending of around 5% year-on-year between 2000 and 2009. However, a much sharper fall in spending of −1.2% in 2010 for the general taxation group of countries compared with a more gradual slowing to around 2% for social insurance based countries. In 2011, while there is still a contraction in health spending in the general taxation countries, there is a suggestion of a turning point compared with a continued slowdown of public spending growth in the social health insurance systems.
In countries with statutory health insurance schemes, the declining revenues due to rising unemployment and higher health demands did result in some measures to regularise contribution rates and benefits, as in the case of Greece, or a tightening of the collection measures, as in the case of Slovenia. In Hungary, in order to compensate for the loss of revenues in the National Health Insurance Fund, the funding mechanism was shifted significantly in 2009 with a reduction in the employers’ contribution rate (as a measure to also stimulate the labour market) and the shortfall being compensated by government transfers from general tax revenues (Gaál et al., Reference Gaál, Szigeti, Csere, Gaskins and Panteli2011).
Countries that committed to safeguard health care budgets in the face of dwindling revenues either reallocated resources from other sectors or used surpluses built up in previous years. While Belgium maintained budgets at previous levels, France and Denmark actually saw health budgets rise in the short-term – the latter cross-subsidising the health budget by the education budget. In another example, Estonia was able to draw on some of the accumulated financial reserves to fill the immediate gaps left by decreasing contributions in 2009, even if overall spending was still significantly reduced.
In Ireland, the health budget also increased by 1% in 2009, but cost-containment measures were implemented in 2011 with the overall budget for health cut by 6.6%.
Away from Europe, health spending growth also slowed in 2010 and 2011, notably in Canada (3.0% in 2010 and 0.8% in 2011 in real terms) and the United States (2.5% in 2010 and 1.8% in 2011, also in real terms). In the United States, the share of health spending to GDP has remained at 17.7% between 2009 and 2011, after years of steady increases. It is not clear yet whether the recent slowdown in health spending in the United States reflects mainly cyclical factors (and may therefore not have any lasting effect when the economy picks up) or more structural changes. Only two OECD countries – Israel and Japan – saw the rate of health spending growth accelerate since 2009 compared with the period before.
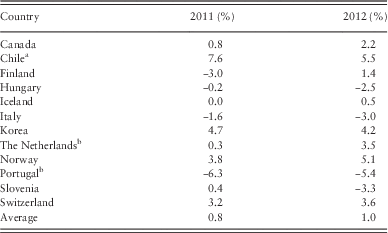
Available preliminary information suggests only a modest increase in real health expenditure is likely to have been experienced between 2011 and 2012, although again there is a high degree of variability between countries. The estimates indicate that the un-weighted average growth rate for the subset of 12 OECD countries was around 1.0% compared with growth of 0.8% in 2011 (Table 1). Some European countries such as the Netherlands and Finland may have seen something of a rebound in spending in 2012, while others, such as Hungary, Italy and Portugal continued to experience a contraction in overall health spending. Chile and Korea continued to see strong growth in health spending in 2012, albeit lower than in 2011.
Preliminary estimates of 2012 health spending growth rate (in real terms) compared with 2011

a Deflated using consumer price index.
b Refers to current expenditure on health, that is excluding capital expenditure. Source: OECD (2013).
Shifts from public to private spending on health
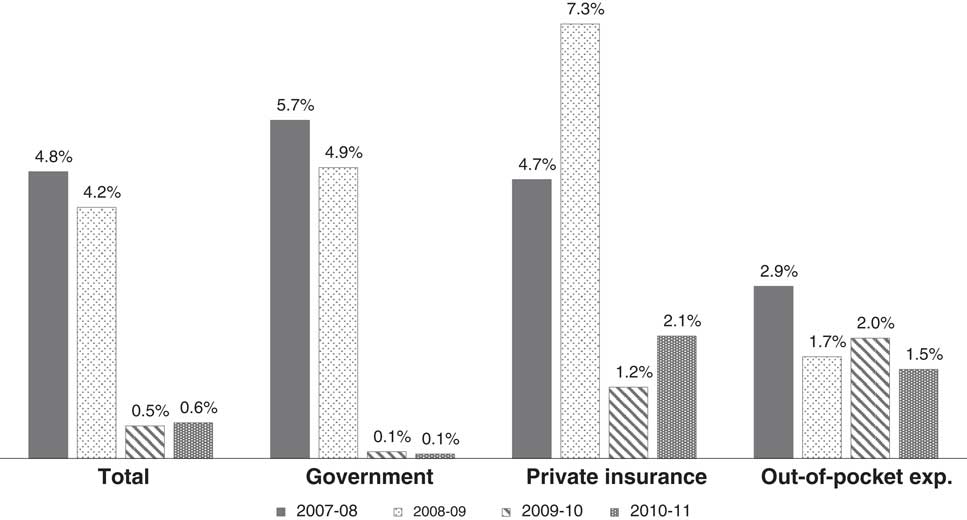
The abrupt halt in overall health spending has been driven primarily by a collapse in the growth of government expenditure. While government spending contracted in many affected countries, growth in household expenditure and payments for health care services under private insurance arrangements remained more resilient as a result of a partial shift of the financing burden from public to private sources (Figure 3).
Average annual growth in health spending by type of financing, 2008–2011 Source: OECD (2013).

While some countries did make early cuts in public spending in 2009 (notably Estonia and Iceland, which saw cuts of −3.4% and −2.2%, respectively), there were more widespread reductions in 2010 with government health spending growth either negative or close to zero for more than half of OECD countries, resulting in an average of 0.1% overall. Furthermore, public spending on health remained at the same level in 2011 (0.1%). Perhaps not surprisingly, those countries seeing the greatest economic downturn also saw the largest reduction in public spending on health. Over the period 2009–2011, Greece, Ireland, Iceland, Portugal and Spain registered average annual decreases in public health spending of 13.3%, 9.1%, 4.8%, 3.7% and 2.5%, respectively. A few other countries, such as Italy delayed the introduction of measures to substantially cut back public expenditure until 2011.
By contrast, in some OECD countries outside of Europe, government health spending continued to show relatively strong growth since 2009. Japan posted an increase of 6.1% in 2010, while Korea increased public spending on health by 5.6% on average in 2010 and 2011. In the United States, although slowing significantly from earlier years, growth in public spending on health remained at 2.8% on average from 2009 to 2011.
Adjustment of the benefit package available under public coverage is one possible tool open to governments as a way to reduce public spending. Few changes appear to have taken place regarding eligibility to public coverage: Ireland, for example, removed statutory coverage of primary care for some wealthy individuals and in Spain, changes introduced in September 2012 excluded all but basic emergency care, prenatal care, and paediatric care to undocumented migrants (Legido-Quigley et al., Reference Legido-Quigley, Otero, la Parra, Alvarez-Dardet, Martin-Moreno and McKee2013). The majority of countries have maintained existing coverage with the fundamental objective of maintaining access to care for the population, or the most vulnerable sections of the population. On the other hand, more widespread changes have been made to the cost-sharing arrangements with the increase (or introduction) of user-charges for health services – both in-patient and out-patient.
However, while the shifting of some of the costs of health care may have resulted in a higher out-of-pocket share, at the same time the incomes of many households remained flat or decreased as a result of the crisis, perhaps leading to the postponement or foregoing of some care services. Therefore, the net result has been a slowdown in the growth of private household spending on health, but at a more gradual rate compared with public spending – the average growth rate decreasing from 2.9% in 2009 to between 1.5% and 2.0% in the following years. A similar impact can be seen in the growth in spending by private insurance, which again may have seen some upward pressure as a result of reduced public coverage. As a result, in Ireland, the private sector share of current health spending grew from 27.3% in 2009 to 31.5% in 2011 and from 30.5% to 33.9% in Greece. Increases were also observed in Portugal, Iceland and Spain.
Reductions across all health care sectors
Cutbacks in public spending have typically been made across the board, hitting all types of health care goods and services, although again there has been large variation in the type and extent of actions taken by governments.
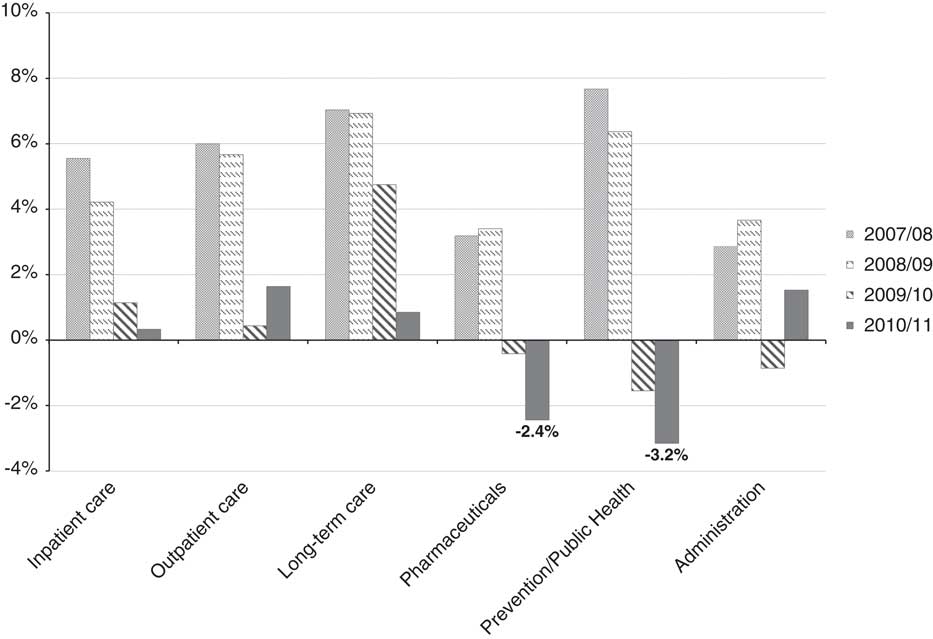
In 2010, the most significant reduction in growth was in the out-patient or ambulatory sector, where strong growth of close to 6% in both 2008 and 2009 reduced to only a 0.4% increase on average in 2010 (Figure 4). Given the importance of the out-patient sector in overall health spending (32% of current spending across OECD countries on average), this was a major contributor to the overall decrease in public health spending. A further disaggregation of the out-patient sector points to a more important overall reduction in the areas of dental care and specialist services as perhaps a postponement of care or a shift in some of the cost-sharing elements took effect.
Average growth by main function of health care, public expenditure, 2008–2011 Source: OECD (2013).

For the period since 2009 as a whole, pharmaceutical spending has been a prime target of cost-cutting efforts in many countries, with average spending falling slightly in 2010, but followed by deeper cuts in 2011. Many countries have introduced measures to contain government spending on pharmaceuticals which is one of the main components of overall public health spending (around 17.5% of current health expenditure on average across OECD countries). Changes in cost-sharing, reductions in prices and coverage, promotions for the increased use of generics, and moves towards central procurement are among the various measures used in many countries.
In 2011, Portugal, Greece and Spain reduced spending on prescription pharmaceuticals by 20%, 13% and 8%, respectively. In Greece, a 1.2 billion euro reduction in the public pharmaceutical bill through negotiated prices and other cost-cutting measures helped to reduce overall public health spending more than 3 billion euros by 2011, contributing to a reduction in the overall public deficit equivalent to 1% of GDP.
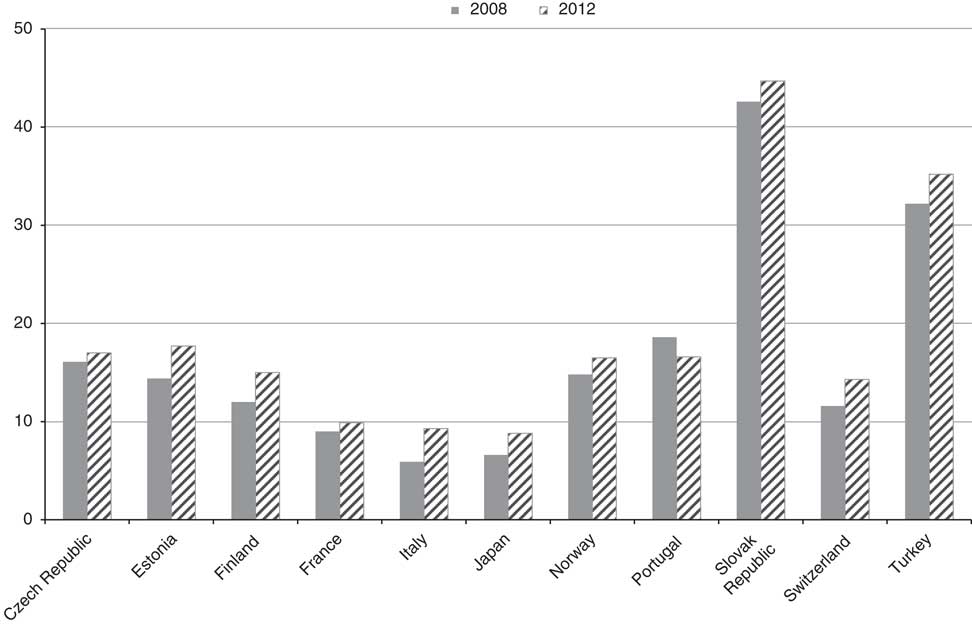
Other savings have been made in medical goods spending by introducing incentives to doctors for rational prescribing (e.g. Hungary). Portugal introduced a number of measures from 2011 aimed at price reductions on a series of pharmaceutical products, as well as introducing centralised procurement of medicines and guidelines in order to reduce administration costs. There has also been a general move in many countries towards increasing the share of generic drugs although there remain large variations in the market share (Figure 5). On average across the 11 OECD countries, the value of generics in the total pharmaceutical market has increased by 18% between 2008 and 2012, while in volume terms the share increased by 23%.
Share of generics (value) in the total pharmaceutical market, 2008 and 2012 Notes: Bars refer to 2008 and 2011 for Czech Republic, Estonia and Finland; 2008 and 2009 for France; 2007 and 2011 for Japan. Source: OECD (2013).

Policies to control the demand for services, such as through health promotion campaigns to reduce alcohol and tobacco consumption or to improve healthier living may be seen as more long-term strategies to reduce future spending rather than policies to immediately tackle public sector deficits. Government plays the primary financing role in providing such services, even though prevention and public health typically represent only a small share of their health budgets (around 3–4% on average). However, health spending figures show that many governments appear to have made significant cuts in the amount allocated to prevention and public health; more than three-quarters of OECD countries reporting expenditure on prevention and public health for 2011 showed a real-term cut in spending and half of the countries spent less on public health and prevention in 2011 than in 2008.
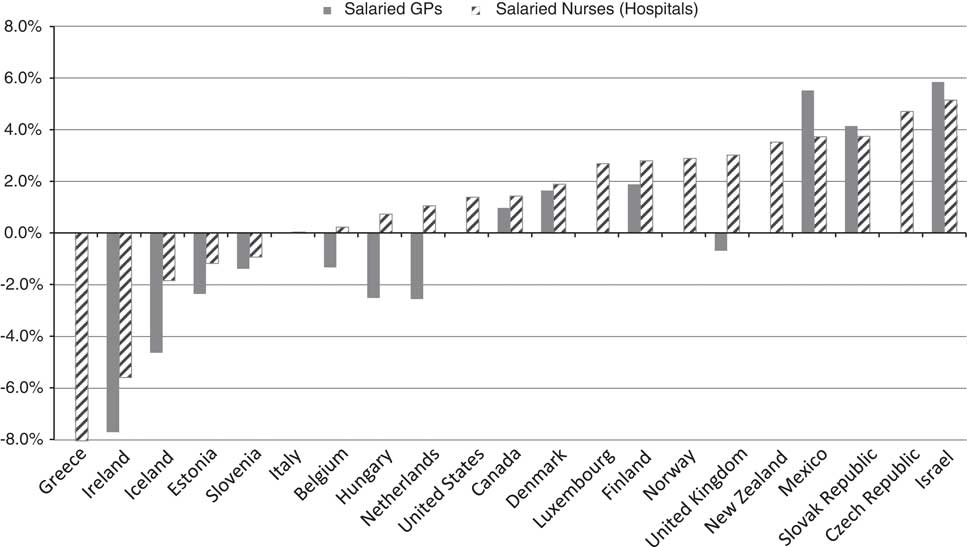
Many countries have also tried to slow the growth in in-patient (hospital) spending, one of the biggest spending items in most countries. Given the high proportion of spending in hospitals accounted for by labour costs, an immediate measure taken in some of the hardest hit countries has been to cut wages and salaries, or reduce the size of the health care workforce.
Figure 6 shows that the decrease in remunerations for nurses (in hospitals) and salaried GPs across an available selection of OECD countries. Greece, Ireland and Iceland all show significant reductions in salary levels between 2009 and 2010. Both Spain and Greece made significant cuts in salaries, while Italy put a hold on wage increases for a period of three years. A public sector pay freeze in the United Kingdom has been a major factor towards the NHS ‘doing more with the same’. Ireland also introduced a significant reduction in fees to health professionals, imposing an 8% cut in 2009 with further cuts of 5% in 2010 and 2011. Similarly, Slovenia introduced price reductions of 2.5% on health services with related penalties for those health care providers breaching contracts.
Nominal change in nurse and GP remunerations, 2009–2010 Source: OECD (2013).

Additional measures in the hospital sector have included reductions in beds or changes in provider payments. In the Czech Republic there was no increase in the reimbursement of hospitals from the insurance funds in 2010. Estonia targeted the payments to health care providers by reducing the prices of health care services by 6% from 2009, following rapidly increasing prices before the crisis. At the same time, prices in primary care saw a lower reduction of around 3%. In England, the government imposed real-term cuts in the DRG-type tariff that hospitals are paid as part of an effort to incentivise greater productivity.
On the other hand, the provision of long-term care services has continued to be a cost pressure, even in those countries affected by the crisis, with average growth remaining above 4.5% in 2010 although it fell below 1.0% in 2011.
A number of countries have also targeted the overhead costs of administering the health care system. Although only accounting for around 3% of total health spending, there is wide variation in the costs associated and scope for improved efficiency measures. Figures from health accounts suggest that that there were significant reductions between 2009 and 2011. For example, spending on administration fell by 9% in real terms in the Czech Republic and Spain, and 11% in Greece.
Finally, spending on investment in infrastructure and equipment has also been significantly reduced in many countries. Figures for a group of 22 OECD countries for which data is available suggest that capital spending by government is only at the same level on average in 2011 (or 2010 in some cases) as it was in 2008. Ireland and Spain saw capital spending by public financing in 2011 at only around 50% of the level recorded in 2008.
Conclusion
Following the GFC, health spending slowed abruptly in 2010 and has since remained minimal after years of strong growth and an increasing share of GDP being accounted for by spending on health. However, there has been significant variation between OECD countries as to the extent of the slowdown.
The decrease in health spending growth has to a large extent been driven by reductions in public spending through the introduction of various measures or acceleration of reforms. There is some evidence of a shift to private financing of health care through cost-sharing measures although private spending has also seen slower growth since 2009. It appears that all main sectors of public spending on health have been reduced to varying degrees. Spending on pharmaceuticals and public health and prevention services has seen the greatest reductions on average.
Preliminary data for a number of OECD countries suggests that the trend in low spending growth overall is likely to have continued through 2012.
Acknowledgements
The authors thank colleagues from the OECD Health Division for their comments and suggestions.
Conflicts of Interest
All opinions are those of the authors alone, not those of the OECD nor of its Member countries.