The study of morphological disparity has become a powerful approach for exploring evolutionary and ecological dynamics through deep time. Disparity is typically quantified using empirical morphospaces constructed from geometric morphometric data or discrete morphological characters. In particular, morphometric-based approaches, such as landmark configurations and outline-based methods, have proven valuable for quantifying morphological responses to large-scale biotic and abiotic events (Foote Reference Foote1993a, Reference Foote1997; Roy & Foote Reference Roy and Foote1997; Neige Reference Neige2003; Benton Reference Benton2015; Maestri et al. Reference Maestri, Monteiro, Fornel, de Freitas and Patterson2018; Gonzalez et al. Reference Gonzalez, Bonfili, Vallejo Azar, Barbeito-Andres, Bernal and Perez2019; Jablonski Reference Jablonski2020). A common practice in such studies is to represent the overall morphology of organisms using a single anatomical structure. However, organisms are composed of multiple regions that are often functionally and developmentally distinct, and several studies have shown that morphospace patterns can vary depending on which structure is analysed (Foote Reference Foote1999; Oudot et al. Reference Oudot, Neige, Laffont, Navarro, Khaldi and Crônier2019; Cole & Hopkins Reference Cole and Hopkins2021; Suárez & Esteve Reference Suárez and Esteve2021; Holmes Reference Holmes2023; Serra et al. Reference Serra, Balseiro, Allaire and Waisfeld2025).
This raises an interesting question: do morphospaces derived from different morphological structures converge on a common pattern or instead reflect distinct biological signals? Trilobites provide an ideal model group to address this topic. Their segmented body plan comprises morpho-functionally distinct tagmata, which can be functionally or developmentally related, and offers a unique opportunity to compare morphospace patterns across different anatomical regions.
In recent years, several taxonomically comprehensive morphometric datasets have been developed for trilobites, spanning a range of anatomical structures and data acquisition methods. These datasets include Fourier cranidial outline (Foote Reference Foote1993a, Reference Foote1993b), cephalic outline based on semilandmarks (Suárez & Esteve Reference Suárez and Esteve2021; Drage & Pates Reference Drage and Pates2024), landmarks and semilandmark data on cephala and pygidia (Bault et al. Reference Bault, Crônier and Monnet2022; Serra et al. Reference Serra, Balseiro, Monnet, Randolfe, Bignon, Rustán, Bault, Muñoz, Vaccari, Martinetto, Crônier and Waisfeld2023a), as well as trilobite body linear morphometry (Drage Reference Drage2024). Studies comparing multiple anatomical regions in trilobites have revealed contrasting disparity patterns, further supporting the notion that different structures may play distinct functional and ecological roles (e.g., Oudot et al. Reference Oudot, Neige, Laffont, Navarro, Khaldi and Crônier2019; Suárez & Esteve Reference Suárez and Esteve2021; Bault et al. Reference Bault, Crônier and Monnet2022, Reference Bault, Crônier, Monnet, Balseiro, Serra, Waisfeld, Bignon and Rustán2023; Holmes Reference Holmes2023; Serra et al. Reference Serra, Balseiro, Allaire and Waisfeld2025).
A second important methodological question concerns the most effective approach and protocol to capture the highest morphological variability. This question, of course, depends on the clade under study. For trilobites in particular, a key consideration is whether the use of marginal outline-based cephalic or pygidial data is enough to capture most of the biologically relevant variation or, on the contrary, do we need to include landmarks and semilandmark configurations of internal morphological features? This question might seem trivial, but understanding those issues is of key relevance for constructing a taxonomically comprehensive dataset because any morphometric protocol for data acquisition is a trade-off between detail and effort. Another compromise we face is between the dataset’s taxonomic breadth and the level of morphological detail that can be represented. Because of these concessions, large taxonomically broad morphometric datasets in trilobites have usually focused on outlines, either of the cranidium (Foote Reference Foote1989, Reference Foote1993a) or the cephalon (Suárez & Esteve Reference Suárez and Esteve2021; Drage & Pates Reference Drage and Pates2024). While these datasets have proven to be useful for studies about the evolution and ecology of the group, other works have shown contrasting patterns between the outline and the internal structure of the cephalon (Bault et al. Reference Bault, Crônier and Monnet2022, Reference Bault, Crônier, Monnet, Balseiro, Serra, Waisfeld, Bignon and Rustán2023; Holmes Reference Holmes2023).
To address these questions, we analyse here the morphospace occupation of Silurian–Permian trilobites considering different landmark and/or semilandmark configurations of the cephala and pygidia (including both outline and internal structures). We aim to evaluate the amount and nature of morphological information provided by: (1) different trilobite tagmata; and (2) distinct data acquisition approaches, including complete landmark and outline-based configurations. By comparing the morphospaces generated through these structures and configurations, we aim to identify the most suitable combinations for addressing taxonomic, phylogenetic and ecological questions.
1. Material and methods
1.1. Data preparation
The analyses conducted here use and compare morphological data of the cephalon and pygidium of Silurian–Permian trilobites hosted in the latest release (version 1.2) of the TriloMorph database (Serra et al. Reference Serra, Balseiro, Monnet, Randolfe, Bignon, Rustán, Bault, Muñoz, Vaccari, Martinetto, Crônier and Waisfeld2023a), including most trilobite genera recorded in the Paleobiology Database (PBDB). Specimens selected for digitisation were compiled from the literature and belong to public collections with a unique repository code (see Serra et al. Reference Serra, Balseiro, Monnet, Randolfe, Bignon, Rustán, Bault, Muñoz, Vaccari, Martinetto, Crônier and Waisfeld2023a for a thorough description of the compilation of the database and TriloMorph for the full specimen list, raw morphometric data and references). A detailed analysis of the geographic coverage of TriloMorph has been shown by Serra et al. (Reference Serra, Balseiro, Monnet, Randolfe, Bignon, Rustán, Bault, Muñoz, Vaccari, Martinetto, Crônier and Waisfeld2023a). Because specimen sampling was originally designed to cover most genera present in the PBDB, the database has a bias towards the North American and European fossil record, but also records good coverage for North Africa, South America and Australia (Serra et al. Reference Serra, Balseiro, Monnet, Randolfe, Bignon, Rustán, Bault, Muñoz, Vaccari, Martinetto, Crônier and Waisfeld2023a). Landmarks and semilandmarks were placed on the dorsal right side of each structure. If the left side was more complete or better preserved, a mirror image of the left side was used. Specimens were landmarked following the TriloMorph template, which makes use of both fixed landmarks and semilandmarks (Serra et al. Reference Serra, Balseiro, Monnet, Randolfe, Bignon, Rustán, Bault, Muñoz, Vaccari, Martinetto, Crônier and Waisfeld2023a). This is the most complex template possible, representing a compromise between capturing the greatest morphological detail and applicability across most trilobite clades. Digitisation was conducted using the StereoMorph package (Olsen & Westneat Reference Olsen and Westneat2015) in R (R Core Team 2018).
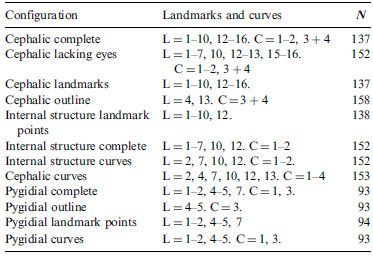
Starting from the TriloMorph template, and using a new modified version of the ‘shapFix’ R function available in TriloMorph, we tested a series of different configurations for both the cephalon and pygidium (see Figs 1, 2). The new ‘shapFix’ function allows a series of modifications of the TriloMorph landmark template, namely: (1) choosing between any given set of landmarks and curves; and (2) building a single cephalon outline curve joining curves C.3 (anterior margin) and C.4 (posterior margin). The different configurations used in this contribution are: (a) semilandmarks outline-based configurations; (b) landmark-only configurations (excluding semilandmarks); and (c) mixed configurations (combining landmarks and semilandmarks). Because the outline of the facial suture captures the eye features, the landmark-only configurations for both cephala and internal structures were analysed with landmarks that correspond to the eye structure (landmarks 8, 9 and 14). In this way, we can fairly compare the morphological information provided by both approaches.
Flow diagram illustrating the different stages of this work. (1) Reading the morphometric data included in TriloMorph. (2) Testing the different landmark protocols. (3) Performing GPA and PCA. (4) Performing a Procrustes superimposition analysis. (5) Evaluation through statistical analysis of the correlation between different morphospaces and the individual errors.

Cephalic and pygidial templates of landmarks and semilandmarks curves: (a, b) configuration from the TriloMorph database, modified from Serra et al. (Reference Serra, Balseiro, Monnet, Randolfe, Bignon, Rustán, Bault, Muñoz, Vaccari, Martinetto, Crônier and Waisfeld2023a); (c–n) configurations used in this analysis (illustrated on Cyphoproetus). For more information on the specific templates, see Table 1.

Landmarks and curves that were not consistently present or easily identifiable across all specimens were excluded. For the cephalic configurations, landmark 11 – i.e., the intersection between the posterior branch of the facial suture and the posterior or lateral border furrow – was excluded from all analyses. In the pygidium configurations, we removed landmarks 3 and 6 and consequently the curve delimited by them, which corresponds to the border furrow. No significant differences were detected using the revised configurations; however, a clear advantage was the notable increase in the number of specimens that could be included in the analyses.
A total of 12 different configurations were obtained (see Table 1; Fig. 2) and subsequently subjected to statistical analyses to evaluate significant differences among configurations (see Procrustes analysis and statistical comparison below).
List of configurations obtained with the number of fixed landmarks and curves included from the TriloMorph template (L = fixed landmarks; C = curves). Note that the semilandmark curves need the starting and ending landmark points. See Figure 2 for further comprehension. 3 + 4 refers to the single cephalon outline curve joining curves 3 and 4. The number of genera available for each analysis is also indicated (N).

1.2. Construction of the morphospace
For each (semi)landmark configuration, a Generalized Procrustes Analysis (GPA) was conducted to standardise configurations by removing non-shape variation. During this procedure, specimens were translated to a common origin, scaled to unit centroid size, and optimally rotated to minimise least-squares differences among corresponding points. Semilandmarks placed along curves were allowed to slide along their tangents to minimise Procrustes distance between specimens (Rohlf Reference Rohlf2010). The resulting aligned coordinates were stored as an object of class ‘gpagen’, which also includes associated metadata (centroid sizes, landmark groups and scales). Principal component analysis (PCA) was subsequently conducted on the aligned coordinates to identify the main axes of shape variation and construct the morphospace for each structure. GPA and PCA were carried out using the geomorph package (Adams et al. Reference Adams, Collyer, Kaliontzopoulou and Baken2022) in R (R Core Team 2018).
We compared the observed eigenvalues against expectations under a broken-stick model to evaluate the dimensionality of the morphospace. The model estimates the expected distribution of variance if it was randomly partitioned among all components (Legendre & Legendre Reference Legendre and Legendre2012). Therefore, it can be used as a reference for the number of axes that should be considered meaningful (Jackson Reference Jackson1993).
1.3. Procrustes analysis and statistical comparison
We compared the empirical morphospace for each configuration using a Procrustes analysis. The Procrustes superimposition approach is widely used in geometric morphometric analysis (see Rohlf & Slice Reference Rohlf and Slice1990; Bookstein Reference Bookstein1992 for reviews); however, it has also been applied to datasets with differing characteristics, such as morphological versus ecological features, and for comparing ecological ordinations (e.g., Legendre & Legendre Reference Legendre and Legendre2012; Balseiro & Waisfeld Reference Balseiro and Waisfeld2013). Procrustes superimposition allows for an assessment of the overall association between two ordination solutions (Gower Reference Gower, Hodson, Kendall and Tutu1971). To achieve an optimal superimposition that maximises alignment, one ordination is rotated, translated and scaled relative to the other, which serves as the reference (Gower Reference Gower, Hodson, Kendall and Tutu1971; Legendre & Legendre Reference Legendre and Legendre2012). The sum of squared errors between configurations in their optimal superimposition serves as a metric of association referred to as total squared Procrustes error [m12 2] (Gower Reference Gower, Hodson, Kendall and Tutu1971). Because Procrustes superimposition rescales configurations to minimise sum squared errors, it has the problem of not being symmetric. There is, however, an alternative for obtaining a symmetric solution – that yields symmetric errors – which consists of scaling both configurations to equal variances of 1, i.e., Gower’s standardisation (Legendre & Legendre Reference Legendre and Legendre2012). Based on this symmetric solution, a correlation-like statistic can be estimated as R = √(1 – m12²) and tested based on permutations (Peres-Neto & Jackson Reference Peres-Neto and Jackson2001).
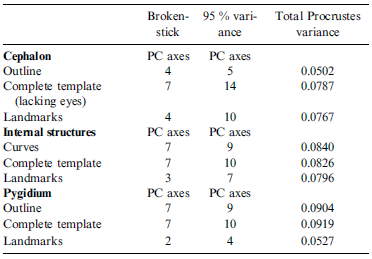
We used genera as the common reference for alignment of morphospaces. Because Procrustes comparisons require that ordinations include the same elements – since differences are calculated as squared distances between homologous points – only genera shared across configurations were included in the analysis. Furthermore, because the superimposition requires that both configurations have an equal number of dimensions, comparisons were restricted to the first ten principal components of each morphospace. This number of dimensions surpasses the number of significant PCA axes based on the broken-stick distribution for all configurations and accumulates more than 95 % of the variance in all but one case (Table 2).
Number of significant axes identified by comparing observed eigenvalues against expectations under a broken-stick model, number of principal components that accounted for 95 % of total shape variance for each morphospace, and total Procrustes variance calculated for each dataset after GPA (higher values indicate greater overall shape dispersion).

We examined individual Procrustes errors in the different superimpositions to recognise outliers that contributed the most to the differences between morphospaces. If the total squared Procrustes error between two configurations was concentrated in a few taxa, then those would be the main taxa responsible for the differences in alignment. We evaluated individual squared errors using two different approaches: (1) we first compared the distribution of squared errors against a broken-stick distribution. This distribution can be interpreted as the null expectancy for the partition of m12² among a given number of taxa where specimens exhibiting greater error are the most responsible for the total error in the alignment; (2) we also tested how well the empirical error distribution fit the Chi-squared (χ2) distribution, which is the expected distribution of squared Procrustes errors if they were randomly distributed both in size and direction (Dryden & Mardia Reference Dryden and Mardia2016). Observed empirical errors were compared to the expected distribution (broken-stick or χ2) using a Kolmogorov–Smirnov test (Sokal & Rohlf Reference Sokal and Rohlf1995). We also identified outliers as those taxa that have an error higher than the expected 95 % confidence interval based on the χ2 distribution. It is important to note that the analysis based on the χ2 is statistically more stringent than the broken-stick. However, if the total sum of squared errors is relatively high (i.e., low Procrustes correlation), the distribution of errors will probably differ from the χ2, regardless of being relatively random. Hence, we tested using both the χ2 and the broken-stick distributions.
We also analysed the correlation between different morphospaces using the Mantel test (Legendre & Legendre Reference Legendre and Legendre2012). While the Procrustes test directly evaluates the correlation between superimposed morphospaces, the Mantel test analyses the correlation between pairwise distances. The Mantel test has the advantage of not having a limit on dimensionality. Mantel tests were performed using the Pearson’s correlation on the Euclidean distance matrices obtained from the morphospaces using the number of dimensions that accumulate 95 % of the total variance.
Symmetric Procrustes analyses were conducted using the ‘procrustes’ function from the vegan package in R (Oksanen et al. Reference Oksanen, Blanchet, Friendly, Kindt, Legendre, McGlinn, Minchin, O’Hara, Simpson, Solymos, Stevens, Szoecs and Wagner2019). We evaluated the statistical significance of the correlation between ordinations by means of Procrustes rotation tests and Mantel test using the ‘protest’ and ‘mantel’ functions from the vegan package, respectively. We used 5,000 permutations to assess statistical significance. Broken-stick and χ2 distributions for individual errors analysis were calculated using the ‘drbs’ function from the sads package (Prado et al. Reference Prado, Miranda and Chalom2024) and the ‘qchisq’ function for R (R Core Team 2018). Please refer to the supplementary material available at https://doi.org/10.1017/S1755691025100996 for further implementation details.
Because we seek to evaluate the amount and type of morphological information captured by each structure and by different configurations for data acquisition, we compared cephala and pygidia morphospaces and also morphospaces obtained using different landmark configurations. Specifically, we compared the following configurations: (a) complete cephalic template versus cephalic template lacking eyes; (b) cephalic template lacking eyes versus cephalic outline; (c) internal cephalic structures complete template versus cephalic outline; (d) cephalic curves versus cephalic landmarks (LMs); (e) cephalic template lacking eyes versus complete pygidial template; (f) cephalic anterior margin versus pygidial margin; (g) cephalic outline versus pygidial outline; and (h) pygidial curves versus pygidial LMs.
2. Results
There is substantial variation in both the amount of variance captured by different morpho-functional structures and landmarking configurations and the overall dispersion of data points across morphospaces (Table 2; Fig. 3). The number of principal components (PC) required to explain the structure of morphospaces varied notably depending on the analysed configurations and structures. Interestingly, for the cephalon, the outline-only template accounted for 95 % of the total shape variance within the first five axes, whereas the complete template required 14 axes to reach the same threshold. Similarly, the broken-stick approach identified four significant axes for the outline and seven for the complete template. These results suggest that the cephalic outline captures a simpler morphospace, while the complete template that includes the internal structures and substructures yields a more complex and detailed morphospace. This pattern is reinforced by the analysis of internal cephalic substructures, such as glabellar and facial suture semilandmarks and internal landmarks, which also required more dimensionality to summarise shape variability.
Empirical morphospaces of the cephalon and pygidium, analysed under three general landmarking templates: complete template (including fixed and semilandmarks); outline-based semilandmarks; and fixed landmarks template. Each plot represents variation along the first two principal components (PC1 and PC2), with axis labels indicating the percentage of total shape variance explained; the number of genera in each analysis is indicated (N). Morphospaces are coloured by template type: blue for complete templates, orange for outlines and green for LM templates.

For the pygidium, the complete and outline-based morphospaces are substantially more complex than the landmark-only morphospace. This is probably due to the high morphological diversity along the margin, considering a variety of spines that are effectively captured by the outline semilandmarks but otherwise underestimated by the landmark-only approach.
2.1. Correlation between morphospaces
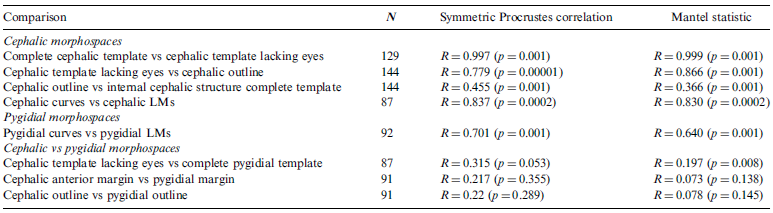
Morphospaces derived from different cephalic configurations exhibited varying degrees of Procrustes correlation. Interestingly, the complete cephalic template aligned almost perfectly with the template excluding eye landmarks (landmarks 8, 9 and 14; see templates in Fig. 2c, d), having a Procrustes correlation of 0.99 (Table 3). Given this significantly high correlation, we use the cephalic template lacking eye landmarks for all subsequent analyses that involve the cephalon. This way, we can include blind trilobites, thereby increasing sample size and enhancing taxonomic coverage.
Results of the different Procrustes correlation tests. The number of genera compared in each analysis (N) is also indicated.

The optimal superimposition derived from the complete and outline-based approaches shows significantly high correlation (Table 3), suggesting that the cephalic outline alone captures a considerable amount of shape variation. However, the Procrustes correlation between cephalic outline and internal structures is significantly lower (Fig. 4; Table 3). This indicates that the cephalic outline does not capture all the information obtained by the internal structures. Cephalic morphospaces are poorly aligned with pygidial ones (Table 3), whether comparing complete templates or only outlines. Even when the cephalic outlines were analysed excluding the genal spines, the correlation with pygidial outline remained equally low, indicating that neither structure could be used as a proxy to measure shape variation in the other.
(a) Empirical morphospace of cephalic outline. (b) Empirical morphospace of internal cephalic structures (including semilandmark curves of the glabella and facial suture, and landmarks 1–7, 10 and 12). Note that for the outline, PC1 and PC2 explain 86.87 % of the total shape variance, whereas for the internal cephalic structures, they explain 54.83 %. (c) Procrustes superimposition space of cephalic outline (target configuration in orange) and internal structures (rotated configuration in blue).

The distributions of individual errors in the cephalon–pygidium superimposition and the cephalic margin–cephalic internal structures superimposition, respectively, do not differ from those expected by chance (Fig. 5). Individual errors in the cephalon–pygidium superimposition are consistent with both the χ2 and broken-stick distributions (Fig. 5a). Nevertheless, certain taxa can be identified as outliers, exhibiting larger errors than expected by the χ2 distribution, namely Eskoharpes, Kolihapeltis, Hadromeros, Australoscutellum and Ceratarges (Fig. 5a). On the other hand, errors from the cephalic outline–internal structure superimposition show a significant deviation from the χ2 distribution but a strikingly good fit to the broken-stick distribution (Fig. 5b). These contrasting results suggest that the low fit between the two morphospaces is causing high errors that differ from the χ2 distribution. However, the errors are very similar to the expected random broken-stick distribution, and therefore we cannot assure that errors are strictly non-random. Twelve taxa stand out as outliers based on the χ2 distribution: Odontopleura, Deiphon, Kayserops, Ceratarges, Sphaerocoryphe, Koneprusia, Kolihapeltis, Psychopyge, Echinophacops, Cordania, Chlupaciparia and Primaspis (Fig. 5b). These outliers suggest that marginal and genal spines and glabellar morphology are the main structures causing the low correlation between morphospaces. All genera are known to be highly spinous and/or with significant genal spines. Regarding the glabellar morphology, two notable examples are Sphaerocoryphe and Deiphon, members of the subfamily Deiphoninae within the Cheiruridae. These taxa bear globular glabellar frontal lobes, which cannot be captured otherwise by the cephalic outline alone, therefore causing high discrepancy in their position between morphospaces.
Comparison between empirical errors and expected distributions (broken-stick and χ2). (a) Comparison with the cephalic template versus complete pygidial template. (b) Comparison with the cephalic outline versus internal cephalic structure complete template. D and p are Kolmogorov–Smirnov statistic and p-value respectively. Red dots are outliers identified using the χ2 distribution.

3. Discussion
3.1. Biological significance
A major goal in morphological evolution and disparity studies is to identify anatomical features that effectively capture biologically meaningful variation. In some cases, if not all, these anatomical objects may comprise multiple structures (Collyer et al. Reference Collyer, Davis and Adams2020; Cole & Hopkins Reference Cole and Hopkins2021) that can be functionally or developmentally integrated (Klingenberg Reference Klingenberg2010). If these structures were tightly integrated, changes in one structure should be accompanied by changes in the other, causing both morphospaces to be relatively similar. This could be the case for the pygidium and cephalic morphospace because both structures should be functionally integrated through enrolment (Suárez & Esteve Reference Suárez and Esteve2021). In particular, Suárez & Esteve (Reference Suárez and Esteve2021) have shown that spheroidal enrolment might have constrained the morphological disparity of the cephalon due to the mechanical limitations imposed by this strategy. Because spheroidal enrolment was the most common type during the Silurian–Permian (Suárez & Esteve Reference Suárez and Esteve2021), our results should reflect such constraints as a highly correlated cephalon–pygidium superimposition. Extreme cases of discrepancy should be associated with other types of enrolment, such as cylindrical or discoidal types, because these enrolment types are associated with the absence of interlocking devices and fewer constraints for the development of marginal spines or other cephalic modifications (Yuan & Esteve Reference Yuan and Esteve2015; Suárez & Esteve Reference Suárez and Esteve2021). Our results indicate that cephala and pygidia morphospaces are poorly aligned, even considering only the outline, despite the dominance of spheroidal enrolment. This suggests that cephala and pygidia were not tightly functionally integrated, or at least that similar cephalic morphologies could function with a larger variety of pygidia than expected. While the genus recording the largest Procrustes error (Eskoharpes) probably exhibited discoidal enrolment (Suárez & Esteve Reference Suárez and Esteve2021), most outliers had spheroidal enrolment (Hadromeros and some styginids, e.g., Suárez & Esteve Reference Suárez and Esteve2021), suggesting that the presence of coaptive devices did not necessarily limit cephalic or pygidial morphological flexibility (Hopkins Reference Hopkins2022).
The cephalon has traditionally been the preferred structure for estimating disparity in trilobites as it is functionally critical – including sensory organs, feeding structures, coaptive structures for enrolment, facial sutures and other moulting structures – allowing inferences about the group’s ecology (Fortey & Owens Reference Fortey and Owens1999; Suárez & Esteve Reference Suárez and Esteve2021; Drage & Pates Reference Drage and Pates2025). Morphospace-based approaches have been increasingly applied to address ecological questions in trilobites, such as the role of niche partitioning in community restructuring (Serra et al. Reference Serra, Balseiro and Waisfeld2023b) or behavioural implications such as enrolment and moulting (Suárez & Esteve Reference Suárez and Esteve2021; Esteve & Suárez Reference Esteve and Suárez2023; Drage Reference Drage2024; Drage & Pates Reference Drage and Pates2025). However, we still know little about how different structures reflect all these ecological functions, or at least if all cephalic structures were somehow functionally integrated. Again, if such integration existed, we would have found a high correlation between the cephalic margin morphospace and that of the internal structures. This, however, was not observed, underscoring little integration between structures, something already noted by Holmes (Reference Holmes2023) for Cambrian trilobites. Our findings for Silurian–Permian trilobites further coincide with those described by Holmes (Reference Holmes2023) in that marginal outline – particularly the genal spine – recorded the highest variability within the cephalon. Although larger, morphological variability of the cephalic margin is simpler (as measured by dimensionality) than that of internal structures. This highlights that while the cephalic margin can capture much of the total cephalic disparity, it is still a restricted perspective since it does not fully capture the whole complexity of the cephalic morphology, most of which varies independently of the margin.
Previous works have suggested a lack or limited predictive ability of cephalon-based morphometric analysis (e.g., Drage & Pates Reference Drage and Pates2025). Our findings are partially consistent with this observation but further indicate that such absence of association is not inherent to the cephalon itself but rather reflects the scope of morphological data included. The lack of covariation between the analysed structures underscores the need for carefully selecting the morphological configurations that best match the biological or functional questions being addressed. Analyses based solely on the external outline inevitably omit internal characters – such as facial sutures and, for example, other moulting-related structures – that are both functionally and behaviourally significant. This limitation is particularly relevant for ecological questions where the chosen morphological traits determine the type of biological signal captured. Outlines, for example, will most probably emphasise marginal features more related to enrolment (Suárez & Esteve Reference Suárez and Esteve2021) and defence (Pates & Bicknell Reference Pates and Bicknell2019), whereas internal characters would be more directly linked to feeding (Eldredge Reference Eldredge1971) and moulting (Esteve et al. Reference Esteve, Marcé-Nogué, Pérez-Peris and Rayfield2021).
By integrating internal structures with outline data, we obtain a more comprehensive representation of cephalic and pygidial morphologies, which can reveal behavioural associations that remain undetectable when considering outline shape alone. Moreover, the availability of different landmark configurations allows for a more accurate morphological analysis aligned with the biological function under study.
3.2. Methodological discussion
The main goal of any disparity analysis is to quantify patterns of morphological variation and to evaluate these patterns across taxa, structures or evolutionary time. Achieving this goal requires as much appropriate morphological information as possible. However, it is not always feasible to represent this, particularly on taxonomically broad scale analyses. In addition to these constraints, considerable labour and computational effort are required to adequately represent such information. Rather than offering a means to simplify protocols in a large-scale study of trilobite disparity, our findings emphasise the need to expand and improve methods for analysing morphology as a whole.
In our case study, although the different structures analysed are not strictly functionally independent, the morphological information they provide is uncorrelated, emphasising the importance of incorporating as much morphological data as possible, including different tagmata and both outline and internal features, to further understand the full range of trilobite morphological diversity. This does not invalidate that a less comprehensive analysis could still reveal meaningful relationships within a particular structure and support certain inferences. For example, previous studies have shown that both cranidia and cephalic outline can yield valuable insights about the ecology of the group (Foote Reference Foote1990; Hopkins Reference Hopkins2014; Serra et al. Reference Serra, Balseiro and Waisfeld2023b; Drage & Pates Reference Drage and Pates2024).
The high correlation between the complete cephalon template and the cephalic outline could be interpreted as a reason for analysing the cephalic margin morphospace rather than the one considering the complete template. However, as mentioned previously, the cephalic margin offers a limited perspective on whole cephalic morphological diversity. Similarly, although the comparisons between landmark and curves configurations are highly correlated, the landmark template recorded much lower dimensionality, indicating a potential oversimplification of the morphospace. This is especially evident in the analysis of the pygidium, possibly because the landmark template includes few landmarks representing the margin, which arguably includes the greatest morphological variability related to the presence of spines or other modifications. For these reasons, the exclusive use of landmarks, although it may allow similar results, overlooks more variability than a configuration that incorporates semilandmark curves. Curves need relatively little computational and human effort and, more significantly, we should aim to collect the majority of biological information rather than restricting the representation of morphology to measurements and landmarks that do not capture the majority of this data (Goswami et al. Reference Goswami, Watanabe, Felice, Bardua, Fabre and Polly2019).
A different scenario is present when evaluating the trade-off between taxonomic broadness and morphological data. In this case, limiting the number of structures might be a reasonable decision. For the evaluated configurations, our results again support the inclusion of curves. This is partly due to the fact that most of the fixed landmarks in both the cephalon and pygidium are already integrated within the curves and are likely to be represented in the analyses. This is particularly evidenced in our tests removing eye-related landmarks. The lack of information loss when these landmarks are excluded confirms that the facial suture curve alone is sufficient to capture this trait. In practical terms, incorporating curves provides a reasonably complete representation of morphological variation while allowing for the integration of blind trilobites into the analyses.
Finally, our analysis also allows us to answer a final question. Does disparity estimated using a single tagma (cephalon or pygidium) give a confident sample of trilobite morphological complexity? The answer is, unfortunately, that they don’t, and therefore that we still need to consider different aspects of the trilobite body to actually understand their morphological diversity. Unfortunately, no current method allows a complete and resourceful way of measuring total disparity, as all available approaches designed to integrate different structures simultaneously have their limitations (Collyer et al. Reference Collyer, Davis and Adams2020). Therefore, advancing the development of such methodologies in the future will be essential for achieving a more robust and comprehensive understanding of trilobite disparity.
4. Supplementary material
Supplementary material is available online at https://doi.org/10.1017/S1755691025100996.
5. Data availability statement
The data used for the present analysis corresponds to the latest stable release of TriloMorph (v1.2), available at https://doi.org/10.5281/zenodo.8033444.
6. Acknowledgements
We thank the reviewers James D. Holmes and Jorge Esteve for their valuable suggestions that improved this contribution. We also acknowledge supporting facilities of the Consejo Nacional de Investigaciones Científicas y Técnicas (CONICET–CICTERRA) and the Universidad Nacional de Córdoba. Financial support for this study was further provided by the [CONICET PIP 202111220200103192] to B.G.W. and D.B., [PICT-2021-I-A-00968] to D.B. and the Synthesys + Project (Transnational Access) and the Paleontological Society (Sepkoski Award) to E.A.R.
7. Competing interests
The authors declare there are no competing interests.