Introduction
Research has suggested that excessive Internet use could lead to harmful consequences, resulting in a behavioral addiction.Reference Young 1 – Reference Shaw and Black 3 Internet addiction consists of a heterogeneous spectrum of Internet activities, such as gaming, shopping, gambling, and social networking,Reference Kuss and Griffiths 4 though gaming appears to be the most widely studied form of Internet addiction.Reference Kuss and Griffiths 5 Internet gaming disorder (IGD), which has been labeled as a behavioral addiction,Reference Kuss and Griffiths 5 is often defined as an excessive or uncontrolled use of Internet gaming followed by negative consequences.Reference Young 6 Considering substance abuse and addictive disorder, the committee of the fifth edition of the Diagnostic and Statistical Manual of Mental Disorders (DSM-5) generated criteria for IGD and included it in the section of disorders that warrant additional study.Reference Petry and O’Brien 7 , Reference Regier, Kuhl and Kupfer 8
Substance abuse and addiction are commonly associated with enhanced reactivity to substance-related cues, which are often followed by addiction relapse.Reference Marissen, Franken, Waters, Blanken, Van Den Brink and Hendriks 9 Evidence suggests that attentional bias is a key cognitive process involved in cue reactivity, specifically the tendency in substance-dependence patients to automatically allocate and maintain attention to conditioned drug cues .Reference Field and Cox 10 Attentional bias has consistently been found in various types of addiction cues,Reference Franken 11 , Reference Robbins and Ehrman 12 including Internet gaming-related cues.Reference Van Holst, Lemmens, Valkenburg, Peter, Veltman and Goudriaan 13 , Reference Dong, Wang, Du and Potenza 14 People with IGD have been found to show attentional bias using various tasks and materials.Reference Amin, Todd and Canli 15 – Reference Metcalf and Pammer 17 For people with IGD, Internet gaming cues are extremely salient. These cues become the focus of attention and elicit cravings for Internet games. Previous studies have shown that attentional bias has been linked to abnormal activity in the frontal cortex, the parietal cortex, the cingulate cortex, and the insula,Reference Franken 11 , Reference Ko, Liu and Hsiao 18 , Reference Wilson, Sayette and Fiez 19 which are brain regions involved in executive functions (executive control processes) such as cognitive control (error monitoring and error awareness) and response inhibition.Reference Miyake, Friedman, Emerson, Witzki and Howerter 20
Previous findings have used general linear modeling (GLM) to analyze the time series of blood oxygen–level-dependent signals, which is a well-known index for exploring brain responses during a task. However, there are 2 limitations for GLM: first, it requires an experimental design matrix, and second, it cannot identify one brain region that is functionally connected to another.Reference Kim, Manoach and Mathalon 21 , Reference Specht and Laeng 22 Thus, in the present study, we applied a new blind-source separation technique called independent component analysis (ICA) to identify distinct groups of brain regions with the same temporal pattern of homodynamic signal change, which does not rely on any prior information about the temporal response (ie, experimental design matrix). In contrast to the local regions identified in previous studies on attentional bias of addiction, the present study was designed to characterize networks of functional connectivity and to compare the differences between IGD subjects and a healthy control (HC) group during an addiction Stroop task by employing ICA.
Previous neuroimaging studies of the Stroop task have demonstrated that parietal activity contributes to focused attention on the semantic rather than the color of the gaming-related cues, which results in longer reaction time toward gaming-related words compared to neutral ones.Reference Chen, Lei, Ding, Li and Chen 23 , Reference Van and Carter 24 . The dorsolateral prefrontal cortex plays a role in attentional bias for gaming-related stimuli as well; it involves in salience attribution and top-down attention.Reference Kane and Engle 25 Thus, we expected that ICA would capture activity in those areas involved in attentional bias (eg, the frontal cortex, the parietal cortex, and the insula). Specifically, researchers have demonstrated that, compared with the HC group, IGD subjects showed impairment in cognitive control ability while dealing with gaming-related words.Reference Dong, Zhou and Zhao 26 A cognitive-behavioral model for conceptualizing IGD has been proposed recently. It focuses on 3 domains, including reward-seeking, decision-making, and behavioral control relating to executive inhibition.Reference Dong and Potenza 27 In addition, reduced executive control tendencies or abilities have been demonstrated in subjects with IGD as compared to HC, and the Stroop task challenged the brain systems that are involved in executive function.Reference Field and Cox 10 , Reference MacLeod 28 – Reference Peterson, Skudlarski, Gatenby, Zhang, Anderson and Gore 30 Therefore, we hypothesized that the functional connectivity related to the executive control network will be altered in IGD subjects during the addiction Stroop task.
Method
Participants
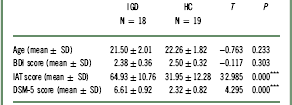
This study was approved by the Human Investigations Committee of Zhejiang Normal University. A total of 18 IGD subjects and 19 HC subjects participated in our study. All participants were university students recruited through advertisements, and all were right-handed males with no difficulty in naming color. All participants provided written informed consent before their formal scans. These 2 groups did not significantly differ in age or BDI (Beck Depression Inventory) scores (Table 1). Only males were included due to the higher prevalence of IGD in men than in women.Reference Adiele and Olatokun 31 All participants were free from any psychiatric/neurological disorders, eg, anxiety, schizophrenia, depression, or nd substance dependence, which were assessed by the structured psychiatric interviews (MINI).Reference Lecrubier, Sheehan and Weiller 32 All participants reported no previous or current experience with gambling or illegal drugs (eg, heroin, marijuana) or any type of other addictions (ie, alcohol, nicotine) as assessed by the DSM-5 criteria for substance dependence. In addition, the IGD subjects all reported themselves to be familiar with the Internet game named DOTA (Defense of the Ancients; http://www.dota2.com.cn/main.htm). All participants were medication-free, and were instructed not to use any substances of abuse, including coffee, on the day of scanning.
Demographic information and group differences

IGD=Internet gaming disorder; HC=healthy controls; BDI=Beck Depression Inventory; IAT=Internet Addiction Test; DSM-5=Diagnostic and Statistical Manual of Mental Disorders, Fifth Edition.
***p< 0.001.
The IGD subjects were diagnosed by Young’s online Internet addiction test (IAT),Reference Young 6 as well as using the 9 DSM-5 criteria for IGD.Reference Petry, Rehbein and Gentile 33 Young’s IAT was proved to be a valid and reliable instrument that can be used in classifying Internet addiction disorder (IAD).Reference Widyanto and Griffiths 34 For each item, a graded response is selected from 1=“Rarely” to 5=“Always,” or respondents can choose “Does not Apply.” Scores over 50 indicate occasional or frequent Internet-related problems and scores over 80 mean “Your Internet usage is causing significant problems in your life.” Thus, the selection of IGD participants in the present study was based on IATReference Young 6 scores of 50 or higher.Reference Petry and O’Brien 7 , Reference Regier, Kuhl and Kupfer 8 , Reference Wang, Wu and Zhou 35 – Reference Lin, Dong, Wang and Du 39 To classify IGD, individuals with IAD also needed to respond positively to the following statement: “You spend most of your online time playing online games (>80%) (Yes, No).” Those who answered “yes” were classified in the IGD group. Then, subjects who met 5 or more DSM-5 criteria of IGD were regarded as IGD. In the current study, the IGD group had much higher IAT scores and DSM scores than the HC group (Table 1).
Task and procedure
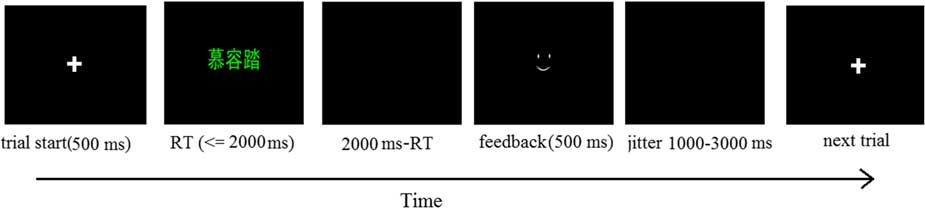
An addiction Stroop task consisting of 120 trials was administered in an event-related design. Figure 1 shows the timeline of 1 trial in the task. In each trial, after presenting a cross in the center of the screen as fixation point for 500 ms, a single word is presented in a single font color (red, yellow, or green). The participant is instructed to name the color as quickly and accurately as possible using 3 buttons (ie, green=thumb, red=index finger, yellow=middle finger) on a 3-button response box (Invivo, Gainesville, FL, USA). The stimuli disappear once the participant presses the button. The response time (RT) plus the duration of the following black screen are 2000 ms in total. Then a feedback screen appears for 500 ms. A correct response displays a smiley face and an incorrect response displays a frown face. A black screen is presented for a random interval of 1000–3000 ms (average 2000 ms) between trials. In our study, stimuli were presented and behavioral data were collected using E-prime software (Psychology Software Tool, Pittsburgh, PA, USA). All participants were provided with a sample of the task before the functional magnetic resonance imaging (fMRI) scan. Each participant received 20 Yuan (about 4 dollars).
The timeline of one trial in the addiction Stroop task. “慕容踏” in the second picture is a figure name in the online game DOTA.

Two kinds of words were shown to participants: Internet gaming-related and matched control words (matched in terms of semantic properties that affect reading speed, including word length and number of syllables per word). The words were randomly displayed in red, green, and yellow. The gaming-related words were selected from items in the popular online game DOTA, such as weapons, characters, and tips. The neutral words came from names of common tools, supplies, etc., and were matched with the categories of gaming-related words. All words were familiar to participants.
Image acquisition and preprocessing
Structural images covering the whole brain were collected using a T1-weighted, 3-dimensional, spoiled gradient-recalled sequence (176 slices, TR=1700 ms, TE=3.93 ms, slice thickness=1.0 mm, skip=0 mm, flip angle=15°, inversion time 1100 ms, field of view=240×240 mm, in-plane resolution=256×256). fMRI was performed on a 3 T scanner (Siemens Trio) with a gradient-echo EPI T2 sensitive pulse sequence in 33 slices (interleaved sequence, 3 mm thickness, TR=2000 ms, TE=30 ms, flip angle 90°, field of view 220×220 mm2, matrix 64×64). Stimuli were presented using an Invivo synchronous system through a screen in the head coil, which enabled participants to view the stimuli.Reference Dong, Shen, Huang and Du 40
The fMRI data were pre-processed in SPM8 (Statistical Parametric Mapping, http://www.fil.ion.ucl.ac.uk/spm). First, a slice-timing correcting was performed on the images to correct the errors related to the temporal variability in the acquisition of the fMRI datasets. Then, they were reoriented and realigned to the first scan. The default SPM8 setting was used to warp the mean functional image to fit a standardized template (16 nonlinear iterations). Normalized images were re-sampled into 3×3×3 mm voxels. Finally, images were smoothed with a 6-mm full width at half maximum Gaussian kernel. No participant was removed because of exceeding head motion coefficients than 2.5 mm and 2.5 degrees.
Independent component analysis
In order to identify spatially independent and temporally coherent networks for all participants at once, the preprocessed fMRI data were subjected to a group ICA algorithm using the infomax algorithmReference Beckmann, DeLuca, Devlin and Smith 41 within the GIFT toolbox (http://icab.sourceforge.net). The default number the ICA used to split the fMRI datasets into a final set of spatially independent functional networks was 20. Data were first prewhitened and dimensions reduced via a 2-step principal component analysis.Reference Calhoun, Adalı, Pearlson and Pekar 42 A spatial ICA was performed on these data using the infomax algorithm, and robustness of the component was achieved by running ICASSOReference Himberg, Hyvärinen and Esposito 43 (http://www.cis.hut.fi/projects/ica/icasso) for 100 iterations. In total, 20 components were estimated, where each independent component (IC) depicted a distinct network of brain regions that have the same pattern of homodynamic change over time.
Component selection
The ICA components of interest were selected in 2 stages. First, components that showed a relatively high spatial correlation with white matter and cerebral spinal fluid (CSF) or low spatial correlation with gray matter were most likely artifactual and could be discarded from the analysis. To accomplish this, we correlated each ICA component spatial map with prior probabilistic maps of gray matter, white matter, and CSF within a standardized brain space provided by the MNI templates in SPM8. This approach has been utilized in previous studies of fMRI with ICA.Reference Stevens, Kiehl, Pearlson and Calhoun 44 If the spatial correlation for white matter or CSF was greater than r2=0.025 or smaller than r2=0.025 for gray matter, then the component would not be considered to be a meaningful activation and would be discarded.
Components that survived the first criterion were then subjected to the second stage. To determine the relationship between the ICs and the experimental paradigm, a regression was performed on the ICA time courses with the GLM design matrix. For each subject, linear regression of the task design (gaming-related words and neutral ones) was convolved with the SPM homodynamic response function and was controlled for 6 directions of head motion with SPM8. In other words, we were interested in components that were highly correlated with the experimental design. The regression resulted in a set of beta weights for every experimental repressor associated with the GLM design matrix. The beta weights represented the degree to which a given component was modulated by the task relative to the fixation baseline. A high beta weight then represented a large task-related modulated for a given regressor within that component. We then tested the significant level of beta weights for each remaining component under each condition. For our purpose, the beta weights associated with the deviant conditions (gaming-related words) for each component underwent a one-sample t test (P<0.05, FDR corrected) for the IGD subjects and the HC group separately. If this distribution was significant for either the IGD subjects or the HC group, it indicated that there was a meaningful relationship between the experimental task and the time course of the component. If a component failed to show a significant relationship for this condition, it was considered to be non–task-related and was discarded.
Between-group comparison of ICA components
All group analyses were performed on ICs that survived through our selection criteria. Since the units that result from ICA analysis were arbitrary, they needed to be calibrated to reflect meaningful signal change. In this study, the ICA time courses and spatial maps were calibrated using z-scores.Reference Beckmann, DeLuca, Devlin and Smith 41 Therefore, first these maps were z-transformed to improve normality. Second, voxel-wise 1-sample t-tests and a 2-sample t-test were performed to explore the ICs within and between the 2 groups using GIFT. For each component, the 1-sample t-tests were performed among the IGD subjects and HC group separately against zero. For the 2-sample t-test, the surviving ICs were entered into a group-level 2-sample t-test [P<0.05, FWE cluster level correction (AlphaSim)], compared between the 2 groups, with voxels compared separately for each component. Visualization figure was performed using GroupICATv3.0a component viewer (http://mialab.mrn.org/software/gift/index.html) and NeuroElf_v09c (neuroelf.net).
Results
Behavioral performance
Analyses of variance (ANOVA) were performed to test the group differences. First we performed a 2-way repeated-measure ANOVA on RT with group (IGD and HC) as a between-subject variable and word type (gaming-related words versus neutral words) as a within-subject variable. This analysis revealed a main effect of the word [F (1, 38)=4.558, p=0.039, partial ῃ2=0.107] with the mean RT of gaming-related words being slower compared to neutral words for all participants grouped together. The interaction effect was not significant [F (1, 38)=0.432, p=0.515, partial ῃ2=0.011]. Although IGD subjects showed longer RT than the HC group, it did not reach statistical significance [F (1, 38)=1.527, p=0.224, partial ῃ2=0.039].
Independent components
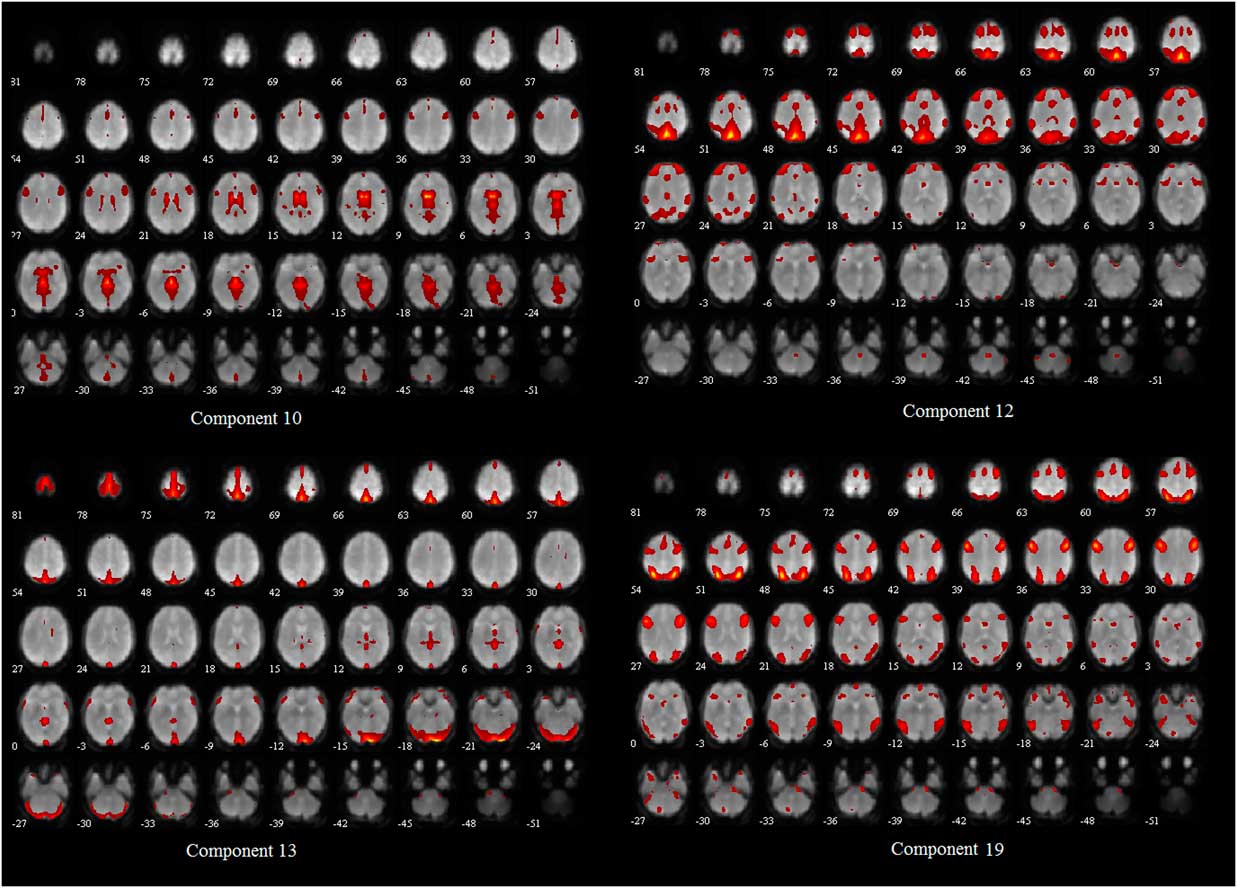
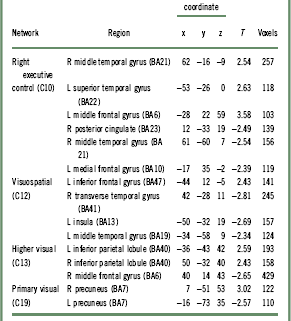
Of the 20 components obtained by the GIFT, 4 components were identified that satisfied our selection criteria (IC10, IC12, IC13, and IC19) (Figure 2) and were interpreted as meaningful neural network components. To identify which network the 4 components belonged to, we used a linear template-matching procedure that involved taking the average z-score of voxels falling within the template minus the average z-score outside the template and then selecting the component in which this difference (the goodness-of-fit) was the greatest.Reference Greicius, Flores and Menon 45 Component 10 consisted of the superior temporal gyrus (STG), the middle temporal gyrus (MTG), the middle frontal gyrus (MFG), and the posterior cingulate as being involved in the right executive control network. The other 3 components were linked to visual-related networks. Component 12 was consistent with the visuospatial network, including the inferior frontal gyrus (IFG), the MFG, and the insula. Component 13 consisted of the inferior parietal lobule (IPL) and the MFG, which are involved in the higher visual network. Component 19 consisted of the left and right precuneus, which are related to the primary visual network.
Illustration of four task-related independent components (ICs) identified in the analysis. There are 4 separated maps showing the brain regions included in each component (IC10, IC12, IC13, and IC19), thresholded at p<0.05 FDR corrected. A detailed list of what brain areas comprise each component is listed in Table 2, along with a color key identifying each.

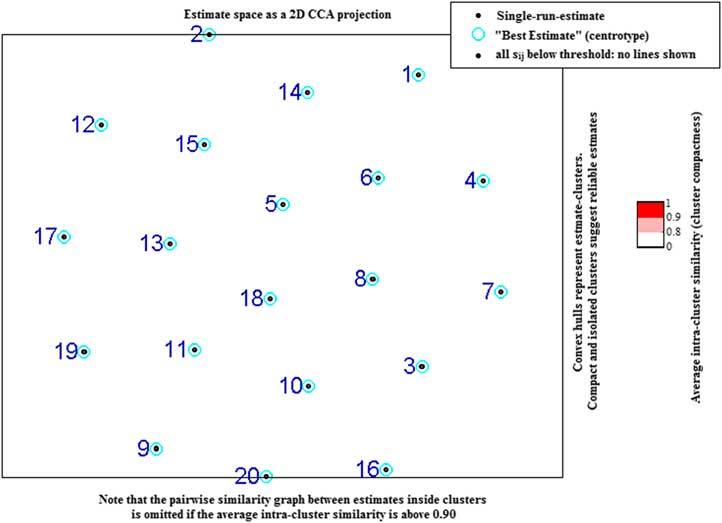
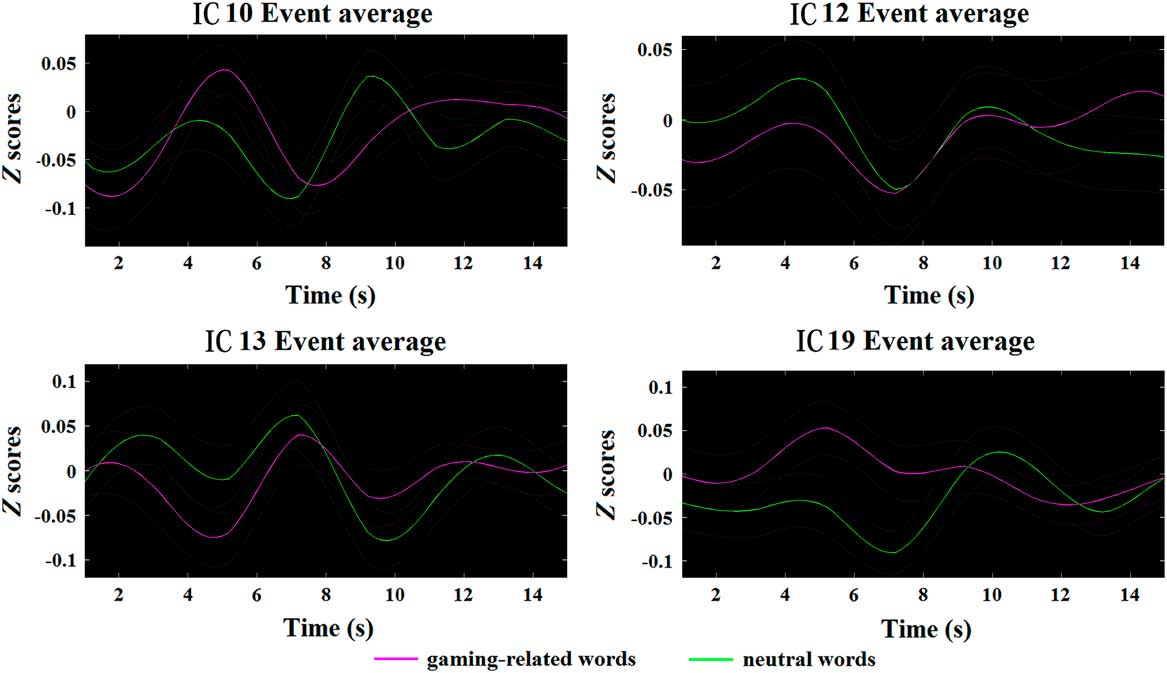
As mentioned before, these selection criteria consisted of removing components that represented noise or artifactual activation, followed by a 1-sample t-test (P<0.05, FDR corrected) for IGD subjects and the HC group separately (Table 2). Our results from running ICASSO in GIFT showed that the components all showed spatial variability between each iteration of the ICA analysis (Figure 3). The selected ICs and their associated event-related averages are represented as either positively modulated or negatively modulated with the task, which refers to the general direction of the ICA time course (Figure 4). The task-related average for almost all of the components showed peak amplitudes around 5 s after the onset of the stimuli.
Results from the group-level ICASSO implemented in the GIFT toolbox. The 2D clustered representation of the estimated components. Clustering is based on the similarity between the components; the 2D projection is based on the Euclidean distance as a metric of the dissimilarity between the components.

Event-related averages and beta weights for each of the 4 independent components (ICs) (IC10, IC12, IC13, and IC19) are plotted with separate time courses for gaming-related words (red) and neural ones (green dots).

Components that showed significant differences in 1-sample t testsFootnote *

Neutral=neutral words; gaming-related=gaming-related words; IGD=participants with Internet gaming disorder; HC=healthy controls; IC=independent component.
* Components that showed 1-sample significant with the task for either IGD subject or HC group were pursued for further analysis (P<0.05, FDR corrected).
Group differences
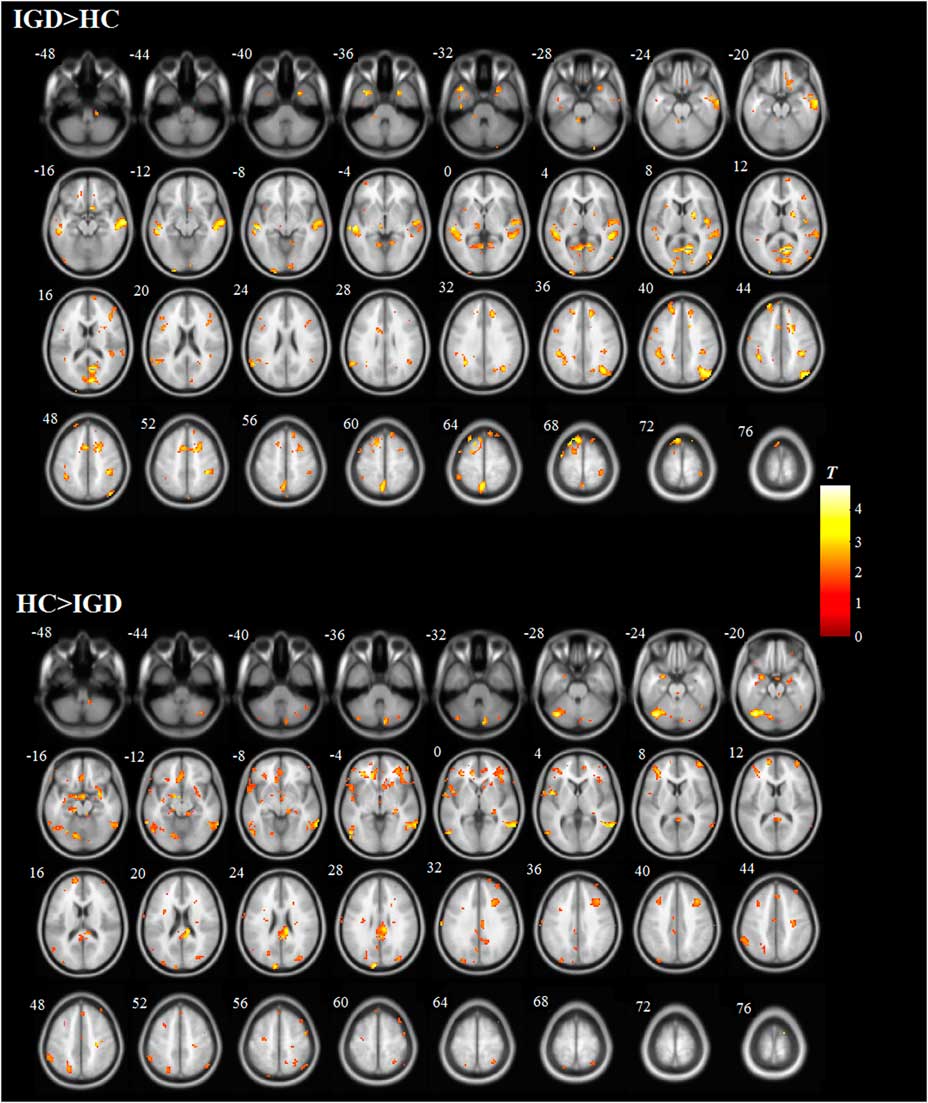
We identified the following network patterns when comparing IGD subjects to the HC group with 2-sample t-tests (Table 3; Figure 5). Compared with the HC group, the IGD subjects demonstrated altered functional connectivity in 4 components from the voxel-wise comparison of group differences. Within the right executive control network, in contrast to controls, IGD subjects showed significantly increased connectivity from the MTG, STG, and MFG, but reduced connectivity from the posterior cingulate cortex (PCC), MTG, and MFG. In addition, the remaining 3 networks were also found to be significantly different between the 2 groups, which demonstrated to be involved in visual-related networks.
The group differences between IGD subjects and the HC group in the right executive control network (p<0.05 FWE corrected). The color bar is the T-score.

Brain regions showing connectivity differences between IGD subjects and healthy controlsFootnote *

IGD=Internet gaming disorder; BA=Brodmann area.
* Results from a group-level 2-sample t-test (p<0.05, corrected by FWE). x, y, and z are Talairach coordinates of the most significant center of activation within a cluster.
Discussion
In the current study, we used the new data-driven multivariate method, ICA, to characterize the functional connectivity network in IGD subjects. In contrast to the traditional GLM method, ICA can provide results that are not constrained by our experimental model, and it can provide insight into other sources of brain dysfunction.Reference Calhoun, Liu and Adalı 46 As a result, we identified group differences in functional networks, namely right executive control networks and visual-related networks during an addiction Stroop task. As we hypothesized, the IGD subjects showed abnormal functional connectivity in the right executive control network, including the MFG, IPL, MTG, and PCC.Reference Kilts, Kennedy and Elton 47 , Reference Worhunsky, Stevens and Carroll 48 Our findings showed that the functional connectivity in IGD subjects was disproportionately driven by the clusters related to attentional bias that exhibited group differences.
Theoretical models of addiction suggest that the imbalance between strong drug-oriented motivational processes (ie, cue-reactivity, craving) and compromised regulatory executive functions plays an important role in the trajectory from addiction.Reference Rita and Nora 49 – Reference Dong, Lin, Hu, Xie and Du 55 In other words, altered executive functions play an important role in the development of addiction. Individual differences in executive function could be a powerful predictor of the course of addictions and an important contributor to the individual risk to developing addictions.Reference Fillmore and Vogel-Sprott 56 , Reference Fillmore and Vogel-Sprott 57 Altered functions involved in these brain regions, such as the MFG, IPL, MTG, PCC, and insula, have been observed in substance-dependent subjects in relation to impaired executive control.Reference Dong, Shen, Huang and Du 58 , Reference Li, Luo, Yan, Bergquist and Sinha 59 The altered functional connectivity of the executive control network has been reported in studies of IGD, cocaine dependence, and substance dependence.Reference Worhunsky, Stevens and Carroll 48 , Reference Dong, Lin and Potenza 60 In the present study, compared with the HC group, the IGD subjects showed abnormal functional connectivity in the right executive control network (component 10) with increased connectivity in the MTG, STG, and MFG and reduced connectivity in the posterior cingulate, MTG, and MFG. These findings could be interpreted in light of the addiction-related disruption of brain function and the putative functional roles of the executive control network.
Executive functions can be defined as an integrated group of skills that are involved in the production, monitoring, and control of goal-directed behaviors, and are organized into separate components: updating or monitoring, inhibition, shifting, and decision making.Reference Verdejo-García and Pérez-García 61 The neural networks underlying executive control, such as cognitive control processes, mainly behaved as error monitoring and error awareness.Reference Kerns, Cohen, MacDonald, Cho, Stenger and Carter 62 , Reference Garavan, Ross, Murphy, Roche and Stein 63 It involves brain regions including the dorsolateral prefrontal cortex, ventrolateral prefrontal cortex, and lateral/medial parietal cortex.Reference Wagner, Maril, Bjork and Schacter 64 – Reference Monterosso, Piray and Luo 66 Previous research has indicated that the frontal gyrus is involved in the cognitive control aspects of attentional bias, and these networks are also relevant to IGD.Reference Worhunsky, Stevens and Carroll 48 For instance, altered right fronto-parietal network engagement among a cocaine-dependent group during a counting Stroop task represents a deficit in cognitive control,Reference Barrós-Loscertales, Bustamante, Ventura-Campos, Llopis, Parcet and Ávila 67 a right fronto-parietal network for attentional monitoring.Reference Zhang and Li 68 Researchers have also demonstrated by applying voxel-based morphometry that the volume of gray matter in the prefrontal gyrus was getting smaller in IGD subjects compared with the HC group.Reference Lin, Dong, Wang and Du 69 In the present study, the increased connectivity in the MTG, STG, and MFG in the IGD subjects suggests abnormally enhanced cognitive control processing. This finding may underlie the addicts’ relatively high response to gaming-related cues driven by abnormal cognitive control processing.
The deficits in executive functions, especially impulse control, have been proposed as a main feature of impulse control disorders.Reference Zhou, Li and Zhu 70 Thus response inhibition is another aspect of executive control function, which is related to brain regions such as the PCC and the frontal gyrus.Reference Ruff, Woodward, Laurens and Liddle 71 Researchers have demonstrated that the PCC is implicated in attentional processes and is involved in inhibition control.Reference Hester and Garavan 72 A study using ICA has identified a brain inhibitory control network, which is composed of brain regions such as the frontal gyrus and the cingulate cortex.Reference Elton, Tripathi and Mletzko 73 Previous studies have also revealed that IGD subjects had lower gray matter density in the left PCC.Reference Pearson, Hayden, Raghavachari and Platt 74 , Reference Ding, Sun and Sun 75 Additionally, our previous studies also found that IGD subjects showed higher fractional anisotropy, indicating greater white matter integrity in the left PCC compared to the HC group.Reference Dong, DeVito, Huang and Du 76 In the present study, in the IGD subjects, the PCC and MFG showed decreased contribution of functional connectivity in the right executive control network. This result suggests that less response inhibition was recruited in IGD subjects during the addiction Stroop task, which may underlie the weakened response inhibition.
In present study, the IGD subjects exhibited altered functional connectivity both in the right executive control network and visual related networks, which were related to attentional bias. The behavioral data suggest that the participants’ responses to gaming-related words were significantly longer than those of neutral ones. In addition, although not statistically significant, IGD subjects showed longer RTs than the HC group. Thus, we believed that altered functional integration of th right executive control network should be considered as a candidate neural contributor to links between attentional bias and IGD.
Limitations
Some limitations regarding this study should be noted. First, the sample size in the present study was relatively small, which may weaken the statistical power of the results. Further studies using a larger sample size are expected to examine the results of this study. Second, the head motion criteria used in the fMRI preprocessing analysis was 2.5 mm and 2.5 degrees, which may be not strict enough and may have impacted the accuracy of the results. More strict exclusion criteria of head motion are necessary in future studies. Finally, the group-difference in behavioral performance only provided a trend, and no significant correlations were found between behavioral performance and imaging results in this study, which might weaken the conclusions (though the imaging results and the literature in this field could provide support for our conclusions). We expect future research efforts to provide more evidence for the conclusions of this study.
Conclusion
The current study showed that the IGD subjects showed abnormal functional connectivity of the right executive control network, which could be implicated in the increased cognitive control and diminished response inhibition to game-related stimuli. These results may underlie the IGD subjects’ increased response to gaming-related cues and weakened strength of response inhibition.