INTRODUCTION
Medieval Northern Finland
How humans adapted to the marginal environments of Northern Ostrbothnia, one of the most rural areas in Europe where cultivation can be practiced, is still a mystery. In this area, where soil is not fertile and climate causes harvesting failures regularly even in modern times, survival would have been extremely difficult. To investigate environmental adaption, I studied the temporal dietary history of a population at Iin Hamina, northern Finland, using stable isotope analysis. This site, dated to 15th and 16th centuries AD, was occupied during the last stage of this particular cool climate anomaly named the Little Ice Age (Luoto et al. Reference Luoto, Nevalainen and Sarmaja-Korjonen2008). Currently, there is no information available to show if this population faced difficulties during this harsh climatic period. Consequently, this is the first evidence of human and environment interaction from this period in northern Finland. Moreover, this new evidence will enlighten the overall Medieval history of the area during this period in northern Finland.
This period and region are generally poorly understood. Preliminary macrofossil analysis has been conducted on soil from within graves at Iin Hamina, an area where no cultivated species have been found (Tranberg Reference Tranberg2011) and no macrofossil studies have been systematically applied. The history of subsistence and farming of Northern Ostrobothnia is unknown. The only pollen analysis study from this area remains problematic (Lahtinen and Rowley-Conwy Reference Lahtinen and Rowley-Conwy2013). Most osteological analyses in Ostrobothnia involve later periods, and discoveries of domesticated animals from Iin Hamina are limited to four charred cow fragments and a bone from one sheep or goat (Salmi Reference Salmi2011). Nevertheless, historians have argued whether the area was permanently occupied by newly arrived farmers or if farmers cohabited with hunter-gatherers (Luukko Reference Luukko1954; Korteniemi Reference Korteniemi1992; Mäkivuoti Reference Mäkivuoti1992; Vahtola Reference Vahtola1992; Kuusela et al. Reference Kuusela, Tiilikkala, Vaske and Okkonen2011). Direct evidence of these arguments is missing, however, and the significance of farmed food during the investigated period is unknown. This study, using temporal reconstructions of diet by stable isotope analysis, investigates whether people would have faced either too high protein consumption or restricted energy, which in turn could be visible in the isotope composition of dentine incremental samples.
The Iin Hamina Site
This site was selected because of its unique characteristics: its era; the high quality of preservation; the availability of samples; and its northerly location. The site is unique as no other cemeteries from this period have been excavated from this area nor has this large a site been excavated in Finland from this period. Bone preservation was visibly good (i.e., most bones existed and were able to be lifted from the burial site), as indicated by the successful collagen extraction (Lahtinen and Salmi Reference Lahtinen and Salmi2017), although this is not the case in most cemeteries in Finland.
The study area, Northern Ostrobothnia, is near the Arctic Circle, but is in fact located in the subarctic climate zone, and the main vegetation is boreal forest (i.e., the Taiga). Currently, the growing season in Ii is approximately 180 days. This means that for the period outside this growing season, approximately half the year, very little plant-based food is available. However, sources of protein are widely available because hunting and fishing may be practiced year-round. Human diet cannot, however, be based solely on protein, and medical studies suggest that protein intake cannot exceed approximately 35% of the total energy of a diet, as a higher intake would cause serious health problems (Bilsborough and Mann Reference Bilsborough and Mann2006 and citations therein). Overconsumption of protein can cause poisoning and starvation symptoms within weeks. For most human groups, protein intake does not exceed more than 25% of their daily calorie intake (Speth Reference Speth1987; Noli and Averyb Reference Noli and Averyb1988 and citations therein). There are some exceptions: according to anthropological studies, indigenous northern Canadian Inuit people can consume up to 40% of their daily energy as protein, along with other animal-based food groups such as fat (Draper Reference Draper1977). Dental pathologies found from skeletal material at Iin Hamina suggest a high-protein and low-carbohydrate diet (Vilkama 2011). It is not known whether protein intake was close to this maximum capacity, although a diet based solely on protein remains untenable even in northern Finland.
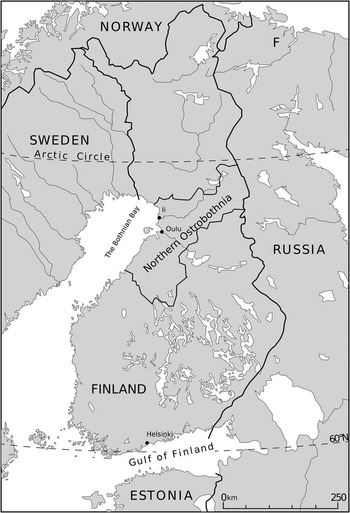
Iin Hamina is a large cemetery site in the modern village Ii in the Northern Ostrobothnia region. The site is situated on the riverbank of the river Ii, one the largest rivers in Finland, and close to the Baltic Sea coast (Figure 1). There are at least 290 individuals buried at the site (Kallio-Seppä Reference Kallio-Seppä2011). During a rescue excavation conducted in 2009, both in-situ burials and a large reburial of selected human remains (Kallio-Seppä Reference Kallio-Seppä2010; Kallio-Seppä et al. Reference Kallio-Seppä, Junni, Niinimäki, Korpi, Tanskanen, Heikkilä and Kamula2009 & Reference Kallio-Seppä2010) occurred. The reburials were likely made during pipeline construction work in the village in the 20th century, although there is no direct evidence to support this theory (Kallio-Seppä Reference Kallio-Seppä2010). Two radiocarbon (14C) dates obtained from reburied human remains show that they are contemporanous with those obtained from the in-situ burials (Korpi and Kallio-Seppä Reference Korpi and Kallio-Seppä2011; Lahtinen and Salmi Reference Lahtinen and Salmi2017) and thus likely belong to the same population.
Map showing location of the modern village Ii where the Iin Hamina site is located

Dentine Isotope Analysis
Previous studies of the skeletal material from the Iin Hamina cemetery involved carbon and nitrogen stable isotopes analysis (Lahtinen and Salmi Reference Lahtinen and Salmi2017). These isotopes were analyzed using the bone collagen of 78 individuals from the Iin Hamina cemetery. The study included 15 animals from preindustrial contexts excavated at northern Finnish sites in Rovaniemi, Tornio, and Oulu. Bone collagen is an optimal material for reconstructing averages of long-term diets as it reforms throughout the entire human lifetime and has a slow rate of turnover (Sponheimer and Robinson Reference Sponheimer and Robinson2006; Hedges et al. Reference Hedges, Clement, Thomas and O’Connell2007). It can represent diets over several decades. Contrary to this, most teeth develop during childhood and early adulthood; thus, isotope analysis from dentine analysis can be used for temporal studies (Wright Reference Wright1999; Howcroft et al. Reference Howcroft, Eriksson and Lidén2012; Eriksson and Lidén Reference Eriksson and Lidén2013). The isotope composition of incremental dentine samples provides a good record of breastfeeding and weaning (Eerkens et al. Reference Eerkens, Berget and Bartelink2011; Beaumont et al. Reference Beaumont, Gledhil, Lee-Thorp and Montgomery2013a, Reference Beaumont, Montgomery, Buckberry and Jay2015; Burt and Garvie-Lok Reference Burt and Garvie-Lok2013). In this study, however, I focus on the diet of the population, and thus use samples from teeth (second and third molars are prioritized) that are likely to have passed weaning age.
Temporal reconstructions of a diet using the isotopic composition of dentine collagen can disclose sources of nutrition from infancy to the full development of the third molar. Even pre-birth conditions can be studied, as dentine begins to develop in-utero (Al Qahtani et al. Reference Al Qahtani, Hector and Liversidge2010). Dentine development begins during the initiation stage, and continues throughout the bud, cap, and bell stages of tooth growth. The crown develops first, followed by the root, continuing until the formation of the whole tooth is complete (Linde and Goldberg Reference Linde and Goldberg1993). The incremental growth of the dentine collagen is apparent in the conical layers of dentine formed concentrically within one another, growing like a series of overlapping sleeves (Hillson Reference Hillson2005). Because of the conical formation of dentine, our samples represent an average of several of these conical layers, because the sampling process involves horizontal sections (see Beaumont et al. Reference Beaumont, Gledhil, Lee-Thorp and Montgomery2013a). Consequently, the results may be an underestimation of short-term changes in diet. Variations in isotope composition probably represent annual or longer-term changes and can indicate if there were any problems resulting from dietary habits (Montgomery et al. Reference Montgomery, Beaumont, Jay, Keefe, Gledhill, Cook, Dockrill and Melton2013). This methodology allows the study of the victims of starvations and illness, but also of individuals who survived through difficult times of hardship (manifested in dietary stress) into adulthood. Thus, I avoid the “osteological paradox,” a term used to refer to problems of erroneously portraying the dead as a truly representative sample of a past living population (Wood et al. Reference Wood, Milner, Harpending, Weiss, Cohen, Eisenberg, Hutchinson, Jankauskas, Cesnys, Ĉesnys, Katzenberg, Lukacs, McGrath, Roth, Ubelaker and Wilkkinson1992; Beaumont et al. Reference Beaumont, Gledhil, Lee-Thorp and Montgomery2013a). Moreover, isotope analyses from incremental dentine collagen samples offer a better resolution than isotope studies made from bulk bone collagen (Beaumont et al. Reference Beaumont, Geber, Powers, Wilson, Lee-Thorp and Montgomery2013b; Montgomery et al. Reference Montgomery, Beaumont, Jay, Keefe, Gledhill, Cook, Dockrill and Melton2013; Sandberg et al. Reference Sandberg, Sponheimer, Lee-Thorp and Van Gerven2014).
Although the time scale of the dietary reconstruction is limited to the period of development of the dentine collagen, this method allows the study of temporal variations of diet in areas and from periods where historical records are not available, such as for Iin Hamina in Northern Ostrobothnia. Furthermore, in marginal climates, temporal reconstructions allow investigation into whether people had constant subsistence practices, or if some types were prioritized over others [as shown in studies of early farming as practiced on the Shetland Islands (Montgomery et al. 2014)]. It is also possible that dietary stress is evident in the isotope composition of dentine from the people of Iin Hamina. This should also be apparent regarding preindustrial Finnish crop yields, as most people did indeed survive harvest failures, many of them into adulthood (Hayward et al. Reference Hayward, Holopainen, Pettay and Lummaa2012).
Fish was probably the main source of protein, but as noted above, humans require other nutrients besides protein to survive and live healthfully. The content of the non-protein part of the diet of the Iin Hamina population is unknown. Moreover, this non-protein diet cannot be determined by bulk collagen isotopic data, as bone collagen is mostly formed from consumed protein (Ambrose and Norr Reference Ambrose and Norr1993; Jim et al. Reference Jim, Ambrose and Evershed2004). However, macronutrients, such as fat and sugar, may contribute as much as 20% of the isotope composition of bone collagen (Fernandes Reference Fernandes, Nadeau and Grootes2012; Craig et al. Reference Craig, Bondioli, Fattore, Higham and Hedges2013).
Using this method, I deduce food shortage among the population, even if the type of food cannot be assessed. An increase in δ15N values in bone collagen in a calorie-restricted diet has been tested in several different studies: as a controlled feeding experiment using mice revealed it, although δ13C values were not affected (Robertson et al. Reference Robertson, Rowland and Krigbaum2014). Likewise, in another study on birds, an increase in δ15N values was observed in avian liver and muscle tissue when a calorie-restricted diet was introduced (Hobson et al. Reference Hobson, Alisauskas and Clark1993). This has also been observed in assessments of excreta from fasting reptiles (McCue and Pollock Reference McCue and Pollock2008). However, the opposite result (i.e. a decrease in δ15N values) has been observed in the blood of song sparrows (Melospiza melodia; Kempster et al. Reference Kempster, Zanette, Longdtaffe, MacDougall-Shackeleton, Wingfield and Clinchy2007) and puffins (Williams et al. Reference Williams, Buck, Sears and Kitaysky2007) when a restricted calorie diet was applied. Avian test subjects can, however, have substantially different metabolisms as compared to mammals and are thus not directly comparable. Important studies on mice (Robertson et al. Reference Robertson, Rowland and Krigbaum2014) and bonobos (Pan paniscus) (Deschner et al. Reference Deschner, Fuller, Oeize, Boesch, Hublin, Mundry, Richards, Ortman and Hohmann2011) agree with observations on human hair from clinical studies of patients suffering from a restricted-calorie diet (Mekota et al. Reference Mekota, Grupe, Ufer and Cuntz2006; Nauberger et al. 2013), when restricted-calorie diets have also been monitored (Deschner et al. Reference Deschner, Fuller, Oeize, Boesch, Hublin, Mundry, Richards, Ortman and Hohmann2011). Therefore, it is most likely that a restricted calorie intake (or other dietary stress, such as lack of non-protein nutrients) increases bone collagen δ15N values. This is detectable in dentine collagen increments and has been discovered in the human dentine incremental samples taken from casualties of the Irish Potato Famine (Beaumont et al. Reference Beaumont, Geber, Powers, Wilson, Lee-Thorp and Montgomery2013b; Beaumont and Montgomery Reference Beaumont and Montgomery2016).
MATERIALS
Dentine is an excellent material for temporal reconstructions of the diet. It has both inorganic and organic components that form the structure of the tooth. The former is mostly apatite [Ca10(PO4)6(OH,F,Cl)2] that can be found in different parts of the tooth, such as enamel and cementum as well as dentine (Linde and Goldberg Reference Linde and Goldberg1993). In this study, I use the organic fraction, which is mostly collagen and a small quantity of “ground substance,” e.g., non-collagenous proteins (Linde and Goldberg Reference Linde and Goldberg1993). Collagen proteins in dentine can be used in temporal reconstructions of a diet (Drucker et al. Reference Drucker, Bocherens, Pike-Tay and Mariotti2001), as teeth do not reform after the completion of their growth (Balasse et al. Reference Balasse, Bocherens, Mariotti and Ambrose2001). Moreover, unlike bone collagen, which reflects diet over a long period (Hedges et al. Reference Hedges, Clement, Thomas and O’Connell2007), dentine collagen reflects the isotope composition of a diet during its development. Furthermore, even though dentine tissue does not reform, ionic exchange is possible: this has been observed between a filling and tooth (Knight et al. Reference Knight, McIntyre and Craig2007). This suggests that ion exchange in the carbon composition of dentine might be possible. It should be noted, however, that the observed ion exchange of inorganic compounds was on a very small scale (ion exchange layers were microns) and thus do not noticeably impact upon interpretations made from the incremental dentine analysis.
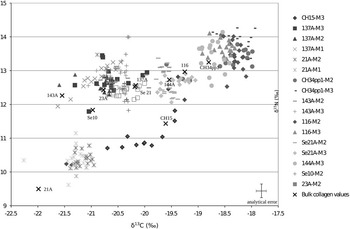
Based on the bulk collagen study of isotope composition (detailed in Lahtinen and Salmi Reference Lahtinen and Salmi2017), 18 human teeth from 11 individuals were selected as sample material. The samples were selected from individuals of varying bone bulk collagen isotope composition (Figure 2). This data set included the only significant outlier of the study, individual 21A (Lahtinen and Salmi Reference Lahtinen and Salmi2017). The second and third molars from each individual were sampled. Due to restrictions in sample availability, the permanent third molar of individual 21A and the second molar of individual CH15 were not assessed. Furthermore, the second molars of the individuals 144A and Se10 were not sampled as they had been damaged during the post excavation processes. All sectioned teeth were fully grown with completed roots. Tooth crowns were not worn down to the dentine, apart from samples of individual CH-34pp1, whose teeth were worn, leaving dentine exposed.
As noted by Al Qahtani et al. (Reference Al Qahtani, Hector and Liversidge2010), the median age of each tooth is used to derive the age estimation of the dentine. To estimate the age of an increment sample, the length of dentine development was divided equally by the number of increment samples (supplementary data provided online). The age of the development of each tooth varies between individuals and is likely to be an approximation. The dentine of the first molars starts to develop in utero (approximately during week 30) and is completed between 8.5 and 12.5 years (median 10.5), but the growth of the tooth itself is completed between 7.5 and 9.5 years (median age 8.5 years). The dentine of the second molars starts to develop between 2.5 and 4.5 years (median 2.5), while the root is completed between 12.5 and 14.5 years (median 14.5 years). The dentine of the third molars has a more varied initial development age, ranging between 7.5 and 14.5 years (median 8.5) and the root is completed between 17.5 and 23.5 years (median 19.5). Al Qahtani’s sample population included only 12 males and 12 females, which is a very small sample, and it is possible that variation in the growing age of the third molar could be even greater.
METHODS
Each tooth was photographed and bisected vertically. Enamel was removed from the selected half, and all surfaces were cleaned with a hand drill before being weighed. The sampling method used is described in detail in Beaumont et al. (2013) with the process of collagen extraction following that set out by Longin (Reference Longin1971). The tooth half was then demineralized in a 0.5 M HCl solution until the sample was flexible and did not release carbon dioxide. Each half tooth was sliced into 1-mm layers and the layers were then placed in individual tubes. The tubes were filled with a pH 3 HCl solution and heated for 48 hrs at 75°C to reflux the collagen. Dissolutions were centrifuged for 4 min with 30k runs per minute and then freeze-dried. The result product is considered to be dentine collagen.
Samples were measured at Durham University and the University of Bradford (see Table 2). Carbon and nitrogen isotope compositions were measured in duplicate at the Durham University Department of Earth Sciences using a Costech elemental analyzer (ECS 4010) coupled with a Thermo Finnigan Delta V Advantage. Carbon-isotope ratios were corrected for 17O contribution (Craig Reference Craig1957) and reported in standard delta (δ) notation in per mil (‰) relative to the VPDB and AIR scale. Data accuracy was monitored through analyses of in-house standards, which are stringently calibrated against international standards (e.g., USGS 40, USGS 24, IAEA 600, IAEA N1, IAEA N2). Analytical uncertainty for δ13Corg and δ15Ntot measurements was ±0.1‰ for replicate analyses of the international standards and <0.2‰ on the replicated sample analysis. Total organic carbon and total nitrogen data were obtained as part of the isotopic analysis using an internal standard (i.e., glutamic acid, 40.82% C and 9.52% N). The University of Bradford duplicated samples were analyzed with a Thermo Flash EA 1112 coupled with a Delta plus XL via a Conflo III interface and reported in standard delta notation (δ) per mil (‰) relative to the VPDB and AIR scale. Based on the analysis of the internal and international standard (IAEA N1, IAEA N2, IAEA600, ANU Sucrose, PEF1) an accuracy of 0.2‰ or greater was obtained.
Diagenetic alteration of collagen discovered from archaeological contexts may have changed the original isotope composition. It has been suggested, however, that by using the following criteria, altered bone collagen samples can be recognized from the data:
-
1. The total carbon percentage was between 28.8 and 44.8% (Ambrose Reference Ambrose1990).
-
2. The total nitrogen percentage was between 10.2 and 16.5% (Ambrose Reference Ambrose1990; Van Klinken Reference Van Klinken1999).
-
3. The collagen yield of the tooth was not lower than 3% (Ambrose Reference Ambrose1990).
-
4. The nitrogen and carbon molecular ratio is between 2.9 and 3.5 (DeNiro Reference DeNiro1985).
The yield was measured from the whole tooth, but other criteria were obtained from each sample independently.
RESULTS
Detailed numbers of the mean of the duplicate delta values and their age estimation are provided in supplementary data provided online, together with C/N ratios, and C and N percent (see also Figure 4). The two laboratories were involved; both laboratories used international standards, and samples from each tooth were analyzed in the same laboratory. Thus, the results of each tooth are comparable within each profile. The quality criterion introduced above were met with most samples. Thirty-nine of the samples did exceed the 44.8% carbon limit. This could be due to the carbon composition criteria having been observed in bone collagen, and not in dentine. Despite exceeding this criterion, carbon and nitrogen ratios fell within the limits, suggesting a good preservation of dentine and the non-altered isotope compositions. Moreover, analyses from dentine with even higher carbon composition have been shown to result reliable isotope composition, if other criteria were met (Beaumont et al. Reference Beaumont, Gledhill and Montgomery2014).
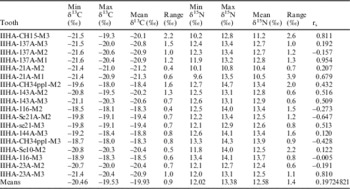
A scatter plot of the isotope composition of the samples (Figure 2), shows that incremental samples cluster in close proximity to the bulk collagen isotope composition (no more than 1‰ difference). Furthermore, no significant sudden increase or decrease in nitrogen isotope composition is apparent (Tables 1 and 2, Figures 2–4) apart from individual 21A and CH15. A summary of the isotope composition of the teeth is shown in Table 1. Visual observation of the isotope composition profiles in Figure 4 shows that no similarities in variation were apparent.
Scatter plot of the incremental dentine and bulk collagen samples’ nitrogen and carbon isotope compositions (bulk collagen isotope compositions from Lahtinen and Salmi Reference Lahtinen and Salmi2017).

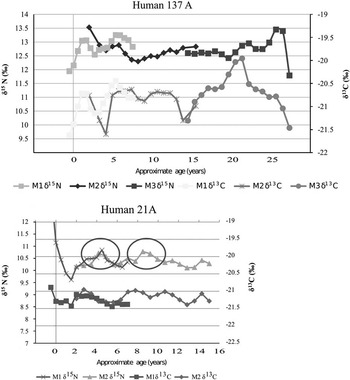
Isotope ratio profiles of Human 137A (three molars) and Human 21A (first and second molars). The increase in nitrogen isotope composition when carbon isotope composition remains unchanged is circled.

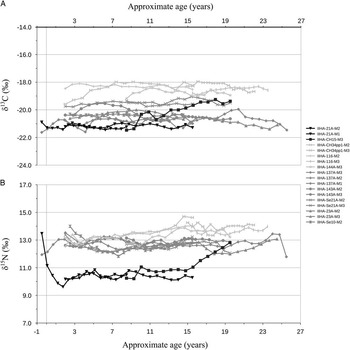
Scatter plot of profiles of the incremental samples isotope composition. A: carbon isotope temporal changes. B: nitrogen isotope temporal changes.

Minimum, maximum, mean and range of δ13C and δ15N values and Spearman’s rank correlation coefficient (rs) of δ13C and δ15N values of each tooth. Means of each column is calculated in the last row of the table.

Tooth-growth timelines.

Contrary to minor changes (less than 1‰), the first molar of individual 21A shows an increase in the nitrogen isotope ratio of the crown (Figure 4). The samples from the individual 21A cluster together with higher nitrogen and carbon isotope composition than the bulk collagen sample, apart from that first sample of the first molar (Figure 2). Based on the visual observation of sample 21A, the nitrogen isotope ratio increased around ages 4–9. The increase at approximately 4 years of age is visible in both the first and second molars. Large-scale change (more than 2‰) in δ13C and δ15N values of the CH15 third molar are clearly visible in Figure 2.
The first and second molars were studied from two individuals (21A and 137A, see Figure 3). This was an important part for evaluating the reliability of methods for determining the age or the isotope composition of incremental. This was particularly important when comparing second and third molars, because age estimation of the third molar varies more than in other teeth (Al Qahtani et al. Reference Al Qahtani, Hector and Liversidge2010) and thus has the highest likelihood of being inaccurate. Visual observation of the isotope composition of incremental samples from the first and second molars of individuals 21A and 137A shows that samples of the same age provided similar isotope compositions, with simultaneous changes. This suggests that the aging is probably accurate and that the changes analyzed from incremental dentine samples are real changes. This is in agreement with Beaumont et al. (2013) and Fuller et al. (Reference Fuller, Richards and Mays2003), who suggest that the method is reliable and that dietary changes can be studied from dentine incremental samples.
Result Characteristics
Result characteristics were studied to compare incremental dentine isotope composition profiles (Figure 4). Following a visual assessment of the results for each tooth independently (Figure 4), it is clear that neither δ13C nor δ15N is normally distributed in any of the sampled teeth. Minimum, maximum, mean, and range of the δ13C and δ15N values are listed in Table 1. Range (difference between minimum and maximum value) of δ15N values is 3.85‰ at its highest and 0.59‰ at lowest (mean 1.38). Variation of δ13C values, is 2.21‰ at highest and 0.42‰ lowest (mean 0.92).
To test similarities of the behavior of the δ13C and δ15N value curves (see Figure 4), Spearman’s rank order correlation was tested between δ13C and δ15N value curves (see Table 1). This test describes similarities in the behavior of the curve; whether the two curves simultaneously increase or decrease (correlation) or move in opposite directions (negative correlation). The behavior could indicate whether or not changes in the profiles are related to dietary variation (correlate) or if nitrogen and carbon vary independently (calorie-restricted diet increases δ15N values, but not necessarily δ13C, thus limited correlation could indicate dietary stress). Variance in correlation is substantial, from almost perfect correlation (0.95) to almost zero correlation (–0.005), and both negative and positive correlations appear. None of the parameters reported in Table 1 is normally distributed and therefore statistical analyses that assume normality cannot be used. The different parameters of Table 1 were compared with Spearman’s and Kendall’s rank order correlation with SPSS 21. A negative correlation between the mean δ13C and correlation of the two curves (rs) is statistically significant [Kendall’s tau (τ) correlation coefficient and Spearman’s rho (ρ)]. Surprisingly, the variation of δ13C and δ15N values did not correlate with any other variable nor with each other (at 0.05 nor 0.01 levels). Kendall’s tau b test showed a negative correlation between “min δ13C” and rs (at level 0.05, correlation coefficient –0.428, significance 0.01) and the same correlation was also observed with Spearman’s rho (–0.551, significance 0.018). Correlation does not proof causality, but, especially in the case of dietary reconstruction where two variables are not independent, causality can affect correlation. In this observation, higher carbon isotope compositions exhibit a more simultaneous behavior of the δ13C and δ15N values curves (i.e. higher rs). This could suggest that when more marine resources were consumed, either the diet was more monotonous (curves are flat), or the individuals were less affected by other influencing factors in the isotope composition of human dentine, such as starvation. This could be expected to cause a difference in the behavior of the curves. As there is no correlation between the variation of δ13C or δ15N values (i.e. flatness of the curve) and rs, the later interpretation seems at more likely scenario. This interpretation is, however, provisional, as the sample size is small and therefore may be significantly affected by the lifestyle of a single individual.
DISCUSSION
Visual assessment of the isotope compositions of the incremental dentine samples shows that the majority of the incremental dentine profiles can be described as flat (Figure 4). The variation in δ13C and δ15N values is approximately 1‰ or less in most of the teeth and there is a strong correlation between the temporal changes of δ13C and δ15N values (rs>0.4 or rs<–0.4) in nine of the teeth. This variation of 1‰ or less has been observed in humans living with monotonous diet (Lovell et al. Reference Lovell, Nelson and Schwarcz1986) and is likely to indicate normal variation within a population.
There are several possible explanations for the observed results. Firstly, due to a lack of indication of starvation in most individuals, it is possible that cultivation did not play any significant role in the diet of the people of Iin Hamina. Thus, harvest failures during the Little Ice Ace did not cause famine. Even though the history of cultivation in Northern Ostrobothnia is unknown, pollen studies indicate that it was likely very small scale (Reynaud and Hjelmroos Reference Reynoud and Hjelmroos1980; Lahtinen and Rowley-Conwy Reference Lahtinen and Rowley-Conwy2013). It is therefore possible that the climate did not have a significant impact on resource availability. In such a scenario, the Little Ice Age may not have had a discernible effect on the subsistence of the people in Iin Hamina, meaning that no signs of dietary difficulties would be found. Secondly, as the sample size is small, consisting of only 10 individuals, it may not demonstrate the average diet of the general area. However, these individuals were selected to cover the general variation of diet in this population and thus are not random. Moreover, for most individuals included in the study, two teeth were studied, which means that the period of reconstruction is approximately 20 years of life per person. Consequently, the first argument is a more likely an interpretation, as there was no significant dietary stress or shifts in subsistence during this period.
There are a few exceptions to this general, small-scale variation (in this study less than 1‰ variation is considered small). A larger than approximately 1‰ variation in δ13C and δ15N values (Table 1, Figure 3) is observed in the third molar (M3) from the individual CH15. This indicates a change in diet, from the one end of range, which is individual 21A’s bulk collagen composition, to the other, which are were bulk collagen carbon and nitrogen isotope ratios in the Iin Hamina population (Lahtinen and Salmi Reference Lahtinen and Salmi2017). As noted in the Introduction, dietary stress could increase the nitrogen isotope ratio, but would not likely affect the carbon isotope ratio. Because individual CH15’s third molar incremental profiles correlate (covary) very strongly (rs=0.8) they thus likely indicate a significant change of diet toward more marine based subsistence rather than dietary stress. According to Kallio-Seppä (Reference Kallio-Seppä2010) the individual in question is female. As wisdom teeth develop in early adulthood (Al Qahtani 2010), this change could be due to mobility through marriage or some other social arrangement. Alternatively, the person could have immigrated to the area and adopted the local diet. Isotope composition of the mandible indicated a diet of several years prior to death (Tricker et al. Reference Tricker, Dixon and Gretto2002). In this case, mandible collagen had not yet reached equilibrium with the new diet. Mandible collagen isotope composition does reflect an individual’s diet over a longer period, and bone collagen isotope composition had started to turnover toward the isotope composition of the new diet (Figure 2). This would also suggest that (1) the isotope composition derived from the diet of an individual can be restored, unaltered in dentine; (2) reconstructions from dentine incremental samples reflect past diet; and (3) bulk collagen samples do not necessarily accurately describe the diet of an individual.
Another exception to the overall low variability is apparent in the profile of the first molar of individual 21A. The first incremental sample from the tooth shows a higher nitrogen isotope ratio than can be observed from the other samples from both molars (Table 1, Figure 4). It is likely that the first sample is anomalous and does not reflect the person’s diet, but instead indicates either a special weaning diet or some difficulties during the time of birth or in utero when those teeth developed (Al Qahtani 2010). In clinical studies, babies’ nail keratin indicates that infants have a 2–3‰ higher keratin nitrogen isotope ratio than their mothers (Fuller and Fuller Reference Fuller and Fuller2006). This has been observed from a British Medieval site, where the difference between a rib and second molar crown indicates increased values by 1.2±0.4‰ for δ13C and 3.2±0.8‰ for δ15N (Fuller et al. Reference Fuller, Richards and Mays2003). Also, at an ancient California site, a 3–5‰ drop in δ15N values after breastfeeding was recorded (Eerkens et al. Reference Eerkens, Berget and Bartelink2011). Small increases in this individual’s nitrogen isotope ratio were observed in both molars at the ages of 4 and 9 years (see Figure 3, circled areas). This could indicate short-term dietary stress, as only the δ15N values changed, whereas the δ13C values did not, which agrees with Robertson et al.’s (2014) and Mekota et al.’s (2006) observations on increased nitrogen isotope ratios. There is no indication of such behavior of the δ15N values invalues of the other individuals tested from the Iin Hamina site, apart from this individual, 21A.
In general, only individual 21A showed signals of possible stress or short-term starvation. Although both increases are small, approximately 0.5‰, both are clearly visible. This could indicate that the individual experienced dietary stress at two different points during her growth. However, this individual is an outlier even in the bulk collagen isotope analysis and cannot be considered representative of the broader local population (Lahtinen and Salmi Reference Lahtinen and Salmi2017). The possibility that this person originated non-locally should be investigated with strontium and oxygen isotope analysis. Only dietary stress during the Little Ice Age period from Northern Ostrobothnia can be verified using this sample.
The absence of signals of starvation was a surprise. Currently, there is no clear picture of the history of farming practices in the Northern Ostrobothnia area, and we do not know when farming became an important part of subsistence strategies. However, we know that failures in farming are still a common phenomenon in the areas surrounding Iin Hamina. Thus, with no signals of starvation, these rural agrarian communities must have had survival mechanisms to protect against regular poor yields. Recently, it has been argued that even after the first introduction of agriculture in the country, subsistence from farming returned to hunting, gathering, and fishing during the earlier periods, even in the most prominent region in the southwestern part of the country (Cramp et al. Reference Cramp, Evershed, Lavento, Halinen, Mannermaa, Kettunen, Perola, Onkamo, Heyd and Oinonen2014). It seems reasonable that societies, such as those in the Iin Hamina area, were not fully dependent on cultivation. It may have been impossible to have a sedentary, farming-based society throughout the majority of Finland without vital supplementary resources and the modern development of cultivated plants.
SUMMARY
It is possible to study environmental adaptation and periods of famine using isotope methods from incremental dentine samples as an indicator of long-term dietary stress. The results obtained from the individuals buried at Iin Hamina do not, generally, show signs of dietary stress. On the basis of this lack of stress, it is suggested that the local population was well-adapted to its northern climate. One female individual, 21A, showed a small increase in the nitrogen isotope ratios of her incremental dentine samples, but not an increase in carbon composition, which can be indicative of a restricted calorie diet. It seems that individual 21A also had a different diet compared to the broader population buried at Iin Hamina. This is the first study to show dietary histories of this area. The sample size used for this study is small, and therefore these results may only be considered preliminary and cannot be used to attempt a larger-scale interpretation. However, this study has brought a new perspective to the question of the subsistence of Medieval people in northernmost Europe. The reconstructions show the diet of most of the studied individuals for over 20 years, which suggests that people at Iin Hamina experienced little dietary stress.
Acknowledgments
This study has been funded by the Jenny and Antti Wihuri Foundation and the Oskar Öflund Foundation. The author would also like to thank Darren Gröcke, Joanne Peterkin, and Andrew Gledhill for measuring the samples; Julia Beumont for instructions in sample taking; Rosa Vilkama and Anna-Kaisa Salmi for assisting in sample collection; James Walker, Kurt Grön, Ann Clinnick, and Grainne Lehtipuu for their help with English language. I thank the two anonymous reviewers whose comments improved this manuscript substantially. Moreover, special thanks to Janet Montgomery and Darren Gröcke for their detailed comments during the preparation of this paper, and the University of Bradford for their help in the analysis.
Supplementary material
To view supplementary material for this article, please visit https://doi.org/10.1017/RDC.2017.52