Acute kidney injury is common among children undergoing cardiac surgery. Depending on the patient population and the definition used, acute kidney injury occurs in 11%Reference Sethi, Goyal and Yadav 1 –64%Reference Morgan, Zappitelli and Robertson 2 of infants and children following cardiac surgery, and mortality for those who require dialysis may approach 60–80%.Reference Kist-van Holthe tot Echten, Goedvolk and Doornaar 3 , Reference Picca, Principato and Mazzera 4 Associated morbidity is also substantial, with numerous studies describing longer mechanical ventilator and inotropic support time and prolonged intensive care unit and hospital stays.Reference Blinder, Goldstein and Lee 5 – Reference Zappitelli, Bernier and Saczkowski 8 A variety of risk factors for the development of acute kidney injury following congenital heart surgery have been described, including prematurity, complexity of surgical repair, duration of cardiopulmonary bypass, degree of hypothermia, circulatory arrest, and post-operative low cardiac output syndrome.Reference Picca, Principato and Mazzera 4 , Reference Chan, Ip, Chiu and Cheung 9 , Reference Dittrich, Priesemann and Fisher 10 However, because many of these factors are not known until the post-operative period, pre-operative identification of neonates at greatest risk for acute kidney injury remains challenging.
Recently, there has been increasing interest in the clinical consequences of a low nephron endowment. There is a tenfold natural variation in nephron number in humans (ranging from ∼200,000 to 2 million per kidney),Reference Hoy, Douglas-Denton, Hughson, Cass, Johnson and Bertram 11 and there is now substantial evidence that individuals with a smaller nephron endowment are predisposed to the long-term development of hypertension and progressive renal insufficiency.Reference Hoy, Hughson, Bertram, Douglas-Denton and Amann 12 – Reference Luyckx and Brenner 14 To date, however, no study has used nephron number to predict acute kidney injury.
Although nephron number can only be directly assessed postmortem,Reference Hoy, Douglas-Denton, Hughson, Cass, Johnson and Bertram 11 , Reference Bertram 15 renal volume corresponds to nephron number in the newborn,Reference Nyengaard and Bendtsen 16 – Reference Ingelfinger 18 and methods for the estimation of renal volume by ultrasound using the prolate ellipsoid formula are well described.Reference Holloway, Jones, Robinson, Harpen and Wiseman 19 Standard nomograms for renal volume exist and are widely used in clinical practice.Reference Dinkel, Ertel, Dittrich, Peters, Berres and Schulte-Wissermann 20 Given the complex and multifactorial nature of post-cardiac surgery acute kidney injury,Reference Rosner and Okusa 21 , Reference Bellomo, Auriemma and Fabbri 22 it is logical that patients with a greater nephron endowment might better tolerate the total stress from a multitude of sources than patients with a smaller nephron mass.
We hypothesised that neonates with smaller total renal volume will have more frequent and more severe acute kidney injury following congenital heart surgery than those with greater total renal volume.
Methods
We conducted a retrospective review of all paediatric cardiac surgeries at the University of Virginia from January 1, 2007 to December 31, 2011. Inclusion criteria included age ≤30 days at the time of surgery; surgery for any cardiac lesion other than patent ductus arteriosus; and a pre-operative renal ultrasound and post-operative serum creatinine obtained at our institution. Patients who lacked a pre-operative creatinine measurement were included in the analysis of peak post-operative creatinine, but were excluded from the acute kidney injury analysis as the change from baseline creatinine could not be assessed. The Institutional Review Board at the University of Virginia approved the study protocol and waived the need for consent.
Data collected included age, weight, and body surface area at the time of surgery; gestational age; congenital heart lesion; surgical procedure performed; single or biventricular repair; dominant ventricular morphology for patients with single ventricle physiology; need for and duration of cardiopulmonary bypass; lowest rectal temperature during cardiopulmonary bypass; pre-operative serum creatinine on the day of surgery; peak post-operative creatinine during the first 7 post-operative days; need for renal replacement therapy and renal replacement therapy modality; total ventilator days; total post-operative length of stay; and survival to hospital discharge.
Surgical risk was classified using the risk adjustment for in-hospital mortality among children younger than 18 years after surgery for congenital heart disease (RACHS-1) system.Reference Jenkins, Gauvreau, Newburger, Spray, Moller and Iezzoni 23
The presence and degree of acute kidney injury were defined using the Acute Kidney Injury Network diagnostic criteria and clinical staging.Reference Mehta, Kellum and Shah 24 Owing to the fact that reliable assessments of urine output could not be obtained retrospectively, these criteria were modified to include only serum creatinine. Patients with an increase in serum creatinine of 0.3 mg/dl or an increase to 150–200% of their pre-operative level occurring within the first 48 hours post-operatively were classified as stage 1. Patients with an increase in serum creatinine to 201–300% of pre-operative level were classified as stage 2, and those with an increase in serum creatinine to >300% of pre-operative level were classified as stage 3. Any patient who received renal replacement therapy was classified as stage 3, regardless of the stage when renal replacement occurred. All measurements of serum creatinine were performed at the University of Virginia clinical laboratory using an alkaline picrate method traceable to isotope dilution-mass spectrometry.
Need for renal replacement therapy was defined as the initiation of any dialysis modality within the first 7 post-operative days. Any patient requiring extracorporeal membrane oxygenation post-operatively received haemofiltration and was therefore considered to have received renal replacement therapy and classified as Acute Kidney Injury Network stage 3.
Renal volume was calculated by measuring the maximal dimension of the kidney in three mutually orthogonal planes using the prolate ellipsoid formula (length × width × depth × (π/6)).Reference Holloway, Jones, Robinson, Harpen and Wiseman 19 Body surface area was calculated using the Haycock formula.Reference Haycock, Schwartz and Wisotsky 25
All renal ultrasounds were interpreted by a radiologist who reported the kidney measurements and determined the presence of any anatomic abnormalities. Study investigators blinded to the serum creatinine classified anatomic abnormalities into major and minor categories. Major abnormalities were defined as significant structural abnormalities such as moderate or severe hydronephrosis, solitary kidney, and horseshoe kidney. Minor abnormalities included mild hydronephrosis or pelvicaliectasis (unilateral or bilateral), nephrocalcinosis, extra-renal pelvis, duplicated collecting system, decreased corticomedullary differentiation, and increased echogenicity. Patients with any major abnormality other than solitary kidney were excluded from analysis because accurate measurement of renal volume could not be obtained using the prolate ellipsoid formula, whereas those with minor abnormalities were included in the analysis.
Statistical analysis
Linear regression using a change point modelReference Neter, Kutner, Nachtsheim and Wasserman 26 was used to estimate the association between peak post-operative creatinine and renal volume. Multiple regression was used to estimate the independent association of renal volume on peak post-operative creatinine while adjusting for other characteristics such as pre-operative creatinine, single- or two-ventricle physiology, and RACHS-1 score. Categorical variables were compared using χ2 test. All analyses were performed using SAS version 9.2 (SAS Institute, Cary, North Carolina, United States of America) and GAUSS version 12.0 (Aptech Systems, Black Diamond, Washington, United States of America).
Results
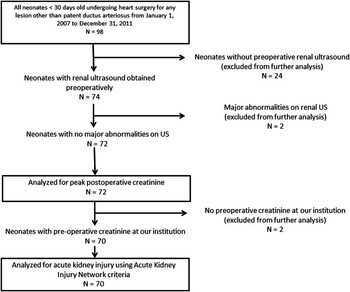
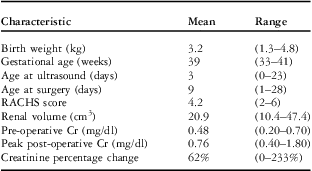
We identified 98 neonates who underwent cardiac surgery for heart lesions other than a patent ductus arteriosus. After excluding patients with no pre-operative ultrasound (n = 24) or who had disqualifying major renal abnormalities (n = 2), 72 neonates were included in the primary analysis. Of these neonates, two did not have pre-operative creatinine recorded at our institution; the remaining 70 were included in the acute kidney injury analysis. Study patient identification, exclusion, and analysis are shown in Figure 1. Demographic characteristics are shown in Table 1.
Identification, exclusion, and analysis of study patients.

Characteristics of the neonates included in the analysis.

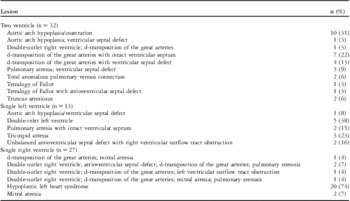
There were 32 (44%) patients who had two-ventricle physiology and 40 (56%) with single-ventricle physiology. Of the patients with single-ventricle lesions, 13 (32%) had left ventricular morphology and 27 (68%) had right ventricular morphology. The specific lesions are listed in Table 2.
Congenital heart lesions and their relative proportion within each ventricular subpopulation.

A total of 50 patients (70%) had normal pre-operative ultrasounds. In all, three patients (4%) had major abnormalities identified – horseshoe kidney; solitary kidney; moderate bilateral hydronephrosis and hydroureter – whereas 19 patients (26%) had minor abnormalities identified – 10 with mild unilateral hydronephrosis or pelvicaliectasis; four with mild bilateral hydronephrosis or pelvicaliectasis; one with mild nephrocalcinosis; one with mildly echogenic right kidney; one with extra-renal pelvis; one with isolated 2 mm cortical cyst; one with echogenic tips of renal pyramids.
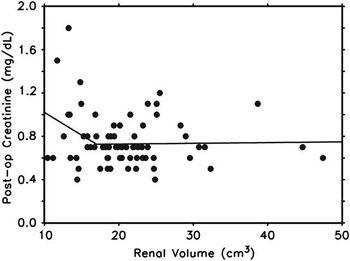
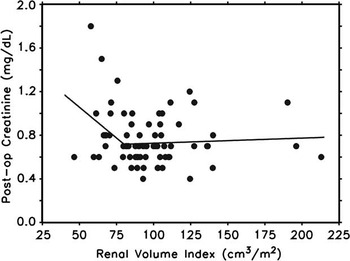
A linear change point model was used to assess the peak post-operative creatinine as a function of renal volume (Fig 2). With a change point of 17 cm3, the estimated slope over renal volumes 10–17 cm3 was −0.042 (standard error = 0.020, p = 0.036). The slope estimate for renal volumes of >17 cm3 was 0.001 (standard error = 0.005, p = 0.89). A similar linear point change model was created after normalising the renal volume to body surface area using a renal volume index (renal volume index = renal volume (cm3)/body surface area (m2)). In this model (Fig 3), the estimated slope up to a renal volume index of 80 cm3/m2 was −0.0113 (standard error = 0.0045, p = 0.014) and the slope above 80 cm3/m2 was 0.000 (standard error = 0.001, p = 0.68).
Linear change point model assessing peak post-operative creatinine as a function of renal volume. For renal volume ≤17 cm3, the slope estimate is −0.042 (standard error = 0.020, p = 0.036) versus slope estimate of 0.001 (standard error = 0.005, p = 0.890) for renal volume >17 cm3.

Linear change point model assessing peak post-operative creatinine as a function of renal volume index (renal volume index = renal volume (cm3)/body surface area (m2)). For renal volume index ≤80 cm3/m2 the slope estimate is −0.011 (standard error = 0.045, p = 0.014) versus slope estimate of 0.000 (standard error = 0.001, p = 0.680) for renal volume index >80 cm3/m2.

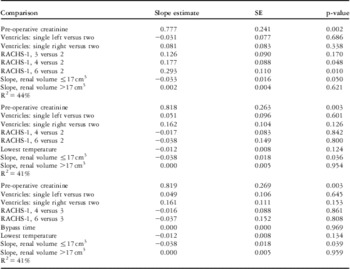
In multivariable change point models that adjusted for pre-operative creatinine, cardiopulmonary bypass time, RACHS-1 score, and lowest temperature, renal volume remained a statistically significant independent predictor of peak post-operative creatinine (Table 3). Only the RACHS-1 score and pre-operative creatinine remained significant predictors of peak post-operative creatinine when renal volume was included in the model.
Multivariable linear change point models.

Pre-operative creatinine and renal volume ≤17 cm3 are significant predictors of peak post-operative creatinine in each model; higher RACHS-1 score is a significant predictor in models in which lowest temperature is not included.
Additional change point models were created after stratifying patients according to ventricular number and morphology. For patients with a single right ventricle (n = 27), the point change model had a slope of −0.075 for renal volumes up to 17 cm3 (standard error = 0.036, p = 0.046) with a slope of 0.00 (standard error = 0.009, p = 0.83) above that threshold. For patients with two ventricles or a single left ventricle, there was no association between renal volume and peak post-operative creatinine using a linear change point model.
Using the Acute Kidney Injury Network clinical criteria, acute kidney injury occurred in 40/70 neonates (57%) following cardiac surgery. In all, 22 patients (31%) reached Acute Kidney Injury Network stage 1, six (9%) reached stage 2, and 12 (17%) reached stage 3. There was one patient who received peritoneal dialysis and nine patients who received extracorporeal membrane oxygenation with haemofiltration.
There was a non-significant trend towards more frequent acute kidney injury (Acute Kidney Injury Network stage >0) in patients with total renal volume ≤17 cm3. Of the 21 (71%) neonates whose total renal volume was ≤17 cm3, 15 experienced acute kidney injury compared with 25 out of 49 (51%) of those with renal volume >17 cm (p = 0.11). This trend was most prominent in patients with a single right ventricle, among whom 10 out of 11 (91%) neonates with renal volume ≤17 cm3 experienced acute kidney injury, versus 11 out of 16 (69%) of those with renal volume >17 cm3 (p = 0.17).
In the study population, 21 out of 72 (29%) patients had renal volumes ≤17 cm3. When classified by ventricular morphology, there was a non-significant trend towards a higher proportion of patients with renal volume ≤17 cm3 among those with a single right ventricle. There were 11 patients (41%) with a single right ventricle who had a renal volume ≤17 cm3, compared with six patients (19%) with two ventricles and four (31%) with a single left ventricle (p = 0.18).
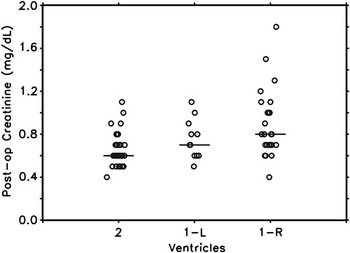
Peak post-operative creatinine also varied by ventricular morphology. Patients with two ventricles had a mean creatinine of 0.67 mg/dl, versus 0.75 mg/dl for patients with a single left ventricle and 0.89 mg/dl for patients with a single right ventricle (p = 0.003, Kruskal–Wallis test) (Fig 4).
Comparison of mean peak post-operative creatinine by ventricular morphology. For neonates with two ventricles, the mean peak post-operative creatinine was 0.66 mg/dl (standard deviation = 0.16), versus 0.75 mg/dl (standard deviation = 0.17) for those with a single left ventricle and 0.89 mg/dl (standard deviation = 0.30) for those with single right ventricle (p = 0.002, Kruskal–Wallis test).

Discussion
This is the first report demonstrating an association between smaller pre-operative renal volume and peak post-operative creatinine in neonates undergoing congenital heart surgery. As total renal volume decreased below a threshold value of 17 cm3, there was a proportional rise in peak post-operative creatinine. Above this threshold, renal volume was not associated with changes in peak creatinine.
At our institution, pre-operative renal ultrasounds have been obtained routinely in neonates before cardiac surgery to assess for the presence of anatomic abnormalities. In this population, the prevalence of major congenital renal anomalies was low (3/74; 4%). However, our findings suggest that obtaining pre-operative ultrasounds may have utility beyond the identification of congenital anomalies, because in neonates renal volume correlates with the nephron endowment.Reference Nyengaard and Bendtsen 16 – Reference Ingelfinger 18
Recently, there has been increasing interest in using nephron number to predict long-term complications such as hypertension and chronic kidney disease. However, to the best of our knowledge, no study to date has associated renal volume, a surrogate for nephron number, with the development of acute kidney injury. Acute kidney injury following cardiac surgery is multifactorial, with contributions from haemodynamic, inflammatory, and nephrotoxic factors. It is biologically plausible that neonates with greater nephron endowments would be better able to tolerate the total renal stress of cardiac surgery than neonates with a smaller nephron mass.
We used a linear change point model, a technique that allows the detection of a threshold effect in a response variable, to identify a threshold value of 17 cm3 below which renal volume was predictive of peak post-operative creatinine. In this cohort, the average total volume of both kidneys was 21 cm3, with a standard deviation of 6.85 cm3. Neonates with a total renal volume <17 cm3 represented the bottom quartile of renal volume in our population. This is similar to previously published normative data, where the average total renal volume for normal newborns is ∼20 cm3, with a standard deviation of ∼5.2 cm3.Reference Holloway, Jones, Robinson, Harpen and Wiseman 19
Smaller neonates are expected to have smaller renal volumes. To determine whether the observed threshold effect was simply the consequence of more frequent acute kidney injury in smaller neonates who require more technically demanding surgery, we standardised the renal volume to body surface area. The results were similar, both in univariate and multivariable models: we identified a threshold of 80 cm3/m2 body surface area below which the renal volume was a significant predictor of higher peak post-operative creatinine, and above which there was no association. Similarly, the observed effect of renal volume on post-operative creatinine does not appear to be due to prematurity. The study population included only seven patients whose gestational age was <37 weeks, and neither gestational age nor birth weight were predictive of peak post-operative creatinine.
To account for previously described predictors of acute kidney injury, we constructed multivariable change point models that adjusted for pre-operative creatinine, RACHS-1 score, bypass time, and lowest temperature during cardiopulmonary bypass. In each of these, there remained a significant inverse linear relationship between total renal volume ≤17 cm3 and peak post-operative creatinine.
To evaluate the occurrence of clinical acute kidney injury, we used the Acute Kidney Injury Network scoring system, modified to include only the serum creatinine as reliable measurements of urine output could not be obtained retrospectively. Overall, acute kidney injury was very common – occurring in 57% of patients – and similar to the incidence reported in other recent studies.Reference Morgan, Zappitelli and Robertson 2 , Reference Blinder, Goldstein and Lee 5 Although there was a trend towards more clinical acute kidney injury (Acute Kidney Injury Network stage >0) in patients with renal volumes ≤17 cm3, tests of statistical significance were not met. We suspect this finding is related to the change from a continuous variable (peak post-operative creatinine) to a categorical one (Acute Kidney Injury Network score) in a relatively small data set. It is possible that with more patients this trend would reach statistical significance.
Predicting post-operative creatinine has significant clinical relevance: among adult cardiac surgical patients, a rise in creatinine as small as 0.2–0.3 mg/dl predicts increased mortality,Reference Lassnigg, Schmidlin and Mouhieddine 27 and similarly small rises in children (25–50% of baseline) are associated with longer length of stay and increased ventilator days.Reference Zappitelli, Bernier and Saczkowski 8 Beyond portending risks, accurate pre-operative identification of neonates at high risk of post-operative acute kidney injury could improve their care. Low renal volume could be used to select patients for pharmacotherapeutic measures such as fenoldopamReference Ricci, Luciano and Favia 28 or clinical trials of new agents to treat or prevent acute kidney injury – many of which would require initiation early in the disease process, before the creatinine has risen.Reference Devarajan 29 Similarly, some authors advocate the prophylactic placement of peritoneal dialysis catheters in patients who are at high risk for developing acute kidney injury in the post-operative period.Reference Alkan, Akcevin and Turkoglu 30 , Reference Dittrich, Dahnert and Vogel 31 However, the placement of a peritoneal dialysis catheter is associated with additional procedural risks and serves as a potential site of infection.Reference Santos, Branco and Gaspar 32 Taken in combination with other known risk factors for acute kidney injury, the measurement of renal volume could serve as an additional method of risk-stratifying patients and determining whether prophylactic dialysis catheter placement is warranted.
The use of ultrasound to predict acute kidney injury is appealing for several reasons. Ultrasound is non-invasive, relatively inexpensive, and can be obtained rapidly at any centre where cardiac surgery is performed. The measurements required to estimate renal volume are obtained on a standard renal ultrasound, and the calculations are simple and straightforward. Perhaps most importantly, ultrasound assessment of renal volume provides useful prognostic information pre-operatively, whereas other identified predictors of acute kidney injury, such as cardiopulmonary bypass time or urine biomarkers,Reference Parikh, Devarajan and Zappitelli 33 cannot be assessed until after the time of surgery.
Our findings have particular relevance to neonates with a single morphologic right ventricle – in particular, those with hypoplastic left heart syndrome, who constituted 74% of the subgroup with single right ventricles. Even in the current era, survival of patients with hypoplastic left heart remains suboptimal, with post-operative mortality rates of 10–15% at even the most experienced centres.Reference Barron, Kilby, Davies, Wright, Jones and Brawn 34 Mortality among patients with hypoplastic left heart syndrome who experience post-operative acute kidney injury is even higher, with rates up to 56%.Reference Hui-Stickle, Brewer and Goldstein 35 In our study population, 91% of patients with a single right ventricle and a renal volume ≤17 cm3 experienced acute kidney injury, whereas those with renal volumes >17 cm3 experienced acute kidney injury with a frequency more similar to the study population as a whole. These results did not reach statistical significance in our study, but it is possible that in a larger population this renal volume threshold would more reliably identify the highest risk patients who should be targeted for renal protective measures or intra-operative peritoneal dialysis catheter placement.
It is intriguing to note that the proportion of patients with small kidneys varied by heart lesion. Although it did not reach statistical significance, patients with a single right ventricle were more likely to have kidneys below our volume threshold – 41% of single right ventricles versus 29% of the whole study population. Previous reports have noted reduced brain volume in neonates with congenital heart disease – particularly hypoplastic left heart syndrome – suggesting that cerebral development is impaired by altered foetal haemodynamics.Reference Barbu, Mert, Kruger and Bahado-Singh 36 , Reference Manzar, Nair, Pai and Al-Khusaiby 37 Although it requires prospective validation in a larger population, our findings may suggest a similar phenomenon, with poor renal blood flow contributing to impaired nephrogenesis and pre-existing chronic kidney disease – type II cardiorenal syndrome.Reference Ronco, Haapio, House, Anavekar and Bellomo 38
Limitations
Our study has several limitations. First, this single-centre study of neonates with congenital heart disease may not be representative of, or applicable to, the populations encountered in other centres. However, the patient demographics and surgical case mix reported here are similar to ones reported from other centresReference Morgan, Zappitelli and Robertson 2 , Reference Bennett, Dent and Ma 39 , Reference Krawczeski, Woo, Wang, Bennett, Ma and Devarajan 40 and the single-centre design has the advantage of minimising confounding due to variations in surgical technique or post-operative care.
A significant portion of patients in our study (24%) did not have a pre-operative renal ultrasound obtained, which could have resulted in a selection bias. Most neonates who did not have ultrasounds obtained had surgery earlier in our study period (43% in 2009 versus 26% in 2010 and 3% in 2011; p = 0.001), which we believe reflects institutional adjustment to a new pre-operative protocol. Importantly, there were no differences in peak post-operative creatinine or acute kidney injury occurrence between the neonates who had ultrasound obtained and those that did not.
Owing to the fact that it is a multifactorial process, we may have overlooked important causes of acute kidney injury in our population. We did not collect data on the occurrence of cardiac arrest, sepsis, pulmonary hypertensive crisis, administration of nephrotoxic medications, or receipt of radiocontrast media, all of which have been described as risk factors for acute kidney injury. However, we can think of no reason why these factors would be unequally distributed by patient's renal volume, and regression models that adjusted for risk factors for acute kidney injury such as pre-operative creatinine, RACHS-1 score, lowest intra-operative temperature, and duration of cardiac bypass yielded similar results.
We were also unable to collect data on urine output or fluid balance in this retrospective study. Fluid overload states are very common following cardiac surgery and may result in an artificial dilution of the serum creatinine, whereas volume depletion is an independent cause of acute kidney injury. Either case could have resulted in classification errors or biased our analysis.
All of the patients in our study who received extracorporeal membrane oxygenation were classified as Acute Kidney Injury Network stage 3 because of their receipt of renal replacement therapy via haemofiltration. This classification was consistent with the Acute Kidney Injury Network criteria, but these patients comprised 75% (9/12) of the patients who reached stage 3. Although it seems very likely that these critically ill neonates would have sustained some degree of acute kidney injury had they not required extracorporeal membrane oxygenation, it is plausible that not all would have developed stage 3 acute kidney injury. This possible misclassification effect should be mitigated by our analyses, which primarily consider whether a neonate experienced any acute kidney injury (Acute Kidney Injury Network stage >0) or none.
Renal volume measurements were derived from a single ultrasound study. Determination of renal volume is dependent on the angle of insonation chosen by the technician, and significant interobserver variation has been reported previously.Reference Sargent, Long, Karmali and Cheng 41 Although this may have limited precision in this research study, it could improve the generalisability of our findings to clinical practice.
Finally, it is noteworthy that when patients were stratified according to ventricular morphology, there was no association between renal volume and peak post-operative creatinine in patients with two ventricles or a single dominant left ventricle. The significance of this lack of association is unclear. In our study population, neonates with a single right ventricle had significantly higher peak post-operative creatinine than other patients (0.89 mg/dl versus 0.67 mg/dl for patients with two ventricles and 0.75 mg/dl for those with single left ventricles; p = 0.003, Kruskal–Wallis test). The higher incidence of acute kidney injury in the group with single right ventricles may allow the detection of a threshold effect against a noisy background more easily than in the other subpopulations in our relatively small data set (Fig 4). Prospective validation of these findings in larger study populations is warranted.
Conclusions
For neonates with a total renal volume ≤17 cm3 undergoing congenital heart surgery, smaller total renal volume predicts higher post-operative creatinine, with a trend towards more acute kidney injury using the Acute Kidney Injury Network criteria. These findings are most evident among neonates with a single morphological right ventricle. If validated prospectively, this volume threshold may help identify patients at greatest risk of post-operative acute kidney injury and thus most deserving of non-specific renal protective measures, inclusion in clinical trials for specific therapies to prevent acute kidney injury, or consideration of prophylactic peritoneal dialysis catheter placement at the time of congenital heart surgery.
Acknowledgements
None.
Financial Support
This research received no specific grant from any funding agency, commercial, or not-for-profit sectors.
Conflicts of Interest
None.
Ethical Standards
The authors assert that all procedures contributing to this work comply with the ethical standards of United States National Research Act and with the Helsinki Declaration of 1975, as revised in 2008, and have been approved by the Institutional Review Board at the University of Virginia.