The theme of “the perils of agency” is a recurrent one in the historiography of Caribbean slavery. This literature has two main branches: an older, censorious view and a more recent, revisionist perspective. Criticisms of managerial abuses first appear in contemporary publications, such as Edward Long’s account of Jamaica (Long Reference Long1774). Modern scholarship begins with Frank Pitman (Reference Pitman1927) and Lowell Ragatz (Reference Ragatz1931), who associated non-residency and agency with agrarian conservatism and economic neglect. Eric Williams’ famous monograph, Capitalism and Slavery, likewise depicts absentee landlordism as “the curse of the Caribbean,” resulting in estate mismanagement and other abuses (Williams Reference Williams1944). These contentions are repeated in numerous later studies, including David Watts (Reference Watts1987).
Revisionist critics object that the causes and consequences of absenteeism were varied, that the ranks of non-resident owners included progressive agriculturalists, and that estates managed by agents continued to be profitable (Hall Reference Hall1964; Ward Reference Ward1988; Burnard Reference Burnard2004). Apologists for agency also point out that sugar cultivation’s scale, complexity, and capital intensity provided incentives to develop management and accountancy systems, regardless of whether an owner continued to reside in the West Indies, or opted to become an absentee (Sheridan Reference Sheridan1971; Green Reference Green1973; Ward Reference Ward1988; Cowton and O’Shaughnessy Reference Cowton and O’Shaughnessy1991; Cooke Reference Cooke2003; Fleischman Reference Fleischman2004). An important contribution by Barry Higman (Reference Higman2005), based on two Jamaican case studies, has boosted revisionism significantly. Rejecting much contemporary criticism of estate managers as unfounded, Higman recasts absenteeism as an agency problem capable of solution through the development of recognizably modern management hierarchies. In his view, the desire to maintain professional reputations, underpinned by efficient contract design, reconciled the interests of planters and agents. For Higman, attorneys coerced greater amounts of labor from the enslaved, generating the levels of output needed to sustain non-residency. “It was the management practiced by attorneys,” he concludes, “that squeezed the maximum possible product from the system and the people it oppressed” (Higman Reference Higman2005, pp. 279–83).
A major weakness of the existing literature is that it lacks explicit comparison of the productivity of estates managed by agents and those directed by their owners. An important reason for this omission lies in the fact that Jamaican sources, on which the majority of research is based, lack widespread information about owner-operated plantations (Higman Reference Higman1976). Unable to measure productivity directly, Higman instead examined the likelihood that an estate would cease production after the legal abolition of slavery in 1833. He reports that Jamaican properties under attorney-ship in 1832 were less prone to failure by 1847. As Higman points out, however, most abandoned estates owned by residents possessed small workforces and were located in marginal areas. Sugar estates under attorneys, in contrast, “occupied the best sites and were on average more productive and profitable” (Higman Reference Higman2005, pp. 282–83). In consequence, the evidence of survivorship does not permit conclusions to be drawn about the relative productivity of agent-operated estates during the period of slavery itself.
Other studies of slavery in the Caribbean and United States demonstrate awareness of similar problems. Investigations of the relative efficiency of slave and free labor in the antebellum cotton South, for example, suggest that scale is correlated with productivity-augmenting characteristics, including location (soil type, relief, and climate) and managerial structures. Alan Olmstead and Paul Rhode (Reference Olmstead and Rhode2008) report that plantation fixed effects are strong determinants of cotton picking productivity. The wider literature emphasizes the difficulty of separating the effects of managerial inputs and structural characteristics on agricultural efficiency. Structural effects can be decomposed into on-farm and off-farm factors. The former include location and size; the latter upstream and downstream relations with suppliers and purchasers that, in turn, affect credit relations and debt financing (van Passel, Lauwers, and van Huylenbroek Reference van Passel, Lauwers, van Huylenbroeck and Mann2006, pp. 3–6).
The possibility of undertaking an analysis of the productivity of plantations on St. Vincent and the Grenadines (SVG) has, hitherto, escaped notice. Britain acquired SVG from France at the end of the Seven Years’ War (1756–1763), during the middle phase of European imperial expansion in the Caribbean (Higman Reference Higman1984). For most of the period from 1805 to 1829, the colony’s plantations ranked second in the British West Indies after Jamaica, producing, on average, 7.8 percent of total sugar output (Watts Reference Watts1987). Previous appraisals of agency in SVG are strongly critical, reflecting the influence of the older literature (Spinelli Reference Spinelli1973; Marshall Reference Marshall2007). These studies do not, however, subject the hypothesis of an agency penalty to rigorous testing: their evidence is selective and includes counter-examples of poor management by resident planters. Contemporary sources similarly allege that malpractice occurred on some properties. Absentee Hugh Perry Keane complained of “the villainous mismanagement of my Estate” and visited St. Vincent twice to improve conditions on Liberty Lodge.Footnote 1 A second non-resident owner, James Adam Gordon, sent a special visiting attorney to inspect his Fairhall property in 1824. The subsequent reports sharply criticized the estate’s management (Smith Reference Smith2008). However, despite their detail, these are only two examples. The interpretive weight they can carry is limited.
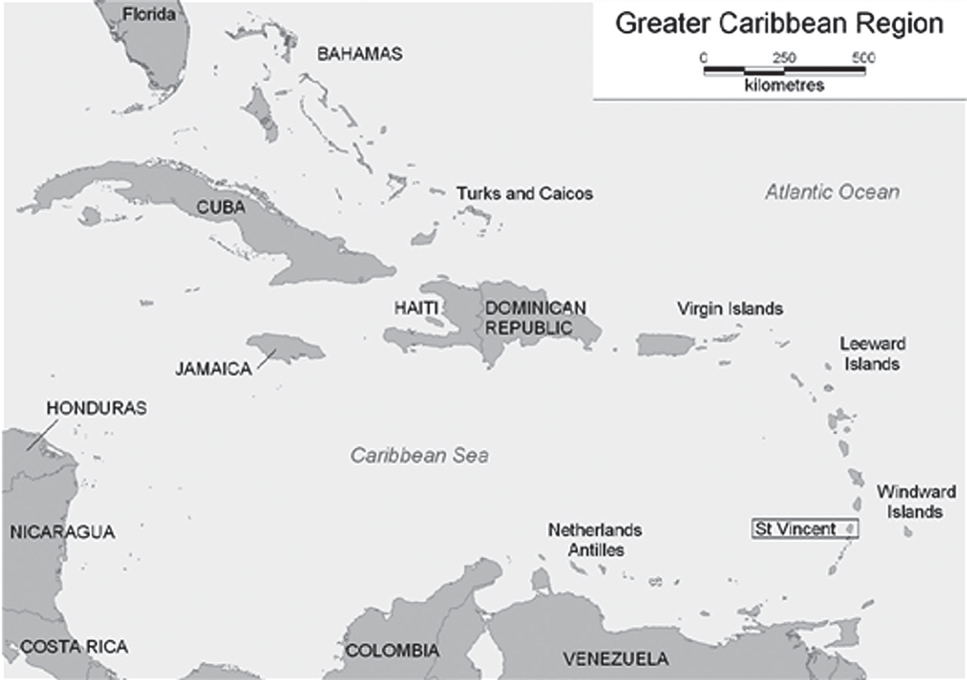
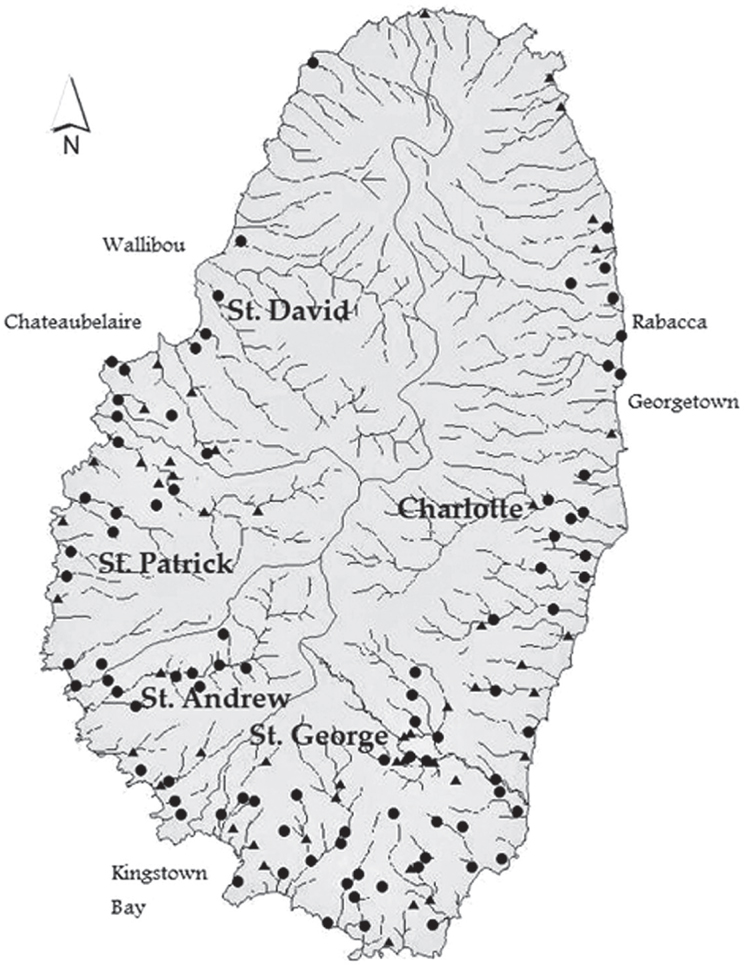
This article uses a panel data set comprising estates from SVG to estimate the effect of agent operation on estate productivity. Two principal sources are used. Information about an estate’s agency status is derived from the “registry returns,” compulsory registries of slave ownership in the British West Indies which were introduced between 1812 and 1819 to police enforcement of the abolition of the transatlantic slave trade and to regulate inter-colonial movements of slaves (Higman Reference Higman1984). The person making these returns was required to declare “the right or character in which the party making such Return holds possession of and claims title to such Slave or Slaves, namely whether as Proprietor, Lessee, Mortgagee, Sequestrator, Guardian, Committee, Trustee, Receiver, Executor, Administrator, Attorney, or otherwise” (Laws of St. Vincent 1884). Data for estate output and inputs are obtained from the “crop returns,” the primary purpose of which was to assess planters’ contributions to the parish levy (Laws of St. Vincent 1884). Maps of the Greater Caribbean Region and SVG are presented in Figures 1 and 2.
Greater Caribbean Region

St. Vincent: River Systems, Mills and Parish Boundaries. •: I. E. A. Kirby Estate Mill Locations that are Matched with Crop Returns; ▲: I. E. A. Kirby Estate Mill Locations that are not Matched with Crop Returns

Analysis proceeds in two stages. First, for the years 1801–1829, descriptive statistics are used to summarize trends in output and the number and proportion of estates on SVG that were operated by owners and managed by agents. These show that, over the period in question, SVG underwent a process of consolidation: the total number of estates on the islands fell by about a third, with smaller, owner-operated estates, based predominantly on the Grenadines and producing minor crops such as cotton, ceasing production. The number of slaves remained reasonably constant over this period and the proportion of estates operated by agents increased. Second, for the sugar plantations, we estimate the effect of agent operation on estate output for the years 1814–1829 to assess whether management by agents inflicted a penalty on estate performance by reducing output or estate revenue.
In contrast to existing studies that have tried to estimate the causal effect of a treatment variable on agricultural output (see, e.g., Udry (Reference Udry1996), who investigated gender effects on yields for farm households in Burkina Faso), we face a number of difficulties in estimating the econometric models. First, there is the problem of unobservable heterogeneity. As noted by Higman (Reference Higman2005), estates are likely to differ according to unmeasured, output-related factors such as soil quality, elevation, climate, and so on, which may be correlated with agency status. Second, there is the possibility of reverse causality in the relationship between output and agency. Estate owners are likely to have made decisions about whether to manage estates themselves or via an agent according to past and anticipated levels of plantation output and revenue. Some evidence to support this possibility appears in the historical literature. Kenneth Morgan (Reference Morgan2007, p.49) observes that “[B] y the time of the Napoleonic Wars a successful West India planter tended to be an absentee one”; Higman (Reference Higman, Engerman and Gallman1996, Reference Higman2005) notes that, once Jamaican estates reached a threshold size of 1,000 acres or 250 slaves, owners were liable to hand control to an agent and retire to Britain.
To address the first of these problems—unmeasured, time-invariant, heterogeneity across estates—we estimate a series of fixed effects panel data models using both estate output and estate revenue as dependent variables and contrast these with the results of pooled models estimated by ordinary least squares (OLS) which ignore the fixed effects.Footnote 2 To address the potential endogeneity of the agency variable, we carry out a qualitative and quantitative analysis of estates on which the owner died leaving no natural successor. If the death of owners in this manner resulted in the “as if” random allocation of estate operation to agents, then examination of the output profiles of estates on which these owners died can give some clues as to whether agent operation caused poorer estate productivity. We also use the death of owners in this manner to instrument the agency variable, in an attempt to recover a corrected estimate of the impact of agency on the dependent variables of interest. However, this approach comes with its own set of problems, notably the limited overall number of estates and the small sample of estates on which such deaths occurred.
Comparison of the results of the pooled models with those of the fixed effects models suggests strongly that time-invariant estate-level heterogeneity should be controlled for. The resulting fixed effects models provide no evidence that the productivity of agent-operated estates was worse than those estates that were owner-operated, nor is there evidence to suggest that productivity was better. These results are supported by our attempts to address the potential problem of endogeneity of the agency variable. We conclude that there is no evidence in our data set to suggest that estates managed by agents were less productive than those operated by their owners. The results therefore lend support to Higman’s and other revisionists’ attempts at rehabilitating the reputation of Caribbean agents for the region and period in question.
Sources of Data and Descriptive Analysis
Our data set encompasses the years 1801 to 1829, with no data available for the years 1825 and 1826 and limited information available for 1801–1803. The data set is compiled from two main sources. The “crop returns” (which cover the years 1801–1824 and 1827–1829) record annual declarations of slave numbers, estate size in acres, crop outputs, and details of land ownership at the time the source was compiled. The slave numbers recorded are numbers owned, not numbers employed; the sources do not offer breakdowns by employment category. Nor is the use of temporary hired slave labor detailed. In the Appendix, we argue that the use of jobbing gangs and other hired labor on SVG was less prevalent than in the case of other sugar producing colonies, thereby adding to the suitability of SVG as a case study. The “registry returns” are official documents monitoring the numbers of slaves on plantations in the years 1817, 1821, 1824, 1827, and 1830.Footnote 3
The crop returns are in three formats. First, a manuscript pocket book listing output of estates on SVG between 1801 and 1814, including ownership information in 1814, accessioned with “An Almanack Calculated for the Island of St. Vincent.”Footnote 4 Second, a printed book covering the years 1801–1818 and 1819–1824. This includes information on ownership in 1818 and 1824 and is entitled: An Account of the Number of Slaves Employed, and Quantity of Produce Grown, on the Several Estates in the Island of Saint Vincent and its Dependencies, from the year 1801 to 1818; and from that period to 1824, inclusive.Footnote 5 Last, a further printed book detailing crop returns for 1827–1829, including ownership information in 1829.Footnote 6 Crop return data are not available for the Grenadines prior to 1804.
The crop returns list estates by owner, together with annual crop output and information about the number of slaves, on pain of a penalty of £50 currency (Laws of St. Vincent 1884, pp. 200–14). A consolidating law enacted in 1821 required that these returns be submitted between the 1st and 15th of January each year and so a date of 31 January is assumed for all crop returns. We further assume that the recorded owner refers to the owner of the estate at the time the source was compiled, unless the estate ceased production before this date, in which case ownership information is deemed to refer to the owner of the estate at the last date for which output information for that estate is available.
The registry returns record the names of owners, returners, and details of slave numbers. That of 1817 is a full census of the enslaved population. Returns for 1821, 1824, 1827, and 1830 list between-registry return additions (mainly births) and losses (mainly deaths) to each estate’s population. The registry returns of 1817, 1821, 1827, and 1830 record agency status.Footnote 7
Taken together, these sources permit us to construct a panel data set with which to investigate whether agency adversely impacted the productivity of estates. For each sugar plantation in each calendar year between 1814 and 1829 (inclusive), the output of sugar, molasses, rum, the number of slaves on the estate, total acreage, and agency status were recorded, where available. Information on output and slaves is available in all years except 1825 and 1826. Information on acreage is available intermittently in all three of the crop return sources mentioned at the start of this section.
In creating the merged data set, the registry return data are mapped to the nearest crop return. So agency data from the registry return for 1817 are mapped to the crop return for 1817 because the registry return (dated 27 March 1817) is nearest to the crop return of that year (31 January 1817). Agency data for the remaining registry returns (dated 31 December 1821, 31 December 1824, 31 December 1827, and 31 December 1830) are mapped to the nearest crop return (31 January following).
The resulting, merged, data set contains, for the years 1814 to 1829 inclusive, an almost complete run of sugar output and slave numbers for each estate (1825 and 1826 excepted), with some missing values for acreage and agency status. An estate is defined as being operated by an agent when the registry return lists the returner as a manager, attorney or agent, trustee, executor, guardian or receiver/administrator, or tenant. If this information is not available, an estate is classified as being operated by an agent when the registry return records a name for the owner that is not the same as that of the returner or when it is possible to identify an agent from a previous or subsequent registry return. An estate is classified as being operated by an owner if the returner is classified as the owner, or if comparison within estates, over time, suggests this to be the case.
To fill in as many missing values as possible, we carried out an extensive review of the estate profiles and other sources. The most common reason for filling in missing values for the agency variable was when the names of the owners (and managers, where appropriate) of an estate were unchanged between two years in which they were recorded. We filled in missing values for estate acreage when they fell between years in which a constant estate acreage was recorded. Smith and Forster (Reference Smith and Forster2018) provide the data set used to derive the results of our main analysis, the Stata do file and additional online supplementary material.
Based on a comparison of the data set with the number of slaves recorded in the census years of 1817 and 1825, we estimate that it includes approximately 83 percent of the enslaved inhabitants on SVG. The remaining 17 percent were based in the port city of Kingstown and smaller settlements, working in crafts or domestic service outside the plantation sector.
The rest of this section contains a general description of estate characteristics and trends for the period 1801–1829, based on 4,163 observations on 215 estates. The econometric analysis uses sugar estates only, for the period 1814–1829. As a result, the sample size for the econometric analysis, at 1,454 observations on 108 sugar estates, is smaller.
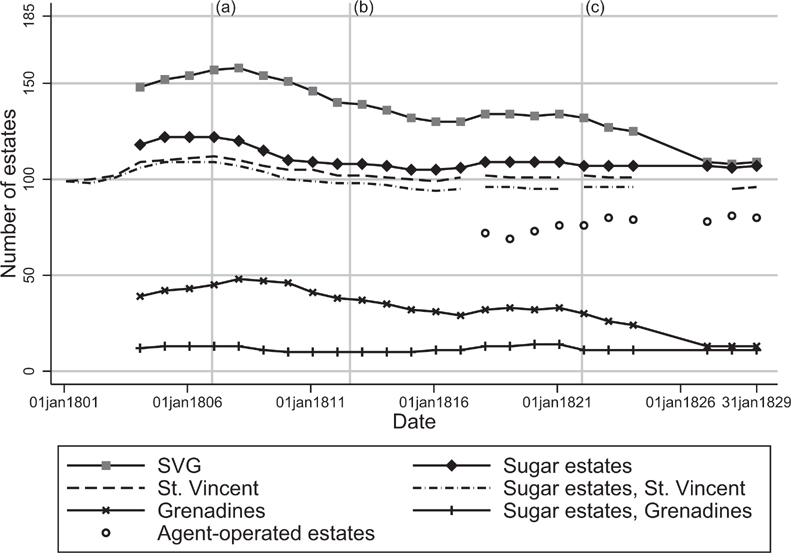
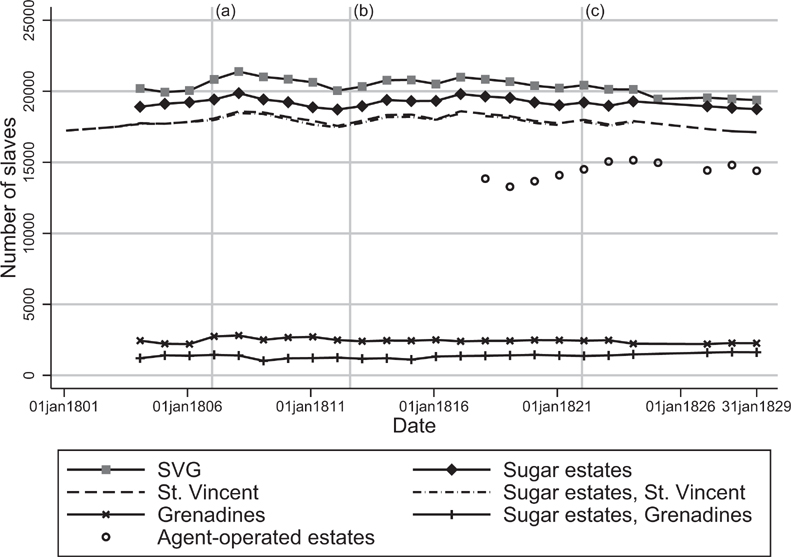
Figures 3 and 4 plot the total number of estates and slaves on the islands between 1801 and 1829, broken down by estate location (St. Vincent or the Grenadines). Three key events are noted: (1) the closure of the transatlantic slave trade in 1807; (2) the volcanic eruption of 1812 (described in Smith Reference Smith2010); and (3) a “trade shock” in 1822, when restrictions on West Indies exports to the United States were relaxed. The story told by the two figures is one of consolidation: smaller, owner-operated estates, based predominantly on the Grenadines and producing minor crops such as cotton, ceased production. The total number of estates declined over the period, from 148 in 1804 to 109 in 1829, but the number of slaves remained reasonably constant (20,195 in 1804, falling to 19,380 by 1829). In 1804, St. Vincent had approximately two-and-a-half times the number of estates than the Grenadines; by 1829, it had approximately seven times as many. Almost all of the estates on St. Vincent produced sugar. The number of slaves working for agents remained stable over time.
Number of Estates and Number of Estates Operated by Agents on SVG, 1801–1829, Based on Crop Return and Registry Return Data. Data for the Grenadines are Available from 1804
Notes: (a) closure of the transatlantic slave trade; (b) volcanic eruption; (c) trade shock.

Number of Slaves and Number of Slaves Working for Agents on SVG, 1801–1829, Based on Crop Return and Registry Return Data. Data for the Grenadines are Available from 1804
Notes: (a) closure of the transatlantic slave trade; (b) volcanic eruption; (c) trade shock.

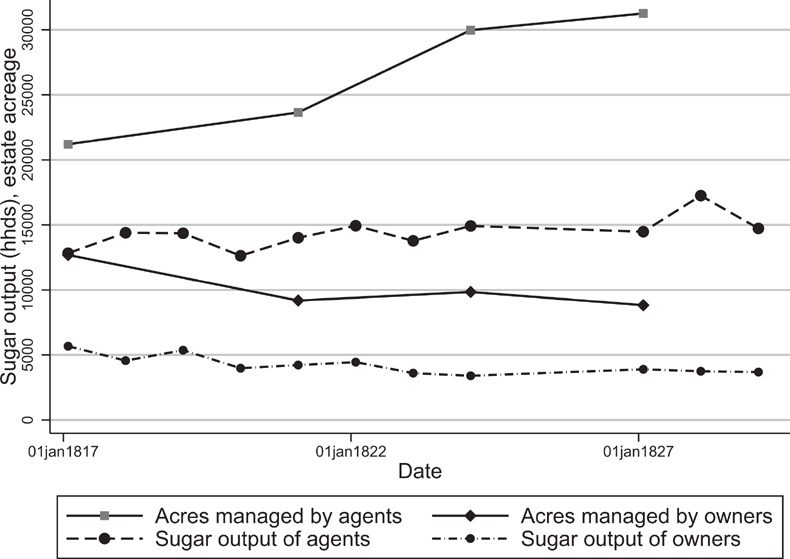
Although the number of estates operated by agents was largely unchanged during the period of investigation, the percentage of agent-operated estates increased (from 59 percent in 1817 to 74 percent in 1829) owing to the decline in the total number of estates. Figure 5 shows that the total output of sugar produced by agents, and the total estate acreage operated by agents, also increased between 1817 and 1827 (the period for which the most reliable agency and acreage information is available), while the total estate acreage managed by owners and the output of sugar produced by owners declined (the data series for sugar output have very low levels of missing data; those for estate acreage have higher levels and are therefore less trustworthy).
Acres Managed by Agents and Owners and Sugar Output of Agents and Owners, 1817–1829

Owners typically possessed a single estate and agents typically managed a single property. Owners and agents were also distinct groups: few owners ever acted as agents and vice versa. Data from the registry return of 1817 show that, when estates are compared according to agency type, there is little difference between the gender ratio (the proportions of male slaves on owner- and agent-operated estates are equal at 0.51), the average ages of males and females (26 years for owner operated estates and 27 years for agent-operated estates) and the proportion of slaves assigned to skilled occupations (0.15 on owner-operated estates and 0.13 on agent-operated estates).
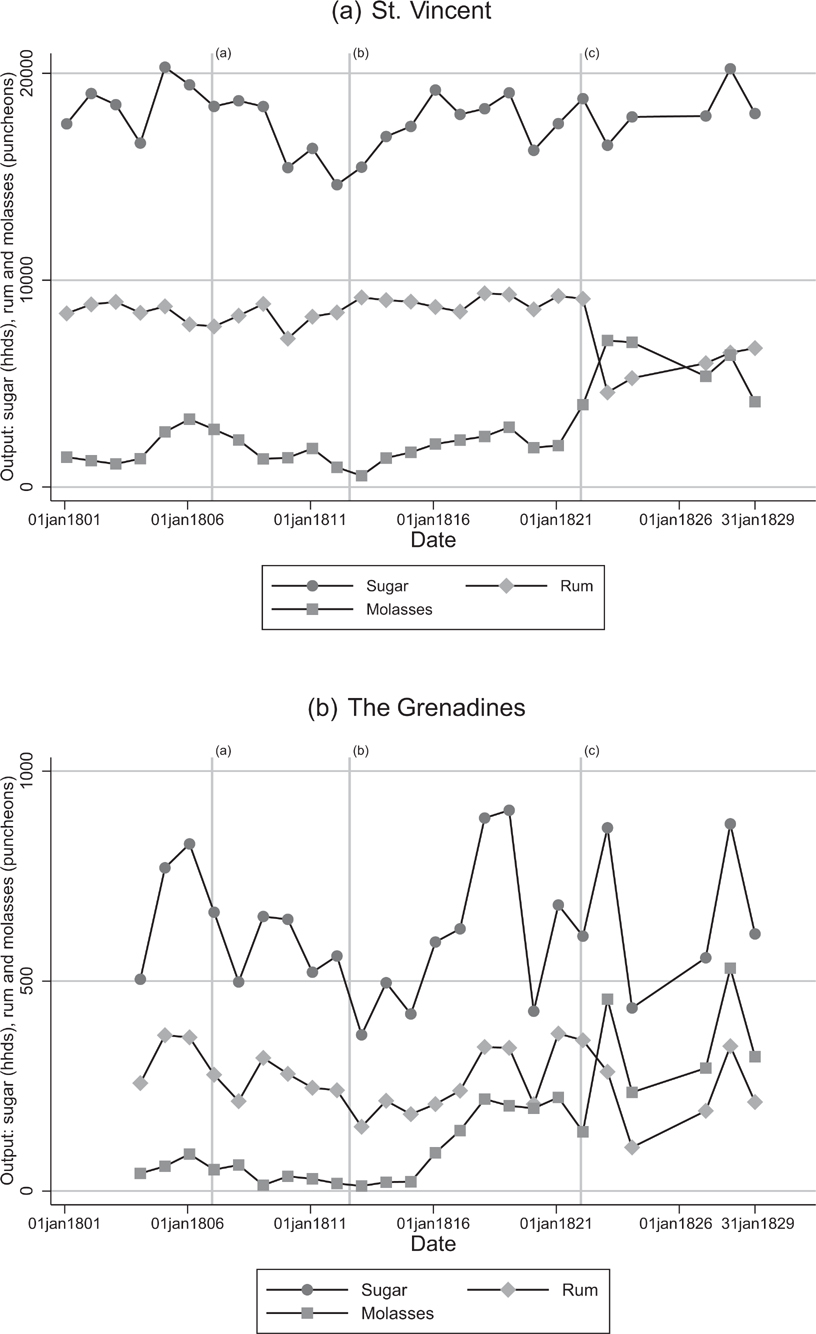
Figure 6 plots the output of sugar, rum, and molasses over time (note that the vertical scales in Figures 6(a) and 6(b) differ). Sugar output declined on both locations between 1805 and 1812. Thereafter, levels recovered but remained more volatile on the Grenadines, most likely due to greater variation in annual rainfall. The share of the three major staples grown on the smaller islands remained at around 10 percent. The minor staples of coffee and cocoa were confined to St. Vincent and cotton was produced only on the Grenadines. Analysis of the revenues generated by sugar, rum, and molasses shows that they accounted for around 97 percent of the colony’s exports in 1804 and 98.5 percent in 1824. In summary, sugar and sugar-related crops dominated production on the islands.
Output of Sugar, Rum and Molasses on SVG, 1801–1829, Based on Crop Return Data (Sugar is Measured in Hogsheads Containing 1,500lbs; Rum in Puncheons Containing 110 Imperial Gallons; Molasses in Puncheons Containing 100 Imperial Gallons). Vertical Scales Differ
Notes: (a) closure of the transatlantic slave trade; (b) volcanic eruption; (c) trade shock.

After 1822, rum production fell sharply in both locations, while molasses output increased. This shift from rum to molasses reflects advantageous trading conditions favoring the export of crude molasses as opposed to the distillation of rum. Export data for 1822, 1824, and 1827–1829 show that molasses were chiefly exported to Britain (82 percent market share), with North America and the United States providing a secondary outlet (15 percent). In contrast, rum’s largest market was North America and the United States (50 percent), with Britain occupying a supplementary position (27 percent share). A fall in the price of rum relative to molasses, coupled with the lifting of restraints on British–U.S. trade in 1822, boosted exports of molasses to the United States (Gayer, Rostow, and Schwartz Reference Gayer, Rostow and Schwartz1953, pp. 674–79, 719–20, 729–30; Ragatz Reference Ragatz1927, pp. 9–10; Cole Reference Cole1938; Davidson Reference Davidson1900, pp. 33–34).
Estimating Agency’s Effect on Estate Output and Revenue
Labelling the N estates by i, i = 1, …, N, and calendar year by t, the general equation under consideration is:
 ${y_{it}} = Agenc{y_{it}}\gamma + {x'_{it}}\beta + {v_i} + {\theta _t} + {\varepsilon _{it}}.$
yit is the output or revenue measure of interest for estate i in year t (either the output of sugar, measured in hogsheads, or estate revenue, measured in £, from the sale of sugar, molasses, and rum). Agencyit is equal to one if estate i is operated by an agent in year t and zero if it is operated by its owner, θt is a year intercept effect and, when used, factors of production (the number of slaves and estate acreage) are included in xit, which has coefficient vector β. vi is intended to capture time-invariant, estate-level, unobserved effects such as quality of land, altitude, climate, and so on, which are potentially correlated with both output and the other explanatory variables. The variable ϵit is an idiosyncratic disturbance term, while γ measures the difference in the average value of the dependent variable between agents and owners, controlling for the other regressors. The aim of the econometric analysis is to test the null hypothesis that γ is equal to zero, that is, conditional upon the values of other explanatory variables, there is no difference in the productivity of agent- and owner-operated estates. We test this null at the 5 percent significance level using a two-tailed test, thereby considering statistically significant departures from zero in a positive or negative direction as providing evidence of, respectively, an agency or owner premium.
Our econometric analysis starts with a comparison of the results of the estimation of equation (1), which we call the “OLS-fixed effects” (OLS-FE) model, with the estimation of “pooled” versions of equation (1) which omit the estate-level effects, vi, and include instead controls for estate location, defined as the parish in which the estate operated (for estates on St. Vincent) or the island on which the estate operated. We do this for two specifications, a parsimonious one which regresses yit on only the agency and calendar year variables, and one which estimates a Cobb–Douglas production function, regressing the natural logarithm of yit on the same regressors plus the natural logarithms of both the number of slaves on the estate and the acreage of the estate.
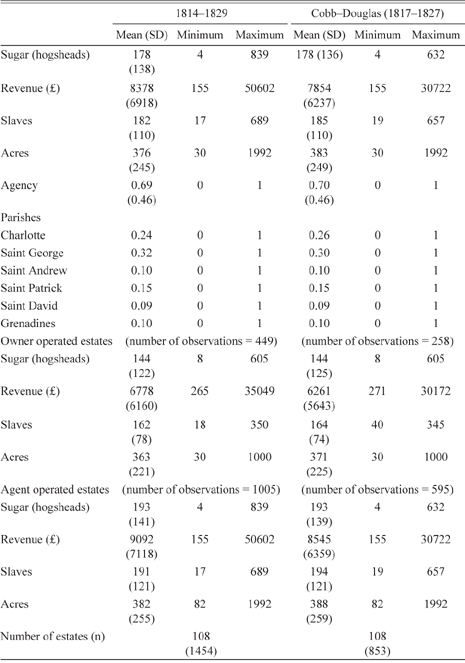
Table 1 presents summary statistics for this analysis. The data set for the regressions of output on agency status alone, controlling for calendar year, spans 1814–1829 and comprises 1,454 observations on 108 estates. Of these 108 estates, 49 were always operated by agents, 13 were always operated by owners, and 46 changed ownership regime (eight switched from agent- to owner-operation, 27 from owner- to agent-operation, and 11 estates witnessed multiple switches). The data set that is used to estimate the Cobb–Douglas production functions covers the years 1817–1827 and comprises 853 observations on the same 108 estates. Observations are lost in this case because of missing acreage data before 1817 and after 1827.
Summary Statistics for the Variables Used in the Econometric Analysis

Notes: Statistics for estate acreage are based on fewer observations than those noted owing to missing values.
Source: See Footnote footnotes 3–Footnote 6.
The number of slaves on an estate ranges from 17 to 689, the size of estates from 30 to 1992 acres, sugar output from four hogsheads to more than 800 and estate revenue from £155 to £50,602. Restricting the period of investigation for the Cobb–Douglas models does not change the sample means and standard deviations of the variables to any great degree. Table 1 also breaks down the size, revenue, and output of estates by agency status. Consistent with the observations of Morgan (Reference Morgan2007) and Higman (Reference Higman, Engerman and Gallman1996, Reference Higman2005), agent-operated estates were larger, on average, than owner-operated ones and produced higher average volumes of sugar and revenue.
The advantage of using estate revenue instead of the output of sugar as the dependent variable is that it models an estate’s ability to produce the correct “mix” of outputs, given their relative prices (Kumbhakar and Lovell Reference Kumbhakar and Lovell2000). The downside is that it requires the use of an appropriate price series, and sugar and its related crops were sold in various markets, including Britain, the United States, and British colonies within the Americas. We chose as a revenue output measure the sum of the value of the sugar, rum and molasses output at constant London prices for domestic and imported goods (using the Gayer–Rostow–Schwartz wholesale commodity price index as a deflator, see Mitchell (Reference Mitchell1988)).
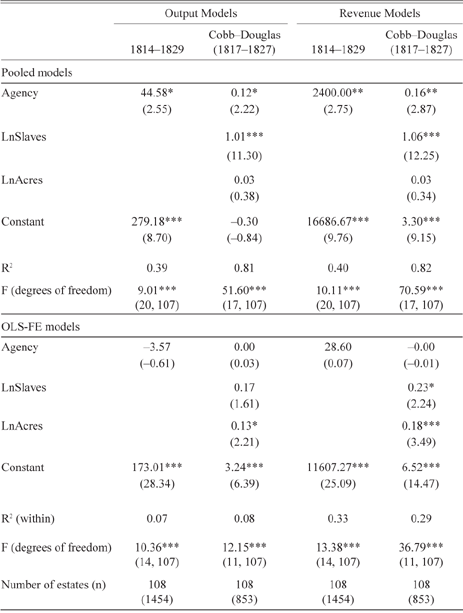
Results of the pooled and OLS-FE models are shown in Table 2 (crop year effects are not reported). Standard errors are clustered at the level of the estate in all models. The results of the pooled models show a large, positive, and statistically significant coefficient on agency, suggesting that estates operated by agents had higher average levels of sugar output and revenue than those operated by their owners. However, the OLS-FE results show that this effect disappears when the estate-level fixed effects replace the location effects: only two of the four OLS-FE models in Table 2 suggest a beneficial impact of agent operation on output, but estimates of the agency premium, at around 0.2 percent, are small in sizeFootnote 8 and none are statistically significant at traditional levels.Footnote 9 This contrast between the agency effect for the pooled and the OLS-FE models is evidence that agents were found on estates that were more productive, on average: omitting estate-level effects in the pooled models, and controlling instead for parish or island location only, leads to upward bias in the parameter estimate for agency.
Results of Pooled and OLS-FE Models

* = Significant at the 5 percent level.
** = Significant at the 1 percent level.
*** = Significant at the 0.1 percent level.
Notes: Also included but not shown are calendar year dummy variables and controls for estate location (the latter for pooled models only). t statistics in parentheses, using standard errors clustered at the unit of observation (estate).
Source: See Footnote footnotes 3–Footnote 6.
Regarding the additional covariates that are included in the Cobb–Douglas OLS-FE models, the evidence suggests decreasing returns to both factors of production (estimated elasticities for the number of slaves are 0.17 and 0.23 in the output and revenue models, respectively; those for estate acreage are 0.13 and 0.18). Tests that the sum of the parameter estimates for the factors of production are equal to one (not reported) are rejected, signalling decreasing returns to scale. The higher R2s for the revenue models suggest that they fit the data better than the output models.
The inclusion of estate-level fixed effects is intended to control for one form of endogeneity, that relating to omitting time-invariant confounding factors at the level of the estate that are correlated with both the agency variable and the dependent variable. However, this is not the only kind of endogeneity that may be present. For example, as described earlier, Higman (Reference Higman, Engerman and Gallman1996, Reference Higman2005) and Morgan (Reference Morgan2007) note that larger estates were more likely to be operated by agents, with the owner living in Great Britain. That agents tended to be found on larger estates is supported by the summary statistics reported in Table 1. If agency status in one year is partially determined by estate output in previous years, then the agency variable is endogenous and parameter estimates for the effect of agency on output will be biased and inconsistent even in the presence of the fixed estate-level and calendar year effects. The same is true for the variables representing the factors of production: feedback from output in one year to changes in the chosen combinations used in future years will mean that these too are endogenous. In the analysis which follows, we concentrate on the most parsimonious models—those which omit the factors of production—and use a combination of approaches to try to identify the effect of agent operation on the dependent variable.
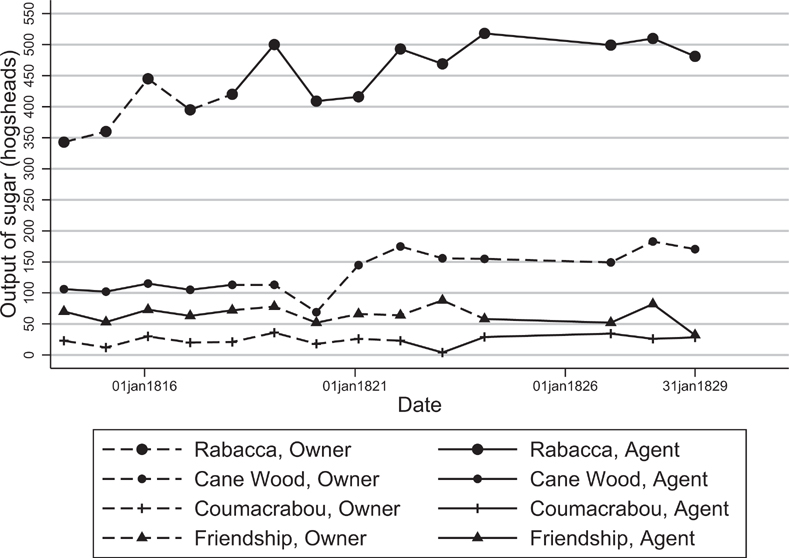
Figure 7, which shows the levels of sugar output over time, together with regime switches, for four estates, highlights the problem of potential endogeneity owing to reverse causality for agency. Rabacca is owner-operated until 1818, when an agent takes over. Its output profile fits well with the idea that successful owners handed over the management of their estates to agents: the estate is large and output grows during the years in which it is managed by its owner, prior to an agent taking over. Cane Wood is agent-operated until 1818, when it switches to owner-operation. Friendship is also operated by an agent until 1818, it is owner-operated between 1819 and 1824 before switching back to agent operation. The reasons for the regime switches for these three estates are not known. In contrast, the final estate, Coumacrabou, is managed by its owner, George Young, until he died in 1822 leaving no successor to take over estate management, so that an agent was appointed.
Four Estate Profiles Showing Switches in Management Regime

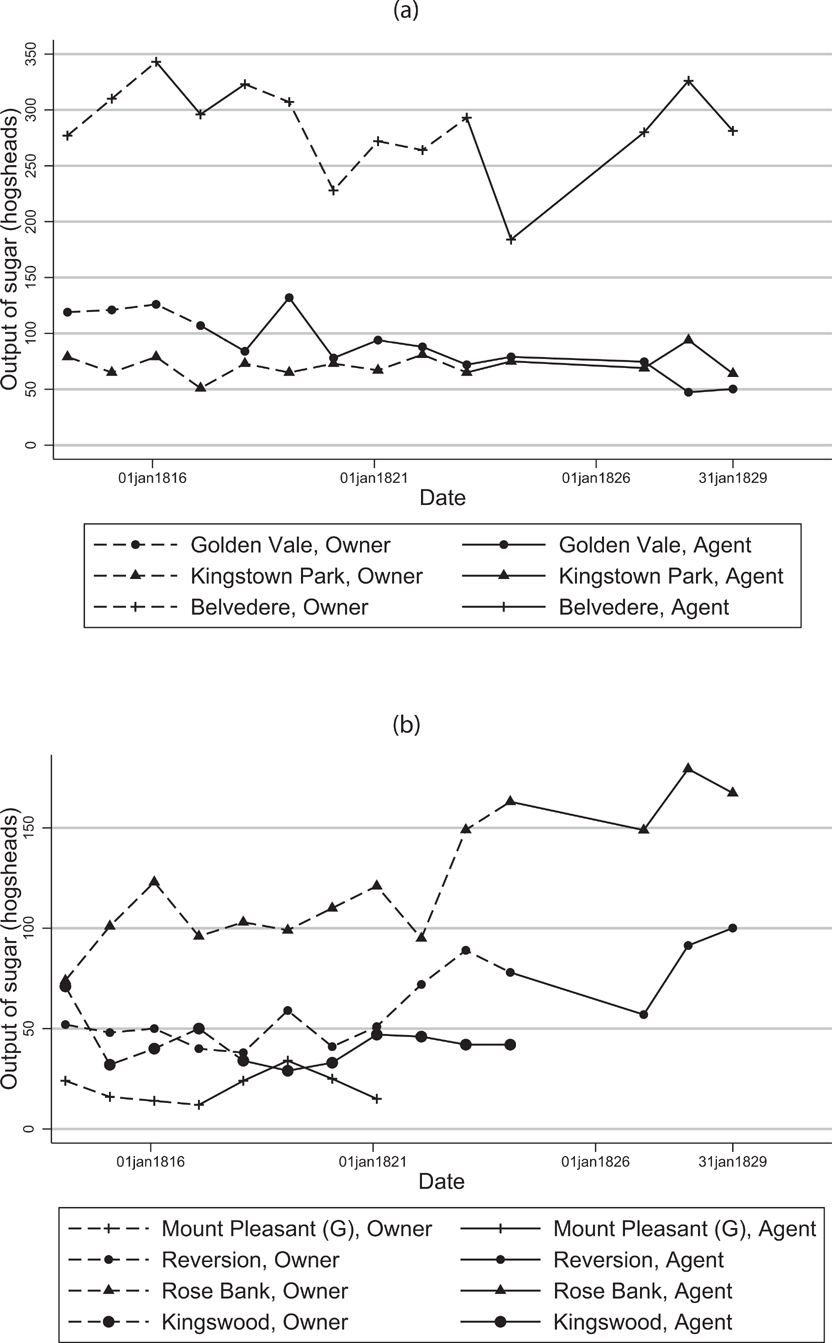
In addition to Coumacrabou, we were able to identify seven other estates upon which an owner who was operating the estate died leaving no successor to take over the estate management. Their profiles are shown in Figures 8(a) and 8(b). Belvedere’s ownership was disputed in 1817 and 1818, following the death of one of the joint owners, and our best assessment of the sources is that it was operated by an agent during this time, after which it was operated by its owner, John McCaul, who died in 1823, leaving no successor. There is a “dip” in output that accompanies the switch from owner-managed to agent-operated upon the death of John McCaul, after which output recovers. On Golden Vale, Kingstown Park, and Kingswood, the appointment of an agent following the death of the owner leaving no natural successor appears to make little difference to output levels. For Rose Bank and Reversion, average output is higher following the death of the owner and appointment of the agent.
Seven Estates on which Owner Died Leaving no Natural Successor (Profile for the Eighth such Estate, Coumacrabou, is Shown in Figure 7)

Overall, putting aside the “dip” in output which follows the death of some owners who left no heir to take over the operation of the estate, there is little evidence in Figures 7, 8(a), and 8(b) that the change to agent operation harmed output following such deaths. If the deaths of owners leaving no natural successor occurred in an “as if” random manner, that is, they can be considered to be exogenous in the context of the estimation of equation (1), there would be the potential to carry out an instrumental variables analysis to estimate a causal effect for agent operation on output. This would need to condition on any direct effect on output that a death might bring to an estate, as evidenced by the “dip” which is observed for some estates. The idea of using death as an instrumental variable is not new, as work by Laksmhi Iyer (Reference Iyer2010) and Paul Frijters, David Johnston, and Michael Shields (Reference Frijters, Johnston and Shields2014) shows.Footnote 10 However, IV analysis is biased in small samples, which poses a problem for our analysis given that we observe only eight estates in which such a switch of management regime took place, and we have only 108 estates in total in our sample.
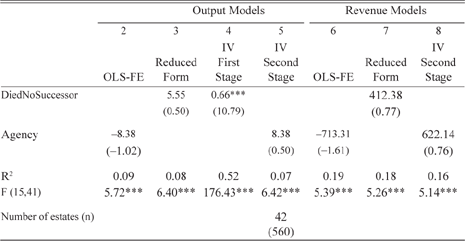
Nevertheless, to provide a quantitative assessment of the story told in Figures 7, 8(a), and 8(b), we defined the variable DiedNoSuccessorit, “Owner has died leaving no natural successor,” equal to one if the owner of an estate had died leaving no natural successor in a previous year, and equal to zero otherwise. We reestimated equation (1) replacing Agencyit with DiedNoSuccessorit, together with dummy variables for the year of death and the year following death, to control for any direct effects on output induced by the death of the owner. We did this for the subsample of the 42 estates that were operated by their owners when first observed, the idea being that these represent a “non-treated” subsample of the overall sample, where by “treatment” we mean “operated by an agent.”
Results of the estimation of this model are reported in columns 3 and 7 of Table 3, and show that the death of an owner leaving no natural successor led to an estimated increase in output/revenue which was not statistically significant at the 5 percent level. With the caveats about instrumental variables analysis in mind, we also report the results of an instrumental variable analysis using the same subsample, in which the agency variable in equation (1) is instrumented by the variable DiedNoSuccessorit using two stage least squares (2SLS).Footnote 11 It is the case that, in the subsample of interest, all estates on which the owner died leaving no natural successor switched to agent operation, but some estates for which the owner did not die leaving no natural successor “crossed-over” from being operated by their owners to being agent operated, for reasons unknown.
OLS-FE, Reduced form and IV-2SLS Results for the Subsample of Estates which were Owner-Operated when First Observed

* = Significant at the 5 percent level.
** = Significant at the 1 percent level.
*** = Significant at the 0.1 percent level.
Notes: Also included but not shown are calendar year dummy variables and dummy variables for the year of death of an owner leaving no natural successor and the year following death. t statistics in parentheses, using standard errors clustered at the unit of observation (estate).
Source: See Footnote footnotes 3–Footnote 6.
Table 3 reports the results of these models in columns 4 (first stage regression of Agency on DiedNoSuccessor for both the output and revenue models), 5 (second stage regression for the output model), and 8 (second stage regression for the revenue model). The OLS-FE results for this subsample are reported in columns 2 and 6. Compared with the OLS/FE results, the parameter estimates for agency in the IV models change sign, from negative to positive, but do not become statistically significant. These results should be treated with caution for the reasons given earlier. Considered alongside the estate profiles plotted in Figures 7, 8(a), and 8(b), there is no suggestion that agent operation harmed estate output and revenue.Footnote 12
We conclude with a brief analysis of alternative specifications, and whether results are sensitive to them. First, we investigated the robustness of the results in Table 3 to dropping the small number of estates which are not observed for the full period of investigation. Second, we tested for an island-specific trend by interacting the two dummy variables for the islands of Bequia and Mustique with the dummy variables for calendar year and including these as additional regressors in equation (1). Third, we reclassified estates from agent to owner operated where the owner and returner were different people but shared the same surname, in case there was a family tie which meant that the “agent” could be considered to be a joint owner. None of these changes made a major difference to our results.
Discussion
The two branches of the “perils of agency” literature that were discussed in the Introduction can now be revisited in the light of our results. Following the conclusion of the Second Carib War (1795–1797), the last remaining tracts of land on the windward side of St. Vincent were brought into cultivation, closing the agricultural frontier of SVG. Thereafter, new sugar estates could only be created through merging or sub-dividing existing properties, or discontinuing minor staples, as cane cultivation entered its mature phase. The opportunity for industrious settlers to become planters, therefore, receded. By the early nineteenth century, the mean age of owners lay between 52 and 54 years, reflecting the tendency of planters to acquire estates through inheritance or marriage and hold distant assets as absentees, habitually resident in the United Kingdom (Smith Reference Smith2013). Our basic descriptive analysis of the data set shows that agents tended to be in charge of estates that were larger, and the large bias showing an agency premium that is reported in the pooled models disappears when fixed estate-level effects are included. These results lend support to the findings of Morgan (Reference Morgan2007) and Higman (Reference Higman, Engerman and Gallman1996, Reference Higman2005), namely, that agents tended to be employed on the larger, more successful, estates.
The older, censorious, literature that was discussed in the Introduction predicts that opportunities were created for unscrupulous agents to embezzle and defraud owners. Conversely, for the revisionists (led by Higman), niches were created for managers to occupy with knowledge and energy at least equal to that of their employers. The data discussed earlier, detailing estate characteristics and trends between 1801 and 1829, is not consistent with a stagnant plantation economy burdened by management inefficiency. Cultivation of minor staples on smaller plantations declined, concentrating production on larger estates. As shown in Figure 6(a), the output mix of molasses and rum was highly responsive to a trade shock in 1822 following the temporary lifting of restraints on trade with the United States. Also of note is St. Vincent’s successful and speedy recovery from the impact of an extreme volcanic natural hazard in 1812 (Smith Reference Smith2010).
Results of the qualitative and quantitative analyses dovetail with these descriptive findings and provide no evidence to suggest that agents performed less well than owners, on average. The OLS-FE results do not support the charge of poor agent productivity compared to owners, and examination of Figures 7, 8(a), and 8(b) and the estates that switched to agent operation following the death of owners who left no successor show that, although output “dipped” on some, there was no general downward trend once the agent took over. The regressions that we run on the subsample of estates that were owner operated when first observed, instrumenting for the agency variable in equation (1), confirm the qualitative message. As already noted, the results of the econometric analysis must be treated with the caution that comes with attempting causal inference with historical, non-experimental, data sets, which possess a very limited range of variables and which therefore present limited opportunities for the deployment of methods to overcome the problem of bias and inconsistency that accompanies the presence of endogenous regressors.
What mechanisms may be responsible for results suggesting that estates under the control of agents performed no worse than those supervised by owners? The Introduction outlined revisionary interpretations of agency, centred on Higman’s account of the emergence of managerial hierarchies on Jamaica. Studies of the principal-agent problem elsewhere in the Atlantic economy, particularly control systems within chartered companies, demonstrate the effectiveness of more efficient contract design and robust accounting techniques in countering managerial abuses (Carlos and Nicholas Reference Carlos and Nicholas1990). There is evidence that similar solutions were developed on absentee owned West India plantations. Use of bonds and staged salary rises can be documented in Barbados, the closest British colony to St. Vincent. On estates operated on behalf of the Lascelles family, for example, three-year contracts with graduated performance bonuses were offered during the 1790s. Agents were also required to enter into a bond to incentivize good performance. More broadly across the Caribbean, a combination of higher salaries and commission bonuses were being offered by the end of the eighteenth century to attract and retain experienced managers (Smith Reference Smith2006, pp. 235–36; Carrington Reference Carrington1999, p. 30).
Studies of accountancy practices likewise document the appearance of more detailed plantation records over this period and the development of specialist bookkeeping staff on larger estates. Studies by Higman (Reference Higman2005, pp. 94–133), Justin Roberts (Reference Roberts2013, pp. 56–68), and Richard Fleischman, David Oldroyd, and Thomas Tyson (Reference Fleischman, Oldroyd and Tyson2011, pp. 767–70) examine the appearance of increasingly detailed listings of population inventories, along with crop accounts, statements of expenses, and plantation journals recording slave work logs. These authors examine the use of such instruments in monitoring estate performance and guiding owners over decisions such as the acquisition or sale of properties and slave purchases from neighboring properties. The flow of quantitative information complemented the regular exchange of correspondence between managers and owners. A common feature of the revisionist literature is its reliance on the archival survival of records describing activities on particular properties. Higman’s conclusions, for example, are anchored on two principal Jamaican case studies: Golden Grove and Montpellier estates. Roberts similarly makes extensive use of plantation journals for selected estates: two Barbadian and two Jamaican properties. Our findings complement this research, since the dataset supplies what is missing from these studies: repeated sampling of all working plantations within a colony to estimate whether entrusting estates to agents attracted a premium or a penalty.
We are conscious that our results are local to estates on SVG during the early nineteenth century and that generalizing the findings to other colonies and different periods is risky. Nevertheless, we believe that the mature stage of cane cultivation attained on SVG, creating conditions potentially ripe for agent misbehavior, adds to the significance of our findings. Hence we consider that our results provide some support to Higman’s and other revisionists’ attempts at rehabilitating the reputation of Caribbean agents, insofar as it relates to the productivity of plantations on SVG, during the early nineteenth century.
Appendix: Rental of Slaves
Renting of slaves took place on SVG during the study period, as it did elsewhere in the Caribbean. The standard hiring rates on St. Vincent during the late eighteenth/early nineteenth centuries were 3s per day, £12–16 per year, and £7 per task per acre (Cateau Reference Cateau and Thompson2002, p. 105). These rates reflect the three main types of hire: daily rates for skilled artisans (mainly in urban settings; Kingstown in the case of St. Vincent); rental of slaves attached to other estates with surplus labor for periods of several months or years; hiring of jobbing gangs to complete specific tasks (e.g., woodland clearance, assistance at peak times such as harvest, or holing cane fields to supplement an estate’s own field gangs).
Our evidence for limited use of hired estate labor comes from the registry returns for 1817 and 1822 and the compensation claims for 1833–1834. The former source indicates that long-term rental (at the rate of £12–16 per year) was rare; the latter indicates that the availability of jobbing gangs for hire (at the rate of £7 per acre) was also limited. The 1817 registry lists 21,623 enslaved persons. Of these, only 126 are described as “hired,” only 195 as “leased,” while a further six are described as being “off the property.” The registries also enumerated individuals not permanently attached to estates, but who were “currently on” a named estate. In 1817, there were 23 such registrations, comprising 504 individuals, of whom 104 were currently on a single estate: North and South Union in Charlotte Parish (TNA, T71/493). The 1822 registry includes 22 registrations of this kind, with 95 on Union, but not permanently attached to this property (TNA, T71/495). Later registries do not give comparable information. For Union, the registry returns for 1824, 1827, and 1830 lie within four of the corresponding crop returns.
Turning to the compensation claims, nearly all awards made by the commissioners in 1833–1834 for claims of 50 or more slaves were for slaves attached to specific estates. The exceptions are two Kingstown awards meeting claims arising from maritime businesses. Jobbing gang sizes most likely ranged between ten and 50 slaves. Fifty-seven awards falling into this range were made outside of Kingstown, providing compensation for a total of 801 enslaved individuals. A further 13 awards were made for groups within Kingstown, comprising 357 persons. These awards were not necessarily for rentable slaves. The term “jobbing” does not appear at all in the records and claimants included owners of artisan workshops and suppliers of domestic services, particularly within the island’s main town.
The registry and compensation records, therefore, provide a likely upper-bound (c.800) and lower-bound (c.325) of the number of hired slaves. These estimates compare with a total population of 21,317 enslaved persons living on estates at the 1817 census date, including 12,621 field laborers. Rented slaves are, therefore, equivalent to 1.5 and 3.75 percent of total estate population (or 3 and 6 percent of field slaves). On Jamaica, where jobbing gangs are more extensively documented, Higman estimates that only 6.4 percent of the enslaved population of 313,000 were allocated to this type of unit in 1832 (Higman Reference Higman1976, p. 16). Our conclusion is that the lower-bound is the figure most likely to be applicable to St. Vincent.Footnote 13