Implications
Improving sow welfare starts with assessing sow welfare. Among the many components of sow health and behaviour related to welfare, locomotor disorders proved to be a major issue. Until now, lameness in sows has been measured using only subjective visual scoring scales. Although they are easy to use and cheap to implement on commercial farms, their reliability is often an issue depending on the number, the training and the experience of the observers. To adequately assess lameness in sows, quantitative and reliable methods need to be developed. This study aims to compare several techniques of assessing indicators, which could be related to lameness such as posture, gait, footprints and foot lesions.
Introduction
For more than 20 years, the average annual removal rate of reproductive sows has been ∼50%, with lameness accounting on average for 10% to 20% of all removals (D'Allaire and Drolet, Reference D'Allaire and Drolet2006; Anil et al., Reference Anil, Anil and Deen2009). Locomotor problems are also a major cause of euthanasia and may represent a welfare concern (D'Allaire and Drolet, Reference D'Allaire and Drolet2006). This involuntary culling increases monetary losses due to the cost of replacing animals and increase in non-productive days (D'Allaire et al., Reference D'Allaire, Stein and Leman1987). Finally, a recent study revealed that lame sows have less piglets born alive than non-lame sows (Anil et al., Reference Anil, Anil and Deen2009). Lameness results from various pathologies or injuries to the foot, the bones or the joints (Wells, Reference Wells1984; Dewey et al., Reference Dewey, Friendship and Wilson1993) such as foot injuries, broken legs, osteochondrosis, arthrosis or arthritis (D'Allaire and Drolet, Reference D'Allaire and Drolet2006). These locomotor problems have several causes and are related to genetics, body conformation, nutrition, housing (especially floor condition) and exercise level (D'Allaire and Drolet, Reference D'Allaire and Drolet2006). Leg disorders are a major welfare problem because they cause pain and depress body condition (Wells, Reference Wells1984; Bonde et al., Reference Bonde, Rousing, Badsberg and Sørensen2004). Therefore, early detection of lameness is important to improve animal welfare and productivity and to provide early treatment to animals.
The most common method to quantify lameness in farm animals is the visual scoring. In pigs, Main et al. (Reference Main, Clegg, Spatz and Green2000) developed a detailed 6-point scoring system. Gait visual scoring has the advantage to be low cost and easy to use on farm, but it remains a subjective method with poor reliability, depending on the training or the experience of the observers (Main et al., Reference Main, Clegg, Spatz and Green2000; O'Callaghan et al., Reference O'Callaghan, Cripps, Downham and Murray2003). Therefore, there is a need to develop more objective methods for studying locomotor problems in pigs. Several approaches and methodologies may be used. Kinetics and kinematics have been largely used in horses and cows. Kinetics aims to relate motion of bodies to its causes and takes into account dynamic forces and acceleration. It is often studied using force plates or pressure mats to measure weight distribution on claws and limbs (Van Der Tol et al., Reference Van Der Tol, Metz, Noordhuizen-Stassen, Back, Braam and Weijs2003). Kinematics consists in analysing movements without considering its causes. It is studied using video recording where the subject's body is schematised with markers. Both of these methods have been used in pigs to evaluate gait and study the impact of floor friction level (von Wachenfelt et al., Reference von Wachenfelt, Pinzke and Nilsson2009), but they have never been used to quantify lameness in sows yet. Footprint analysis using high-resolution floor mat to record foot pressure has also been used to analyse gait in pigs, to compare different floor friction and identify which region of the claw is the most subject to stress (Carvalho et al., Reference Carvalho, de Alencar Nääs, Mollo Neto and Souza2009). Although these methods provide precise information on gait, they are quite time-consuming and technically complex. On the other hand, data loggers have been successfully used to study lameness in cows (Pastell et al., Reference Pastell, Tiusanen, Hakojärvi and Hänninen2009) and horses (Keegan et al., Reference Keegan, Yonezawa, Pai and Wilson2002). Changes in the normal pattern of lying down or standing up are also useful indicators of locomotor disorders (Buddle et al., Reference Buddle, Madec and Fourichon1994a; Bonde et al., Reference Bonde, Rousing, Badsberg and Sørensen2004). These various quantitative methods proved their utility to evaluate gait, postures and lameness in cows, horses and dogs, but none of them have been validated to quantify lameness in sows. Therefore, the objective of the present study was to develop and compare several methods to quantify lameness in ambulatory sows: gait analysis using kinematics, footprint analysis, stepping and postural behaviour using accelerometers, lying-to-standing transition observation and visual assessment of foot lesions. These methods were compared with a visual assessment of lameness as a reference.
Material and methods
Animals and housing
A total of 50 Yorkshire (n = 8) or Yorkshire × Landrace (n = 42) sows were selected from the experimental herd (170 sows) of the Agriculture and Agri-Food Canada Dairy and Swine Research and Development Centre, based on the visual evaluation of gait as described below (section ‘Visual gait scoring’). The selected sows were of different parities (35 primiparous and 15 multiparous) for a mean parity of 1.5 ± 0.9. Thirty-one sows were pregnant with a mean gestation day of 67.9, and 19 sows were not pregnant. They were housed in gestation stalls (n = 29; 0.64 × 2.10 m) or individual pens (n = 21; 1.50 × 2.40 m) with partially slatted floor. Animals were cared for according to the Canadian Council on Animal Care guidelines (Canadian Council on Animal Care, 2009), and procedures were reviewed and approved by an Institutional Animal Care Committee (Reference no. 308).
Measurements were taken once on each selected sow within a period of 1 week to assess their gait, footprints, foot lesions, postures, lying-to-standing transition and stepping behaviour. Sow gait was assessed using two methods: a visual scoring system and kinematics. Footprints were assessed on clay. Foot lesions and lying-to-standing transition were visually observed using standardised grids, and posture and stepping behaviour were measured using accelerometers. On the same week as for previous measurements, BW, limb length (front leg: from coronary band to the elbow articulation; rear leg: from coronary band to calcaneum), length of the body (from base of the ears to base of the tail), distance between flanks, backfat thickness at P2 of the last rib, visual body condition score according to a 5-point scale (Sow Body Condition Scoring Guidelines, National Hog Farmer, Minneapolis, MN, USA) and conformation of the limbs and the back (Larochelle, Reference Larochelle1999) were recorded.
Selection protocol: Visual gait scoring
The visual gait scoring system used a 5-point scale adapted from the 6-point scale by Main et al. (Reference Main, Clegg, Spatz and Green2000), with the intermediate scores 2 and 3 merged into one category. Sows were walked at a steady pace in a 20-m corridor of the gestation room and scored on the following 5-point scale by one trained observer (J.G.). Lameness categories were as follows:
1. sow walks with even strides and no gait problem is observed;
2. abnormal stride length is detected. Movements are no longer fluent but no obvious lameness is detected;
3. stride is shortened and lameness is detected. Swagger of caudal body is noticed as sow walks;
4. sow does not place affected limb on the floor;
5. sow is unable to move.
The purpose of the present study is to develop methods to detect and quantify lameness in ambulatory sows. Only sows with a score of 3 or lower were selected. Sows were classified into three different groups: non-lame (score 1; n = 21; 11 primiparous and 10 multiparous), mildly lame (score 2; n = 18) and lame (score 3; n = 11).
Footprint analysis
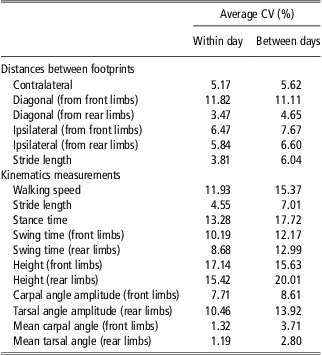
Footprints were measured using a corridor (4.9 × 0.64 m) with a floor covered with 2 cm of clay (white clay 106 C06-02, SIAL, Laval, QC, Canada). Sows were walked in the corridor and footprints were identified just after by putting stickers of different colours next to the footprints. A photo of the footprints was taken with a digital camera (Powershot A80, Canon Canada Inc., Mississauga, ON, Canada) and analysed with an image analysis software (Mesurim Pro 3.3, J.F. Madre, Académie d'Amiens, Amiens, France) to calculate stride length, contralateral distance (between right and left footprints of the front or the rear limbs), ipsilateral distance (between front and rear footprints of the same side) and diagonal distance (between front and rear footprints of opposite sides) for each foot (Figure 1). Distances were measured between the footprint of the limb considered and the next corresponding footprint of the tracks. For example, ipsilateral distance for the right front limb is the distance between the right front footprint and the next right rear footprint. The method was first validated for precision with 10 pictures of polygons drawn on the clay to simulate the layout of footprints. Coefficients of variation were 1.16% for linear length, 1.55% for wideness and 3.07% for angles. A second validation was made for the consistency of sow footprint characteristics using five sows walking three times a day, on two different days of two different weeks. The average reliabilities within and between days are shown as coefficients of variation in Table 1.
Tracks for two complete strides of a sow with the distances measured between footprints (examples of the rear left and the front left footprints). Limbs: RL = rear left, RR = rear right, FL = front left, FR = front right. Distances: S = stride length, Ip = ipsilateral distance, C = contralateral distance, D = diagonal distance.

Average CV within and between days for distances measured between footprints and kinematic measurements in sows

CV = coefficient of variation.
Kinematics
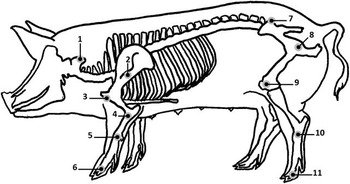
Kinematic measurements were taken on each side of each sow separately. Reflective markers made of a 12.7 mm plastic ball with reflective tape (B & L Engineering, Santa Ana, CA, USA) were stuck on 11 body sites with a double-sided Velcro® (Velcro USA Inc., Manchester, NH, USA) according to Figure 2. Sows were walked at a steady pace and without stopping in a corridor (16 × 0.8 m), delimited by a black metal wire netting covered with panels of clear acrylic glass (Industries SM Inc., Granby, QC, Canada) A digital video camera (uEye UI-1225LE-C, Imaging Development Systems GmbH, Obersulm, Germany) with lens (Pentax CCTV C418DX, 4.8 mm, 1 : 1.8, Pentax Ricoh Imaging Americas Corporation, Denver, CO, USA) was positioned perpendicularly to the corridor at a 5-m distance from its centre. Two spotlights (Pro light w/Lamp P2-101, 250 W, Lowel, Hauppauge, NY, USA) were placed on each side of the camera to light up the reflective markers. Gait of sows was recorded and digitalised for a 3-m distance at 60 frames per second. Videos were analysed using an automatic tracking program (Movias Pro, version 1.63g: 3D, NAC Image Technology, Simi Valley, CA, USA). Walking speed, stride length, swing time, stance time and foot height for each limb were calculated. Mean angle of carpal and tarsal joints, as well as angle amplitudes, were also calculated. This method was first validated for the consistency of sow gait characteristics by taking measurements on both sides for five sows, three times a day on two different days of two different weeks. The average reliabilities within and between days are presented as coefficients of variation in Table 1.
Position of the body markers used for kinematics. Front markers: 1, atlas; 2, scapula; 3, shoulder; 4, elbow; 5, carpus; 6, coronary band. Rear markers: 7, tuber coxae; 8, hip; 9, stifle; 10, tarsus; 11, coronary band (adapted from Thorup et al., Reference Thorup, Laursen and Jensen2008).

Posture and stepping behaviour
The standing posture of sows was recorded for a 24-h period according to a previously validated method (Ringgenberg et al., Reference Ringgenberg, Bergeron and Devillers2010), using one accelerometer (Pendant G Acceleration Data Logger, Onset Computer Corporation, Pocasset, MA, USA) fixed on a rear leg. Posture was recorded every 5 s and the percentage of time spent standing over 24 h was estimated. Two accelerometers fixed on both rear legs of the sows were also subsequently used to record vertical acceleration 10 times/s during 1 h, following the morning feeding (Ringgenberg et al., Reference Ringgenberg, Bergeron and Devillers2010). Acceleration data were thereafter converted to detect steps and standing posture, and then number of steps per minute while standing, and latency to lie down after feeding were calculated.
Foot lesions
Foot lesions were assessed using a visual scoring system adapted from the FeetFirst® Lesion Scoring Guide (Zinpro Corporation, Eden Prairie, MN, USA). Before scoring, feet were washed and a photo of the underside of the foot was taken while the sow was lying laterally, using a digital camera (Powershot A80, Canon Canada Inc., Mississauga, ON, Canada) at a standardised angle from the floor, lighting and distance from the feet. Each claw (medial or lateral) of each foot was scored on a 3-point severity scale for each of the seven following types of lesion or abnormality: heel lesion and overgrown heel, sole lesion, heel–sole junction lesion, white line lesion, side wall lesion, dew claw lesion and claw size. Side wall lesions and size of the claw were scored by direct observation of the foot and the remaining criteria were scored from pictures. The severity scale for lesions was defined as 1: no lesion; 2: lesion smaller than 1 cm; and 3: deep and severe lesion. The severity scale for claw size was defined as 1: difference between medial and lateral claw sizes ⩽25%; 2: difference between medial and lateral claw sizes >25%; and 3: excessive length of one or both claws. Data were analysed after transformation in binary variables (presence v. absence of lesion (i.e. scores 2 and 3 v. 1), presence v. absence of severe lesion (i.e. scores 3 v. 1 and 2)) for each type of lesion. Prevalence of a type of lesion or abnormality was calculated for each claw as the percentage of sows presenting the lesion considered. Finally, a sole–heel lesion score for each foot, ranging from 8 to 24, was calculated as the sum of heel, white line, sole and heel–sole junction scores on the two claws. A global foot lesion score, ranging from 14 to 42, was also calculated for each foot by adding all scores of the seven types of lesions on the two claws. The visual scoring system was first validated using pictures of 20 feet from five sows by two trained observers (J.G. and A.K.). The interobserver and intraobserver reliabilities were 76% and 83%, respectively.
Lying-to-standing transition
The lying-to-standing transition was observed using a specific test with a 4-point scale. The observer approached the sow and talked to her to incite her to get up. When the sow did not get up, the observer touched the rear of the animal with a paddle each 2 s for a maximum of 10 s. When the sow stood up, the observer scored the behaviour using the following scale: 1: stands up without hesitation; 2: takes more than 5 s to stand up; 3: shows hesitation, has to change position or lie down again before standing up; and 4: refuses to stand up or stays in a sitting position. The scale was first validated by two observers (J.G. and A.K.) using video recordings of 49 lying-to-standing sequences. The interobserver and intraobserver reliabilities were 96% and 96%, respectively.
Statistical analyses
A Principal Component Analysis (PCA) was performed with the PRINCOMP procedure of SAS (SAS, 2002) on all continuous data available for the four different limbs (i.e. kinematics, footprint analysis, global foot and sole–heel lesion scores) to analyse relationships between variables and between-limb characteristics. Effect of the position of the limb (front v. rear) on the same variables was analysed using the MIXED procedure of SAS with the limb as an experimental unit. Variables that were affected by the position of the limbs were thereafter analysed separately for front and rear limbs. Length of the body was highly correlated with all other anatomical characteristics (r > 0.55; P < 0.0001) and was used as a covariate in further analyses of distances between footprints and stride length measured with kinematics to take into account the size of the sow.
Prevalence of foot lesions was analysed for the effect of the position (front v. rear) and the side (left v. right) of the limb and the position of the claw (medial v. lateral) for each type of lesion using the GLIMMIX procedure of SAS with a binary distribution, a logit link function and the claw as the experimental unit. For each type of lesion, the effect of the presence of severe lesions (score 3) was analysed for each continuous variable available for different limbs (i.e. kinematics, footprint analysis and stepping), using the MIXED procedure of SAS with the limb as the experimental unit. Data obtained from footprints, kinematics, postures, stepping behaviour and global foot and sole–heel lesion scores were compared between sows with different gait visual score, using the MIXED procedure of SAS with the sow as the experimental unit. Only three sows were scored 2 or 3 for the lying-to-standing transition. Therefore, sows were categorised between sows that did or did not stand up, and data were analysed using χ 2-tests between the three categories of lameness. Effects of limbs and back conformation on degree of lameness were analysed using Cochran–Mantel–Haenszel χ 2-tests. To analyse further relationships between the various measurements collected, partial least squares analysis (PLS procedure) was used to relate lameness visual score (response variable) to other continuous variables at the sow level. The PLS analysis works by extracting successive linear combinations of the predictors, called factors, thereby optimally explaining both the response variation (lameness visual score) and the predictor variation (covariates). Successive PLSs were made by removing variables that had a weak contribution in fitting the PLS model for both predictors and response (variable importance for projection statistics: VIP < 0.8) and in the prediction of just the response variable (regression coefficient ∣B1∣ < 0.1).
Results
Data set description
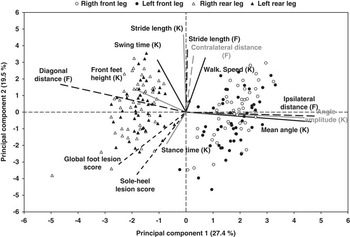
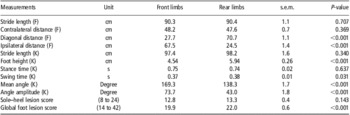
Sows weighed on average 223 ± 24 kg measured 151.1 ± 33.5 cm long, and their backfat thickness was on average 21.2 ± 3.9 mm (means ± s.d.). Their limb conformation score ranged between 0 and 18, with a mean of 13.6 ± 2.0 (mean ± s.d.). The PCA performed with all continuous variables available for the four limbs of each sow (Figure 3) revealed a clear division between the front and the rear limbs and between variables that were influenced by the position of the leg and the others that were not. In line with the PCA, results were significantly different between front and rear legs for diagonal and ipsilateral distances between footprints, swing time, mean and amplitude of the carpal and tarsal joint angles, foot height and global foot lesion score (Table 2). On the other hand, contralateral and stride distances between footprints, stride length and stance time measured by kinematics, as well as sole–heel lesion score, were not influenced by the position of the leg (Table 2). In further analyses, variables that were influenced by limb position were analysed separately for front and rear legs.
Results from the Principal Component Analysis on distances between footprints (F, long dashes), gait measurements using kinematics (K, solid line) and global foot and sole–heel lesion scores (short dashes) for the four limbs of 50 sows. The biplot of the first two principal components jointly represent 46.9% of the total variation.

Differences between front and rear limbs for distances between footprints (F), gait measurements using kinematics (K) and sole–heel and global foot lesion scores (least square means)

Foot lesions
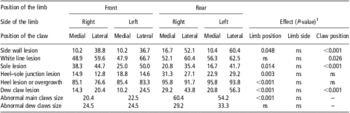
Percentages of sows affected by the different types of lesions on each of the eight claws are presented in Table 3. The presence of lesions was not affected by the side of the limb (left/right) for any type of lesion. However, all types of lesions, except the white line, were affected by the position of the limb (front/rear; P < 0.05). Side wall, white line, sole and dew claw lesions were also affected by the position of the claw (medial/lateral; P < 0.05). Generally, rear claws were more affected by lesions than front claws. The most frequent lesions were heel lesions or overgrown heels with more than 80% of the claws affected. Two-thirds of the sows had white line lesions on the lateral claws. Lesions of the side wall, the white line, the sole and the dew claws were more often observed on lateral than medial claws. Finally, the heel–sole junction was the least affected area (<30%).
Percentage of sows presenting lesions or abnormalities on the different claws of the four limbs

1ns: not significant; there was no significant interaction.
Considering the effect of the presence of severe lesions on the gait, footprints or stepping, only heel, sole and white line lesions had significant effects on some variables. The presence of severe lesions on the heel reduced swing time in front feet (0.33 ± 0.02 v. 0.37 ± 0.01 s; P < 0.05). The presence of severe lesions on the sole reduced diagonal distance from front feet (24.1 ± 1.6 v. 27.5 ± 0.9 cm; P < 0.05). Finally, the presence of severe lesions on the white line reduced sow walking speed (0.90 ± 0.02 v. 0.94 ± 0.02 m/s; P < 0.05), ipsilateral distance from front feet (64.2 ± 1.7 v. 67.6 ± 1.5 cm; P < 0.05) and diagonal distance from front feet (24.9 ± 1.2 v. 28.1 ± 1.0 cm; P < 0.05).
Comparison of sows with regard to their degree of lameness
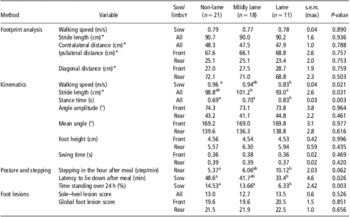
Results from the comparison between the degrees of lameness using the visual scoring system and the distances between footprints, the gait measurements using kinematics, the standing and stepping behaviour and the foot lesion scores are shown in Table 4. It can be noted that stride length and walking speed recorded using footprints were lower than those measured with kinematics. No significant differences were found between lameness categories established with the visual scoring system for distances between footprints. When looking at kinematic measurements, lame sows walked more slowly (−0.13 m/s) than non-lame sows. Lame sows had a shorter stride length than mildly lame sows (−8.2 cm; P = 0.009) and tended to have a shorter stride length than non-lame sows (−5.8 cm; P = 0.055). Lame sows had a longer stance time than mildly lame and non-lame sows (+0.13 and +0.14 s, respectively), but no significant differences were observed for the swing time. Measurements of average angle and angle amplitude were not significantly different between the three levels of lameness. The analysis of the posture over 24 h showed that non-lame and mildly lame sows spent about twice as much time standing than did lame sows. Non-lame sows also spent more time standing after feeding than did lame sows (+15.2 min). Finally, lame sows stepped twice as much around feeding than did non-lame sows. Foot lesion scores were not different between the three categories of sows. The observation of the lying-to-standing transition showed no difference between lame, mildly lame and non-lame sows, with 54.6%, 82.4% and 57.1% of sows that refused to stand up, respectively (P = 0.19). Finally, sow conformation analysis revealed that a higher proportion of lame and mildly lame sows had an arched back than non-lame sows (63.6%, 35.3% and 14.3%, respectively; P = 0.019).
Comparison between the three degrees of the lameness scoring system for distances between footprints, gait measurements using kinematics, posture and stepping behaviour and foot lesion scores (least square means)

a,bValues with different superscripts differ significantly P < 0.05.
*Sow length was used as a covariate in the analysis for these variables.
†Data presented are average values for front, rear or all four limbs or are relative to the sow.
Comparison between methods
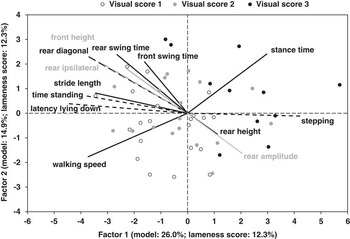
The PLS analysis first considered 23 variables measured using footprint analysis (stride length, contralateral distance, ipsilateral distances from front and rear footprints and diagonal distances from front and rear footprints), kinematics (walking speed, stride length, stance time, swing times for front and rear limbs, front and rear feet height, means and amplitudes of the angle of carpal and tarsal joints), accelerometers (time spent standing over 24 h, number of steps per minute while standing and latency to lie down after feeding) and foot lesion visual scoring (global foot lesion scores for front and rear feet and sole–heel lesion score). In this first PLS analysis, the first two principal factors accounted for 43.8% of the variability between sows of the different lameness scores. In further PLS analyses, 10 variables were removed because of their weak contribution in the modelling. The 13 remaining variables are presented in Figure 4, the first two principal factors explaining 40.9% of the variability between sows. Variables are distributed between two opposite groups according to the first factor. Variables for which lame sows have high values are grouped on the right side of the biplot, whereas variables for which they have low values are grouped on the left side. It can also be noted that black dots representing lame sows are mainly found in the right part of the biplot. Therefore, the first factor could be interpreted as varying with the severity of lameness. Furthermore, three particular relationships were noted: (1) the opposition between stance time and walking speed, which seemed to be relatively independent from other variables; (2) the direct links between all postural variables: stepping, latency to lie down and time spent standing; and (3) the direct positive or negative relationships between various measurements relative to the gait: swing time, rear amplitude, foot height, ipsilateral and diagonal distances.
Results from the Partial Least Square analysis on a selection of variables measured using kinematics (solid line), accelerometers (short dashes) and footprint analysis (long dashes) for 50 sows classified into three degree of lameness: non-lame (white dots), mildly lame (grey dots) and lame (black dots). The biplot of the first two factors jointly represents 40.9% of the total variation.

Discussion
Relation between measurements and lameness
Lameness is often described as a gait alteration and may result from many causes such as affections of the foot or of the neurological, muscular or bone systems (Wells, Reference Wells1984). A modification of the stride length is one of the signs often used to evaluate lameness in dairy cows (Blackie et al., Reference Blackie, Bleach, Amory and Scaife2011). In the present study, kinematic analysis of gait in lame sows demonstrated a reduction in the stride length. The latter has been observed in horses with locomotor problems (Drevemo et al., Reference Drevemo, Fredricson, Dalin and Björne1980), in cows affected by sole ulcer (Flower et al., Reference Flower, Sanderson and Weary2005) and in sows affected by osteochondrosis (Rowles, Reference Rowles2001). Therefore, it is not surprising that stride length is often used in visual gait scoring assessment (Sprecher et al., Reference Sprecher, Hostetler and Kaneene1997; Main et al., Reference Main, Clegg, Spatz and Green2000).
In the present study, the kinematic analysis also revealed that the walking speed was lower in lame than in non-lame sows. Moreover, stance time was found to be longer in lame than in non-lame sows, meaning that the foot stayed on the ground for a longer time during the stride. On the other hand, the swing time was not significantly different, which means that the foot of a lame sow does not need more time to move one step further. The same phenomena were observed in lame horses and in cows affected by sole ulcer (Keegan et al., Reference Keegan, Wilson, Smith and Wilson2000; Flower et al., Reference Flower, Sanderson and Weary2005). Flower et al. (Reference Flower, Sanderson and Weary2005) explained the reduction in speed and stride length and the longer stance time as an adaptation to decrease pain. The gradual speed reduction decreases the load on the affected limb and the peak force when the foot touches the ground. The cows with an affected limb would transfer the load on the other three legs for a longer period, thus reducing the load on the affected limb. Pastell et al. (Reference Pastell, Kujala, Aisla, Hautala, Poikalainen, Praks, Veermäe and Ahokas2008) studied step force applied on a scale by sound and lame cows. The lame leg had a lower step force and a longer stance time. To reduce pain on a painful limb, cows transferred their weight and put more force on the ipsilateral and the contralateral limbs. In horses, the longer stance time was explained by a compensatory movement of the head and the neck with the redistribution of the weight bearing. However, horses affected by a severe lameness may also decrease their stance time because they were unable to bear weight on the affected limb (Keegan et al., Reference Keegan, Wilson, Smith and Wilson2000).
In the present study, posture analysis revealed that lame sows spent less time in the standing position over 24 h and during the morning feeding than non-lame sows. This is consistent with the observation that cows affected with lameness spent less time standing, walking and expressing oestrus behaviour and spent more time lying down (Walker et al., Reference Walker, Smith, Routly, Jones, Morris and Dobson2008). Chapinal et al. (Reference Chapinal, de Passillé, Weary, Von Keyserlingk and Rushen2009) observed that cows affected with sole ulcer spent one more hour a day in the lying position than sound cows, whereas Blackie et al. (Reference Blackie, Bleach, Amory and Scaife2011) reported that lame cows spent two more hours per day in the lying position than non-lame cows. The longer lying time could be explained as an attempt to alleviate pain in the feet (Blackie et al., Reference Blackie, Bleach, Amory and Scaife2011).
Observation of stepping behaviour showed that lame sows stepped more often during feeding than non-lame sows. That could reflect discomfort when the sows put their weight on an affected leg. The same phenomenon was observed in cows by Pastell et al. (Reference Pastell, Kujala, Aisla, Hautala, Poikalainen, Praks, Veermäe and Ahokas2008), using a scale system during milking. On the other hand, Chapinal et al. (Reference Chapinal, de Passillé, Rushen and Wagner2010) found less steps per hour in lame cows over 24 h. However, these measurements were taken independently of the posture of the cow and may have been influenced by the greater time spent lying. Therefore, an increase in stepping is most likely a good indicator of lameness provided that it is measured over periods where the animal is continuously standing.
Many factors can affect the occurrence of foot lesions in sows: nutrition, floor characteristics, cleanliness, humidity, physical activity and BW (Dewey et al., Reference Dewey, Friendship and Wilson1993; Bonde et al., Reference Bonde, Rousing, Badsberg and Sørensen2004). In the present study, 96% of sows were affected by overgrown heel, which has been reported to be more frequent in wet conditions (Gjein and Larssen, Reference Gjein and Larssen1995). In addition, more than 50% of the sows of this study had lesions to the white line or the side wall, but several other types of foot lesions affected sows without necessarily being associated with lameness. Gjein and Larssen (Reference Gjein and Larssen1995) observed that 80% of confined sows and 96% of loose-housed sows had claw lesions. Intensive selection and management applied to pigs to attain rapid growth and heavy BW might have affected soundness of feet and legs (Anil et al., Reference Anil, Anil, Deen, Baidoo and Walker2007). Many studies tried to associate claw lesions with lameness in dairy cows (Whay et al., Reference Whay, Waterman and Webster1997; Chapinal et al., Reference Chapinal, de Passillé, Weary, Von Keyserlingk and Rushen2009). Identifying such a relationship could be difficult because of the variability in the pain associated with the types of lesions and their severity (O'Callaghan et al., Reference O'Callaghan, Cripps, Downham and Murray2003). Flower et al. (Reference Flower, Sanderson and Weary2005) found that cows affected with sole ulcer differ in many kinematic parameters compared with healthy cows, but no differences were found for other types of lesions. In the present study, no specific lesions were associated with the visual gait score. A high variability in the types and severity of lesions described in only 50 sows may make it difficult to identify a relationship between one type of lesion observed on one foot and a global lameness score. More research focusing on the impact of specific lesions on lameness is needed. However, the results showed that severe lesions at the white line, the heel and the sole affected some gait parameters measured with footprint analysis or kinematics. Therefore, lesions located under the foot may be more painful than those affecting the wall or the dew claws. Anil et al. (Reference Anil, Anil, Deen, Baidoo and Walker2007) suggested that white line is a weak point because it is the junction between the wall and the sole and that an injury could facilitate infection of the corium and cause lameness.
More lame sows presented an arched back possibly because they tried to minimise pain by putting less weight on their sore feet and by bringing their feet closer under their body. This phenomenon has often been observed in sows affected by arthritis or aseptic laminitis (Wells, Reference Wells1984). An arched back is also a criterion used in lameness visual scoring systems for milking cows (Sprecher et al., Reference Sprecher, Hostetler and Kaneene1997).
Finally, the multivariate analysis identified some relationships between the various gait components and the postural behaviour recorded. Most of the gait parameters are related to each other and variables such as foot height or joint's angle amplitude, although not related to gait visual score, could still be interesting to study in further research.
Appraisal of the different methods to measure sow gait and assess lameness
Footprint analysis
Study on footprints in rats and chicken has already been used to show the impact of age or neurological problems on gait components, such as the angle of the foot, the toe print, the sliding and the stride length and wideness (Sheets et al., Reference Sheets, Hassanein and Norton1987; Klapdor et al., Reference Klapdor, Dulfer, Hammann and Van Der Staay1997). In the present study, the stride length and the speed measured were shorter than the ones obtained using kinematics. This could be explained by the use of clay, which had to be slightly wet to produce a good footprint and may have appeared slippery to the sows. Indeed, studies on the gait of pigs walking on different types of floor showed that pigs shortened their stride length and speed when they walked on a slippery surface (von Wachenfelt et al., Reference von Wachenfelt, Pinzke and Nilsson2009). Therefore, the use of a slippery surface in the present study may have prevented the discrimination of lame sows from non-lame ones. The analysis of footprints could still be of interest to evaluate sow gait, but the present methodology would have to be improved.
Kinematics
Kinematics allows for a quantification of the gait and thus lameness detection. Gait measurements using kinematics were consistent within sow and over time, but presented many technical challenges. For example, placing reflective markers on the body is done by palpation of the joints. If markers are easy to place on legs because the bones are visible, other locations on the body such as the hip or the tuber coxae are more difficult to detect because they are covered with muscle and fat. Because markers can be displaced by skin movements (Bobbert et al., Reference Bobbert, Álvarez, Van Weeren, Roepstorff and Weishaupt2007), it is important to verify that they do not move away from their original site during measurements. In addition, marker tracking analysis needs the distance from the camera to the animal to be well calibrated to reduce the risk of bias (Ceballos et al., Reference Ceballos, Sanderson, Rushen and Weary2004). Furthermore, recording each side of the body at a similar speed is time-consuming and explains why several studies used a treadmill instead of a corridor for walking (Keegan et al., Reference Keegan, Wilson, Smith and Wilson2000). For all these reasons, kinematics remains a complicated, expensive and a time-consuming technique that is more adapted to research settings than on-farm use.
Posture and stepping behaviour using accelerometers
Results from Ringgenberg et al. (Reference Ringgenberg, Bergeron and Devillers2010) showed that accelerometers can be successfully used to automatically measure postural and stepping behaviour, which were found to be related to lameness in the present study. These results are in accordance with Buddle et al. (Reference Buddle, Madec and Fourichon1994b), who found that time spent standing after the meal is well correlated with time standing over 24 h, and that it could be an interesting on-farm indicator to evaluate leg disorders. Moreover, this automated method to measure posture is relatively cheap and easy to use on farm.
Foot lesions
Several lesions were observed on the feet of lame and non-lame sows. A limitation in the present study is that foot evaluation was made after the sows had been selected on the basis of their lameness visual score. This resulted in a selection of sows with feet presenting many lesions, or various types of lesions found on different feet, which made the association between a specific type of lesion and lameness difficult. In cows, Pastell et al. (Reference Pastell, Hänninen, de Passillé and Rushen2010) also reported that lesions on many feet may complicate lameness measurements. Furthermore, Whay et al. (Reference Whay, Waterman and Webster1997) found that lameness is more closely associated with the severity of lesions than with their number. In our study, the validation of the foot lesion observation revealed an interobserver reliability of 76% and an intraobserver reliability of 83% after training of the observers. Like any visual scoring, lesion scoring is subjective and less consistent than quantitative methods. Moreover, having a good view of the sole could be an issue. The method used for visual scoring of foot lesions was also time-consuming as it required washing and photographing feet and waiting for sows to lie down in order to look at the sole. In a farm context, only side wall and claw size could be easily observed on stall-housed gestating sows in a time-efficient manner; however, results showed that lesions under the foot were the ones most likely affecting lameness. Consequently, it would require a specific device such as the FeetFirst® chute (Zinpro Corporation, Eden Prairie, MN, USA) to lift the sow and easily look under the foot, or to assess lesions under the foot in farrowing crates where sows are more often lying laterally.
Lying-to-standing transition
Several studies observed standing-to-lying transition in cows (Ceballos et al., Reference Ceballos, Sanderson, Rushen and Weary2004) and pigs (Cariolet and Dantzer, Reference Cariolet and Dantzer1984; Bonde et al., Reference Bonde, Rousing, Badsberg and Sørensen2004) but only a few observed lying-to-standing transition (Buddle et al., Reference Buddle, Madec and Fourichon1994a). Because sows could spend up to 80% of their time lying, it is easier and less time-consuming to make sows stand up than wait for them to lie down. In the present study, interobserver reliability was excellent, but the stimulus used was not very efficient at getting sows to stand up. Indeed, only 43% of non-lame sows, 18% of mildly lame and 45% of lame sows stood up. Buddle et al. (Reference Buddle, Madec and Fourichon1994a) also reported difficulty in finding an adequate stimulus to incite sows to get up. They mentioned that they could not determine whether it was caused by a dysfunction of the locomotor system or a stubborn animal. Sow reactivity to humans could also be a potential confounding factor. Indeed, in the present study, sows were used to being manipulated and could have been less reactive to the stimulus, whereas on a commercial farm sows could be more reactive.
Back posture
The visual observation of back posture showed that 64% of lame sows had an arched back, compared with only 14% in non-lame sows. Poursaberi et al. (Reference Poursaberi, Bahr, Pluk, Van Nuffel and Berckmans2010) tried to detect lameness in cows with a real-time automatic detection device based on the back posture. They mentioned that arched back posture is one of the most relevant criteria to identify lameness, but that it is not sufficient on its own. Further research could involve the use of kinematics to detect back posture in sows.
Conclusion
In conclusion, this study identified several potential indicators of lameness in sows: gait components such as stride length, stance time and walking speed, and postural components such as time spent standing, lying-to-standing transition, stepping and back conformation. From the various methodologies used, kinematics and accelerometers are promising tools to quantify gait and lameness in a research context. Footprint analysis would need to be refined using another medium to print the feet. Evaluation of other components based on visual observation, such as lying-to-standing transition, back conformation and foot lesions, still need further technical development to improve reliability and accuracy. Some of these techniques required a complicated set-up and expensive equipment and are too time-consuming to be implemented at the farm level. However, standing posture and stepping are promising indicators to be observed at the farm level. Finally, more research is also needed to understand the impact of the different types of foot lesions on lameness and to link physiological causes of lameness to alteration of the gait and postures of sows.
Acknowledgements
The authors would like to thank Claire Corriveau, Marjolaine St-Louis, Anna Kerivel, Maud Gète and Jonathan Déom for their invaluable technical assistance, Steve Méthot for help in statistical analyses and all the staff at the Swine Complex for care of the animals. This project was funded by the Fédération des Producteurs de Porcs du Québec and the Agriculture and Agri-Food Canada Matching Investment Initiative. The authors also thank MIC (Motion Imaging Corporation, Simi Valley, CA) and Intergrys (Mississauga, ON) for their support with the kinematic equipment and software.