Implications
The present study quantified the extent of exploitable genetic variation in milk minerals among Holstein-Friesian cows. Results indicated that 19% (potassium) to 54% (calcium) of the phenotypic variability in milk mineral concentration was due to differences in genetic merit. Because milk mineral content can be predicted using mid-IR spectroscopy of individual cow milk samples, breeding for changes in milk mineral content is possible, and achievable at a low cost. Moreover, breeding goals that consider milk protein and somatic cell score are likely to be already indirectly altering at the desired direction the genetic merit of milk mineral concentration.
Introduction
Although milk global demand is consistently growing, meeting specific targets for product quality is still a critical challenge for the dairy sector (FAO, 2017). One strategy to maximize industry profit is to maximize milk added value; such a strategy can be achieved through market segmentation so that the industry can differentiate its product portfolio, like for example providing the market with products of superior human nutritive value. Milk is an important source of functional molecules including long-chain fatty acids (Parodi, Reference Parodi1999), essential amino acids (McDermott et al., Reference McDermott, Visentin, De Marchi, Berry, Fenelon, O’Connor, Kenny and McParland2016), thiols (Niero et al., Reference Niero, De Marchi, Masi, Penasa and Cassandro2015), vitamins and antioxidants (Niero et al., Reference Niero, Penasa, Currò, Masi, Trentin, Cassandro and De Marchi2017) and minerals (Gaucheron, Reference Gaucheron2005). Macro-minerals in milk are generally referred to as calcium (Ca), potassium (K), magnesium (Mg), sodium (Na) and phosphorus (P) (Cashman, Reference Cashman2006), and these are important for human adults and infants, through their involvement in the homeostasis of the musculoskeletal and cardiovascular systems (Cashman, Reference Cashman2006; Haug et al., Reference Haug, Høstmark and Harstad2007; Whelton and He, Reference Whelton and He2014).
Milk mineral concentration is known to vary by several factors, such as breed (Carroll et al., Reference Carroll, DePeters, Taylor, Rosenberg, Perez-Monti and Capps2006; Niero et al., Reference Niero, Visentin, Ton, De Marchi, Penasa and Cassandro2016), stage of lactation (Carroll et al., Reference Carroll, DePeters, Taylor, Rosenberg, Perez-Monti and Capps2006; van Hulzen et al., Reference van Hulzen, Sprong, van der Meer and van Arendonk2009), parity number (Kume et al., Reference Kume, Yamamoto, Kudo, Toharmat and Nonaka1998) and udder health status (Summer et al., Reference Summer, Franceschi, Malacarne, Formaggioni, Tosi, Tedeschi and Mariani2009). Substantial additive genetic variation has been reported in both Dutch Holstein-Friesians (1860 cows; van Hulzen et al., Reference van Hulzen, Sprong, van der Meer and van Arendonk2009), and Danish Holsteins and Jerseys (456 and 436 cows, respectively; Buitenhuis et al., Reference Buitenhuis, Poulsen, Larsen and Sehested2015). Because of the time and cost of reference laboratory analyses, measuring milk minerals on a large scale is, however, resource intensive. This challenge represents a limit to estimating precise genetic parameters for milk minerals, as well as being able to deliver high accuracy estimates of genetic merit for individual animals on a routine basis.
The use of mid-IR spectroscopy in generating a predicted phenotype for several milk and animal factors has been documented for a plethora of milk quality traits (De Marchi et al., Reference De Marchi, Toffanin, Cassandro and Penasa2014), including milk mineral concentration (Soyeurt et al., Reference Soyeurt, Bruwier, Romnee, Gengler, Bertozzi, Veselko and Dardenne2009; Toffanin et al., Reference Toffanin, De Marchi, Lopez-Villalobos and Cassandro2015a; Visentin et al., Reference Visentin, Penasa, Gottardo, Cassandro and De Marchi2016). Toffanin et al. (Reference Toffanin, Penasa, McParland, Berry, Cassandro and De Marchi2015b) reported heritability estimates of 0.10±0.04 for Ca and 0.12±0.04 for P in cow milk predicted by mid-IR spectroscopy; this study was based on 2458 Holstein-Friesian cows from 220 herds. To our knowledge, however, no study has attempted to quantify the change in genetic (co)variances for milk mineral composition throughout the lactation in dairy cows. Also, no estimates of repeatability of bovine milk mineral concentration exist.
Therefore, the objective of the present study was to quantify, using random regressions fitted across lactation to Italian Holstein-Friesian dairy cattle, the additive genetic variation in milk mineral concentration predicted using mid-IR spectroscopy, as well as the covariances between such traits and milk chemical composition, acidity and somatic cell score (SCS).
Material and methods
Data
Between January 2012 and December 2013, a total of 132 380 milk samples from 15 173 dairy cows were collected in the Bolzano Province (Italy) as described by Visentin et al. (Reference Visentin, Penasa, Niero, Cassandro and De Marchi2017b). In the present study, only milk samples collected from Holstein-Friesian dairy cattle were retained; therefore, the data set included 16 846 milk samples from 2020 cows and 2838 lactations all producing in 95 single-breed commercial herds. All animals were milked twice daily, in the morning (AM) and again in the afternoon (PM). During each monthly test-day recording, a milk sample was alternately collected during one milking session, immediately preserved with Bronysolv (ANA.LI.TIK Austria, Vienna, Austria), transported to the milk laboratory of the South Tyrolean Dairy Association (Sennereiverband Südtirol, Bolzano, Italy), and processed according to International Committee for Animal Recording recommendations. Almost 55% of the cows participating in the present study calved between July and December. For each milk sample, milk chemical composition (protein, casein, fat, and lactose percentage and urea concentration) and acidity (pH) were estimated from the respective mid-IR spectrum generated by a MilkoScan FT6000 (Foss Electric A/S, Hillerød, Denmark). The resulting milk spectrum, containing 1060 transmittance data points in the region between 5000 and 900 cm−1, was stored. Somatic cell count (SCC, cells/μl) was measured using Fossomatic (Foss Electric A/S) and transformed to SCS through the formula SCS=3+log2(SCC/100).
Generation of predicted milk mineral composition and edits
Prediction models
In 2014, a total of 251 individual bovine milk samples were collected in the same area from herds contributing to the data of the present study. Full details on the data set can be retrieved from Visentin et al. (Reference Visentin, Penasa, Gottardo, Cassandro and De Marchi2016). Milk samples were analyzed in the laboratory of the Department of Agronomy, Food, Natural Resources, Animals and Environment of the University of Padova (Legnaro, Italy) for Ca, K, Mg, Na and P concentration (mg/kg) using inductively coupled plasma optical emission spectrometry, Ciros Vision EOP (SPECTRO Analytical Instruments GmbH, Kleve, Germany) after mineralization. Prediction models for milk minerals were developed using partial least squares regression analysis as described by Visentin et al. (Reference Visentin, Penasa, Gottardo, Cassandro and De Marchi2016). The prediction models included a vector of each measured milk mineral as the dependent variable, whereas spectra wavelengths (converted from transmittance to absorbance by taking the log10 of the inverse of the transmittance) were considered as predictor variables. The coefficient of determination (root mean square error in parentheses) in external validation was 0.67 (122.00 mg/kg), 0.69 (120.00 mg/kg), 0.65 (12.50 mg/kg), 0.40 (70.00 mg/kg) and 0.68 (88.12 mg/kg) for Ca, K, Mg, Na and P, respectively. A full description of the reference methodology to measure milk minerals, as well as the development of the prediction models is presented in Visentin et al. (Reference Visentin, Penasa, Gottardo, Cassandro and De Marchi2016).
Generation of predicted phenotypes
The loadings on each wavelength from the developed prediction models were applied to the large spectral data set. First, principal component analysis (PROC PRINCOMP; SAS Institute Inc., Cary, NC, USA) was applied to the large spectral data set as well as to the data set with reference values of milk mineral composition; this was undertaken to identify milk spectra (i.e. samples) from the larger data set which were similar to those used to develop the prediction models as previously employed by Visentin et al. (Reference Visentin, De Marchi, Berry, McDermott, Fenelon, Penasa and McParland2017a). For this reason, the Mahalanobis distance from the centroid of the cluster of milk spectra with known mineral composition was computed for each milk spectrum from the larger spectral data set as described by Brereton (Reference Brereton2015); if a milk spectrum had a Mahalanobis distance greater than the 97.5% percentile of a χ 2 with 6 degrees of freedom (i.e. the lowest number of eigenvectors with eigenvalues >1), then this spectrum was discarded from further statistical analysis. Predicted milk minerals were computed only for the 15 599 milk spectra retained after the principal component analysis.
Data editing
Obvious data errors of milk chemical composition were discarded from the data set. Records were retained if taken between 5 and 305 days-in-milk (DIM) for the first 10 parities. Lactations number ⩾5 were grouped into a compressed parity class. Contemporaries were defined as cows milking in the same herd test-date and contemporary groups with <3 observations were discarded. Milk mineral composition was set to missing if the predicted milk mineral value was >3 standard deviations from the mean of that respective mineral. Following all these edits, the final data set consisted of 12 223 milk samples from 1717 Holstein-Friesian cows and 2549 lactations.
Statistical analysis
(Co)variance components of predicted concentration (mg/kg) for each milk mineral (Ca, K, Mg, Na and P), milk chemical composition (percentage of protein, casein, fat and lactose), urea concentration (mg/dl), pH and SCS were estimated in ASREML (Gilmour et al., Reference Gilmour, Cullis, Welham and Thompson2011) using random regression models fitted across lactation. The pedigree was traced back six generations (where available) and included a total of 9476 animals, including 1485 sires and 6476 dams. A total of 10 residual groups based on DIM were defined as 5 to 30 DIM, 31 to 60 DIM, 61 to 90 DIM, …, 240 to 270 DIM, 271 to 305 DIM. Homogeneity of variance was assumed within the residual group, whereas heterogeneity with no residual covariance was assumed among groups. The model fitted was as follows:
 $$\eqalignno{ y_{{lmnop}} {\equals} & {\rm HTD}_{l} {\plus}\mathop{\sum}\limits_{i{\equals}1}^n {{\rm Par}_{m} b_{n} {\rm DIM}^{n} } {\plus}\mathop{\sum}\limits_{i{\equals}1}^n {{\rm Cow}_{o} b_{n} {\rm DIM}^{n} } \cr & {\plus}\mathop{\sum}\limits_{(i{\equals}1)}^n {{\rm PEwithin}_{o} b_{n} {\rm DIM}^{n} {\plus}{\rm PEacross}_{o} {\plus}e_{{lmnop}} } $$
where y lmnop is predicted milk mineral composition, milk chemical composition, urea, pH or SCS; HTD l the fixed effect of the lth contemporary group (1128 classes); Par m the fixed effect of the mth parity (five classes: 1, 2, 3, 4, ⩾5); b n the nth-order of Legendre polynomial on DIM; Cow o the random additive genetic effect of the oth cow; PEwithin o the random effect of the within-lactation permanent environmental effect of the oth cow; PEacross o the random effect of the across lactation permanent environmental effect of the oth cow; and e lmnop the residual term.
The most parsimonious order of the fixed Legendre polynomial was based on the estimated lactation profile for each milk mineral. The most parsimonious order of the random Legendre polynomial was chosen based on: (i) the Log-likelihood ratio test (Wilks, Reference Wilks1938); (ii) the Akaike information criterion; and (iii) the smallest eigenvalue of the resulting additive genetic covariance matrix. In the first instance, a first-order covariance function was fitted only to the additive genetic effect; second a first-order Legendre polynomial was fitted to the within-lactation permanent environmental effect. Subsequently, the order of the random Legendre polynomial was incremented of one unit first on the additive genetic effect and then on the within-lactation permanent environmental effect.
Covariance function coefficients were calculated as δ 2=ΦκΦ′, where δ 2 is the 301×301 covariance matrix for the traits studied, Φ the 301×n Legendre polynomial matrix of DIM regression coefficient and κ the estimated n×n covariance matrix of the random terms fitted with covariance functions (i.e. additive genetic and within-lactation permanent environment). Standard errors of heritability estimates were calculated using a Taylor series expansion (Fischer et al., Reference Fisher, Gilmour and van der Werf2004).
Genetic correlations between milk mineral composition, milk chemical composition, urea, pH and SCS at each DIM were calculated using a series of bivariate random regression models by fitting the same model previously described. Residual groups were as described for the univariate analysis, but residual covariance was estimated between traits in each group. The order of Legendre polynomial was the same as for the univariate analyses. Standard errors of the genetic correlations were estimated as in Falconer and MacKay (Reference Falconer and MacKay1996):
 $${\rm SE}_{{\left( {r_{A} } \right)}} {\equals}\left[ {{{1{\minus}r_{A}^{2} } \over {\sqrt 2 }}} \right]\left[ {{{\left[ {\sigma _{{h_{x}^{2} }} \sigma _{{h_{y}^{2} }} } \right]} \over {\left[ {h_{x}^{2} h_{y}^{2} } \right]}}} \right]$$
where SE and σ denote the standard error, r A the genetic correlation between trait x and trait y and h 2 denotes the heritability for trait x or trait y.
Eigenvalues and eigenvectors of the additive genetic covariance matrix for each trait studied were calculated using PROC IML (SAS Institute Inc.), whereas eigenfunctions were calculated as:
 $$\psi _{i} \left( x \right){\equals}\mathop \sum\limits_{j{\equals}0}^{p{\minus}1} \left[ {k_{{\psi _{i} }} } \right]_{j} \Phi _{j} \left( x \right)$$
where [k ψ i ] j is the jth element of the ith eigenvector of K, Φ j the jth element of the p−1 order of fit of the Legendre polynomial matrix and x the DIM.
A repeatability animal model was also used to estimate variance components for milk mineral composition, milk chemical composition, urea, pH, and SCS by fitting the same model previously described for the random regression analysis, but excluding the sets of Legendre polynomial and by fitting the interaction between parity and DIM classes (10 classes: 5 to 30 DIM, 31 to 60 DIM, …, 271 to 305 DIM).
To evaluate the impact of having repeated measurements per individual on the response to selection for each milk mineral individually, the following formula was used (Walsh and Lynch, Reference Walsh and Lynch2014):
 $$R_{x} {\equals}i\,h_{x} \,\sigma _{{g_{x} }} \sqrt {{n \over {1{\plus}t_{x} (n{\minus}1)}}} $$
where R x is the response to selection for trait x, i the selection intensity (assumed 1), h x the square root of the heritability for trait x, σ gx the additive genetic standard deviation for trait x, n the number of samples collected for each individual and t x the repeatability for trait x. The response to selection for each mineral was quantified separately and aimed at comparing the response achievable with n=1 and n=15 (i.e. 5 test-days in the first three lactations).
Results
The number of milk samples at the peripheries of the lactation was 960 (5 to 30 DIM) and 1237 (271 to 305 DIM). In the remaining part of the lactation, the number of samples per stage ranged from 1220 (241 to 270 DIM) to 1303 (91 to 120 DIM). Table 1 reports the total number of samples, the mean, and the estimated variance components (and ratios) for milk mineral concentration and milk chemical composition estimated using the repeatability animal model. Estimates of heritability (repeatability in parentheses) for milk minerals ranged from 0.19 (0.25) for K to 0.54 (0.66) for Ca concentration. Heritability estimates for milk chemical composition varied between 0.25 for the fat percentage to 0.39 for protein and casein percentage. The heritability estimate for urea concentration, pH and SCS was 0.26, 0.48 and 0.11, respectively (Table 1). The coefficient of genetic variation (CVg) for the minerals ranged from 3.33% (K concentration) to 6.61% (Ca concentration). Of the traits reflecting milk composition, the CVg varied from 1.99% (lactose percentage) to 6.89% (fat percentage). The largest CVg was for urea concentration and SCS (10.73% and 17.34%, respectively), whereas almost no genetic variation existed for pH (0.01%). The CVg of the concentration of minerals, genetically independent of the genetic merit on milk protein percentage, was 5.87% for Ca, 3.31% for K, 4.37% for Mg and 6.23% for P. Independent of the genetic merit for SCS, the CVg of Na was 4.31%. The response to single-trait selection after one selection round with one measurement per individual was 62.88 mg/kg (Ca), 24.45 mg/kg (K), 3.61 mg/kg (Mg), 10.56 mg/kg (Na) and 40.34 mg/kg (P). When the number of records per individual was increased to 15, the response to selection was 76.11 mg/kg, 44.64 mg/kg, 6.40 mg/kg, 16.09 mg/kg and 53.85 mg/kg for Ca, K, Mg, Na and P, respectively. For every percentage increase in the genetic merit for protein concentration, the genetic merit of mineral concentration increased by 231.57 mg/kg (Ca), 9.59 mg/kg (K), 30.13 mg/kg (Mg), 11.41 mg/kg (Na) and 205.06 mg/kg (P). Similarly, a one-unit reduction in genetic merit for SCS is expected to contribute to a reduction in genetic merit of 18.21, 1.19, 0.50, 22.02 and 1.32 mg/kg for Ca, K, Mg, Na and P concentration, respectively.
Mean, genetic standard deviation (σ g), heritability (h 2; standard error in parentheses), repeatability (t; standard error in parentheses) and coefficient of genetic variation (CVg) estimated using the repeatability animal model for calcium (Ca), potassium (K), magnesium (Mg), sodium (Na) and phosphorus (P) concentration, chemical composition, pH and somatic cell score (SCS) of cow milk

Random regression analyses
For all milk minerals, the order of the fixed Legendre polynomial was quadratic, whereas the polynomial order was quadratic for the random additive genetic effect and linear for the within-lactation permanent environmental effect.
Genetic variation
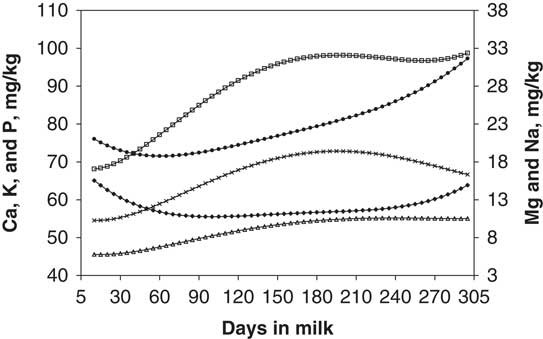
The change in the estimated genetic standard deviation of Ca, K, Mg, Na and P concentration across lactation is depicted in Figure 1. The genetic standard deviation for Ca, Mg and P increased until mid-lactation (151 to 180 DIM) and decreased thereafter. This trend was more evident for P than for either Ca and Mg concentration. The lactation profile of the genetic standard deviation of K and Na concentration was somewhat opposite to what observed for Ca, Mg and P. The genetic standard deviation ranged from 68.09±5.57 mg/kg (7 DIM) to 100.17±5.23 mg/kg (305 DIM) for Ca concentration, from 55.52±4.52 mg/kg (99 DIM) to 66.21±7.14 mg/kg (5 DIM) for K concentration and from 5.78±1.03 mg/kg (15 DIM) to 10.59±0.58 mg/kg (237 DIM) for Mg concentration (Figure 1). The genetic standard deviation varied between 18.78±1.86 mg/kg (57 DIM) and 32.95±2.47 mg/kg (305 DIM) for Na concentration, and between 54.53±5.04 mg/kg (12 DIM) and 72.83±3.43 mg/kg (196 DIM) for P concentration (Figure 1). The lactation profile of the CVg was similar to the one of the genetic standard deviation for all traits. The lowest CVg was 4.90% (11 DIM), 3.06% (151 DIM), 3.79% (7 DIM), 4.29% (62 DIM) and 4.62% (6 DIM) for Ca, K, Mg, Na and P concentration, respectively. The greatest CVg was at 179 DIM (7.89%; Ca concentration), at 301 DIM (4.09%; K concentration), at 260 DIM (8.32%; Mg concentration), at 304 DIM (7.24%; Na concentration) and at 192 DIM (7.69%; P concentration; data not shown).
Genetic standard deviation (SE in parentheses) for calcium (Ca) (––□––, mg/kg; 4.63 to 5.23), potassium (K) (––♦––, mg/kg; 4.51 to 7.14), magnesium (Mg) (––Δ––, mg/kg; 0.62 to 0.91), sodium (Na) (––●––, mg/kg; 1.76 to 2.47) and phosphorus (P) (––×––, mg/kg; 3.70 to 5.32) concentration during cow lactation estimated using the random regression animal model.

Heritability estimates
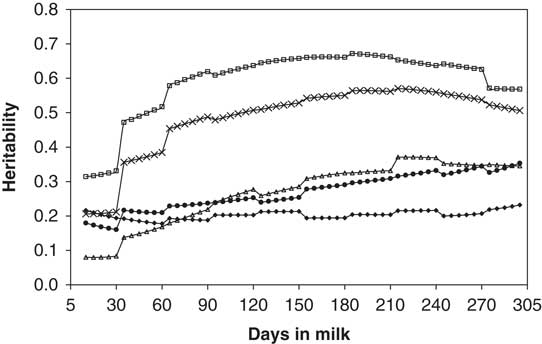
The estimated heritabilities of milk Ca, K, Mg, Na and P concentration at each DIM are in Figure 2. In all instances, the heritability estimates were the lowest at the onset of lactation, coinciding with the stage of greatest residual variance (Supplementary Table S1). Heritabilities ranged from 0.31±0.05 (5 DIM) to 0.67±0.04 (181 DIM) for Ca concentration, from 0.18±0.03 (60 DIM) to 0.24±0.05 (305 DIM) for K concentration, from 0.08±0.03 (15 DIM) to 0.37±0.03 (223 DIM) for Mg concentration, from 0.16±0.03 (30 DIM) to 0.37±0.04 (305 DIM) for Na concentration and from 0.21±0.04 (12 DIM) to 0.57±0.04 (211 DIM) for P concentration (Figure 2).
Heritability estimates (SE in parentheses) for calcium (––□––; 0.04 to 0.05), potassium (––♦––; 0.03 to 0.05), magnesium (––Δ––; 0.02 to 0.05), sodium (––●––; 0.03 to 0.05) and phosphorus (––×––; 0.03 to 0.05) concentration during cow lactation estimated using the random regression animal model.

Decomposition of the additive genetic (co)variance matrix
The analysis of the geometry of the additive genetic covariance matrix of milk minerals revealed that the largest eigenvalue explained from 88.16% (Na concentration) to 92.78% (K concentration) of the additive genetic variance. The smallest eigenvalue explained between 1.27% (P concentration) and 3.92% (Na concentration) of the total additive genetic variance (data not shown). The eigenfunction associated to the largest eigenvalue did not change sign over the entire lactation for any mineral. The eigenfunction associated to the middle eigenvalue changed sign after mid-lactation for the different minerals, with the exception of K concentration in which this eigenfunction changed sign at 90 DIM. The eigenfunction associated with the smallest eigenvalue turned from positive to negative between 60 and 90 DIM, but returned positive again between 241 and 270 DIM; the exception was K concentration, where the change of the sign (from positive to negative) occurred at 22 DIM, which returned positive at 215 DIM (data not shown).
Within-trait genetic correlations
The genetic correlations estimated between either 5 DIM, 150 DIM and 305 DIM with all other DIM within each mineral separately are depicted in Figure 3. The within-trait genetic correlations were almost unity between adjacent DIM but they did weaken when correlating data from both lactation peripheries with each other (Figure 3). The minimum of the within-trait genetic correlation was 0.56±0.07 (5 DIM v. 305 DIM), 0.73±0.06 (5 DIM v. 184 DIM), 0.36±0.25 (5 DIM v. 305 DIM), 0.57±0.10 (5 DIM v. 214 DIM) and 0.48±0.10 (5 DIM v. 305 DIM) for Ca, K, Mg, Na and P concentration, respectively (Figure 3).
Within-trait genetic correlations (SE in parentheses) between 5 days-in-milk (DIM) (–□–), 150 DIM (–♦–) and 305 DIM (–Δ–) and the rest of cow lactation for (a) calcium concentration (0.00 to 0.07); (b) potassium concentration (0.00 to 0.06); (c) magnesium concentration (0.00 to 0.25); (d) sodium concentration (0.00 to 0.10); (e) phosphorus concentration (0.00 to 0.10) estimated using the random regression animal model.

Between trait genetic correlations
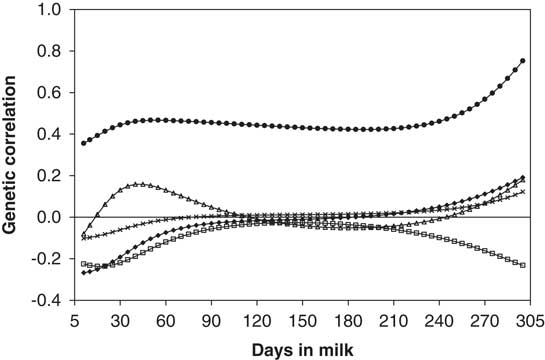
The largest standard error of the estimated genetic correlations were calculated at the beginning of the lactation between 5 and 30 DIM, coinciding with the residual group with the lowest number of observations (i.e. 960 records; Supplementary Table S2) and also with the lowest estimates of the heritability (Figure 2; Supplementary Table S1). When the number of samples included in the residual group increased, concurrently with the heritability estimates, standard error of the genetic correlations decreased (Supplementary Table S3; Supplementary Table S4). The genetic correlations between protein percentage and minerals across DIM were generally positive and strengthened as the lactation progressed (Figure 4). The genetic correlations between protein percentage with both K and Na concentration changed from negative to positive at 61 DIM and 78 DIM, respectively. Milk fat percentage was positively genetically correlated with Ca, K and Mg concentration irrespective of DIM, with the strongest correlation estimated at 190 DIM (0.56±0.03 between fat and Ca), 200 DIM (0.31±0.07 between fat and K) and 305 DIM (0.74±0.23 between fat and Mg). The genetic correlations between milk fat percentage and Na concentration were all negative until 243 DIM, and those between milk fat percentage and P changed sign at 50 DIM (Figure 4). The genetic correlations between both milk lactose and urea concentration with the different milk minerals were negative, with very few exceptions (Figure 5); the strongest genetic correlations were estimated at 5 DIM (−0.62±0.06 between lactose percentage and K concentration, and −0.78±0.07 between urea and Mg concentration; Figure 5). The genetic correlations between SCS and Na ranged from 0.38±0.21 (5 DIM) to 0.79±0.18 (305 DIM), although they varied from −0.29±0.21 at 5 DIM between SCS and K concentration to 0.18±0.07 at 37 DIM between SCS and Mg concentration (Figure 6).
Genetic correlations (SE in parentheses) between (a) protein percentage and concentrations of calcium (–□–; 0.03 to 0.12), potassium (–♦–; 0.06 to 0.14), Mg (–Δ–; 0.03 to 0.17), sodium (–●–; 0.05 to 0.15) and phosphorus (–×–; 0.03 to 0.13), and (b) fat percentage and concentration of calcium (–□–; 0.03 to 0.13), potassium (–♦–; 0.07 to 0.17), magnesium (–Δ–; 0.03 to 0.23), sodium (–●–; 0.07 to 0.17) and phosphorus (–×–; 0.04 to 0.16) during cow lactation estimated using the random regression animal model.

Genetic correlations (SE in parentheses) between (a) lactose percentage and concentration of calcium (–□–; 0.05 to 0.11), potassium (–♦–; 0.06 to 0.08), magnesium (–Δ–; 0.05 to 0.12), sodium (–●–; 0.06 to 0.12) and phosphorus (–×–; 0.06 to 0.12), and (b) concentration of urea and calcium (–□–; 0.06 to 0.11), potassium (–♦–; 0.09 to 0.13), magnesium (–Δ–; 0.07 to 0.11), sodium (–●–; 0.09 to 0.14) and phosphorus (–×–; 0.06 to 0.11) during cow lactation estimated using the random regression animal model.

Genetic correlations (SE in parentheses) between somatic cell score (SCS) and concentration of calcium (–□–; 0.05 to 0.18), potassium (–♦–; 0.09 to 0.21), magnesium (–Δ–; 0.07 to 0.31), sodium (–●–; 0.05 to 0.21) and phosphorus (–×–; 0.06 to 0.21) during cow lactation estimated using the random regression animal model.

Discussion
The objective of the present study was to estimate (co)variance components of milk minerals predicted using mid-IR spectroscopy in a large data set of Holstein-Friesian dairy cows. All traits were heritable and exhibited substantial genetic variation, implying that genetic selection would be fruitful.
Variance components
Heritable genetic variation in bovine milk minerals has already been demonstrated previously (van Hulzen et al., Reference van Hulzen, Sprong, van der Meer and van Arendonk2009; Buitenhuis et al., Reference Buitenhuis, Poulsen, Larsen and Sehested2015; Toffanin et al., Reference Toffanin, Penasa, McParland, Berry, Cassandro and De Marchi2015b) but the results from the present study only partially agreed with these previous studies. Indeed, heritability estimates for Ca and P (from the repeatability model) in the present study were greater than those documented by Toffanin et al. (Reference Toffanin, Penasa, McParland, Berry, Cassandro and De Marchi2015b), who reported estimates of 0.10 and 0.12 for Ca and P, respectively, in Italian dairy cows. Buitenhuis et al. (Reference Buitenhuis, Poulsen, Larsen and Sehested2015) failed to detect a genetic variance for milk K and Na concentration in 456 Danish Holstein cows, whereas van Hulzen et al. (Reference van Hulzen, Sprong, van der Meer and van Arendonk2009) reported heritability estimates of 0.46 and 0.60 for milk K and Mg concentration, respectively, in 1860 Dutch Holstein cows; the latter estimates are larger than estimates of the present study. Only Toffanin et al. (Reference Toffanin, Penasa, McParland, Berry, Cassandro and De Marchi2015b), however, estimated variance components of mid-IR predicted milk mineral concentration, reporting lower genetic variability compared with the population used in the present study. The environmental variance from the studies of Buitenhuis et al. (Reference Buitenhuis, Poulsen, Larsen and Sehested2015) and van Hulzen et al. (Reference van Hulzen, Sprong, van der Meer and van Arendonk2009), who studied mineral concentration measured using inductively coupled plasma-atomic emission spectroscopy, was generally lower than the environmental variance in the population investigated in the present study, thus contributing to the generally larger heritability estimates in the former except for the null heritability for K and Na concentration in Buitenhuis et al. (Reference Buitenhuis, Poulsen, Larsen and Sehested2015). Such apparent inconsistency was no surprising as the accuracy of prediction of mid-IR prediction models was less-than-unit (Toffanin et al., Reference Toffanin, De Marchi, Lopez-Villalobos and Cassandro2015a; Visentin et al., Reference Visentin, Penasa, Gottardo, Cassandro and De Marchi2016) and subsequently predicted phenotypes contain prediction error, resulting in an inflation of the residual term.
The use of random regressions as carried out in the current study did not assume a constant genetic variance throughout lactation, and therefore facilitated the estimation of the genetic variance at each DIM. With the exception of K, the change of the genetic variance throughout lactation mirrored the change in shape of the respective phenotypic mean lactation profile (Visentin et al., Reference Visentin, Penasa, Niero, Cassandro and De Marchi2017b), although the nadir at 31 to 60 DIM was more evident in the mean rather than in the genetic variance. The reduced heritability estimates at the onset of lactation indicated that environmental factors which are not accounted for in the statistical model of the present study have affected mineral concentration only in this specific part of the lactation. Such a phenomenon of the greater residual variance in early lactation was also documented by Hurley et al. (Reference Hurley, Lopez-Villalobos, McParland, Lewis, Kennedy, O’Donovan, Burke and Berry2017) in the estimation of variance components of feed efficiency traits in grazing Irish dairy cattle. Random regression models, however, can facilitate more effective and efficient breeding programs for improving the studied traits (Kirkpatrick et al., Reference Kirkpatrick, Lofsvold and Bulmer1990) and are nowadays commonly used in the analysis of longitudinal data in dairy cattle (van der Werf et al., Reference van der Werf, Goddard and Meyer1998; Bastin et al., Reference Bastin, Berry, Soyeurt and Gengler2012; Hurley et al., Reference Hurley, Lopez-Villalobos, McParland, Lewis, Kennedy, O’Donovan, Burke and Berry2017).
Practical implications
The use of mid-IR spectroscopy to generate predicted phenotypes
The heritability and repeatability estimates of milk mineral concentration in the present study suggest that, ignoring parental contribution, a sire must have information on at least 15 (Ca), 46 (K), 42 (Mg), 37 (Na) and 20 (P) progeny to achieve a reliability of 70% for estimated genetic merit for milk mineral concentration using traditional genetic evaluation methods. Therefore, an economic disadvantage exists in recording milk minerals on a large scale for breeding purposes. To date, the only viable solution to reduce phenotyping cost of detailed milk constituents is the use of mid-IR spectroscopy (De Marchi et al., Reference De Marchi, Toffanin, Cassandro and Penasa2014). Indeed, once prediction models are developed and validated, the cost of generating such phenotypes is negligible. Another benefit of using mid-IR predicted phenotypes is the possibility of obtaining multiple measurements on a large number of animals, leading to an increase in the response to selection after one selection round. Because the phenotypic variance of milk minerals explained by the prediction models was moderate, predicted phenotypes contain prediction error which may be a limitation for the implementation of milk payment schemes. Such an issue should not, however, discourage the development of breeding schemes for improved milk quality, including milk minerals, especially in countries specialized in milk manufacturing. Indeed, from the industry point of view, the delivery of milk suitable for processing is a relevant issue (FAO, 2017) and, because of the presence of exploitable genetic variation, it could be targeted also by breeding. The involvement of stakeholders in the development of a selection index for milk quality should be encouraged in all phases of the implementation because milk quality is not only economically important but also is related to public health issues, as in the case of milk minerals. Another important issue related to the use of mid-IR spectroscopy would be to set up a quality control system to monitor the accuracy of prediction across a wide range of diverse management and breeding systems. Indeed, if selection pressure on milk minerals is applied, the genetic gain would result on a base change of the reference population. One strategy to control any deterioration in the accuracy of prediction would be to analyze, using gold standard methods, any milk samples that deviate substantially from the metrics of the reference population; one such metric could be the Mahalanobis distance of the spectrum of each sample from the spectral of the reference population.
Alteration of the lactation profile of milk minerals
Results from the present study clearly demonstrated that breeding strategies could also potentially alter the lactation profile of milk minerals and identify animals deviating considerably from a standard lactation profile (Kirkpatrick et al., Reference Kirkpatrick, Lofsvold and Bulmer1990; van der Werf et al., Reference van der Werf, Goddard and Meyer1998). Such strategies, which are commonly used in the genetic evaluation of production traits in dairy cattle worldwide, are extremely advantageous in production systems characterized by seasonal calving in which milk supply, and consequently milk composition, is subjected to substantial variability across calendar months of the year (Berry et al., Reference Berry, Kearney, Twomey and Evans2013). In all instances in the present study, the first eigenfunction was positive throughout lactation and was associated with the largest proportion of genetic variance. This suggests that most of the potential of breeding for milk mineral concentration is on the ability to alter the height of the lactation profile across all DIM. Breeding, however, through selection pressure on the relevant eigenfunction, could still be used to change the lactation profile for each mineral separately in order to meet specific targets and requirements from the dairy industry. A similar conclusion was proposed by Visentin et al. (Reference Visentin, McParland, De Marchi, McDermott, Fenelon, Penasa and Berry2017c) who estimated variance components for milk processing characteristics also using random regression models.
Impact of current breeding objectives
Given the positive genetic correlations among all the milk minerals examined in the present study (with the exception of the zero genetic correlation between Ca and Na), selection alone for one milk mineral is expected to also increase the concentration of the other minerals. Such an implication may have negative consequence from a nutritional point of view as the current nutritional guidelines recommend to reduce the ingestion of Na (Whelton and He, Reference Whelton and He2014). Therefore, if milk mineral concentration is considered as a breeding objective, Na should be included as a goal trait with negative selection pressure to hold it constant, or eventually reduce it. Given the correlations with Na were all less than one, then a reduction in mean genetic merit for Na simultaneous with an increase in genetic merit for the other minerals is possible. Indeed, the reduction of the CVg of Na after adjustment for the correlation with the other studied minerals was almost null for Ca, 20% for K, 7% for Mg and 4% for P. Breeding objectives of Holstein cattle in various countries, such as Switzerland, Germany, Spain, France and Italy place emphasis also on protein and fat percentage (Miglior et al., Reference Miglior, Muir and Van Doormaal2005). In the Italian Holstein-Friesian cattle population, the genetic gain achieved since the year 1997 is 0.06 and −0.45 units for protein percentage and SCS, respectively (ANAFI, 2017). Therefore, the genetic merit since 1997 of Ca, K, Mg, Na and P has increased, on average, by 13.89 mg/kg, 2.38 mg/kg, 1.81 mg/kg, 0.69 mg/kg and 12.30 mg/kg, respectively, solely attributable to indirect selection from selection on protein percentage. Similarly, because of the positive correlation between SCS and Na concentration, since the year 1997 the genetic merit of Na of the Holstein-Friesian population has decreased by 9.91 mg/kg, as selection attempts to reduce SCS. The national breeding objectives of Holstein-Friesian cattle are therefore indirectly selecting for improving the nutritive value of bovine milk. However, the CVg of minerals adjusted for protein concentration and SCS suggests that for all minerals the most relevant proportion of variation is still not fully exploited by the national breeding schemes for improving cattle genetic merit of milk minerals. The application of breeding schemes aiming to enhance milk composition may lead to an improvement in both the nutritional value and technological properties of the milk. Milk and dairy products play a central role in human health for the fulfillment of dietary minerals recommended daily intake. Moreover, milk minerals and in particular Ca, Mg and P, are involved in the stabilization of casein micelles and thus in milk rennet reactivity (Franzoi et al., Reference Franzoi, Niero, Penasa, Cassandro and De Marchi2018). Using the evidence from the present study, the maximum accuracy of an animal’s genetic merit for milk minerals ranges from 17% (Na) to 72% (Mg). Having access to the actual milk mineral phenotypes would increase the accuracy of estimated breeding value (EBV) for such traits and, with information on 30 progeny, which is the minimum number of progeny needed for the official publication of bulls genetic merit for production traits in Italian Holstein-Friesian population, the accuracy of EBV would be >80% for all the minerals considered in the present study.
In a restriction of selection index where the only goal trait is protein percentage, if an economic value is applied separately to each mineral so that the emphasis given to both traits equates, the genetic gain of mineral increases by 13% (Mg) to 44% (Ca). The exception was represented by K where the response in such scenario was more than doubled given the relative weak genetic correlation all throughout lactation, as evidenced from the present study. However, the actual genetic gain would be dependent also on all covariances existing between milk minerals and all traits in the national breeding goal, but also on the economic weight placed on them as well as on the selection intensity and the number (and type) of information available nationally. Genetic selection has to deal with physiological and chemical issues that might limit the magnitude of the genetic change achievable. In particular, the major restriction for milk mineral content relates to the saline equilibrium between milk and blood, to the complex balance ratios among milk minerals, and to the solubility of minerals in milk. Because of these, it is likely that genetic selection for milk mineral content would predominantly enhance the organic portion of milk minerals, as this is not directly involved in the isotonic equilibrium between milk and blood (Gaucheron, Reference Gaucheron2005). This hypothesis is corroborated by the parallel increase of milk protein and casein content achievable through genetic selection, resulting again in a greater quantity of colloidal Ca, Mg, and P (Franzoi et al., Reference Franzoi, Niero, Penasa, Cassandro and De Marchi2018). Finally, breeding strategies applied in recent decades in dairy cows contributed to cows, on average, producing a greater quantity of milk. From a biochemical point of view, this greater milk volume could potentially support the solubility of greater amount mineral salts. Consequently, although breeding schemes selecting for protein concentration and SCS may be partially contributing to a positive (indirect) response to selection in milk mineral concentration, the full potential to genetically improve milk minerals is still not totally exploited and can be only achieved with the direct selection.
Conclusions
Results from the present study clearly reveal that exploitable genetic variation exists for the concentration of all minerals in bovine milk. Therefore, breeding strategies can alter the milk mineral in dairy cow milk, which has implications for dairy processors; nonetheless, a favorable correlated indirect response to selection in milk minerals is already expected to be occurring in most breeding programs that select for protein concentration and SCS. Direct selection, however, could augment further the genetic gain but also importantly alter the lactation profile on milk minerals concentration in order to suit a particular product portfolio.
Acknowledgments
The authors would like to thank Luis Kerschbaumer and Thomas Kerschbamer (South Tyrolean Dairy Association – Sennereiverband Südtirol, Bolzano, Italy), Christian Plitzner (Breeders Association of Bolzano province – Vereinigung der Südtiroler Tierzuchtverbände, Bolzano, Italy) and Claudio Stecchi (CTS informatica srl, Bolzano, Italy) for providing data used in this study and for technical support. This study was supported by the University of Padova (Ricerca Scientifica fondi quota EX 60% - 2014, project 60A08-7955/14, Italy).
Declaration of interest
The authors have no conflicts of interest.
Ethics statement
Procedures used in this study are excluded from the authorization of the animal welfare committee.
Software and data repository resources
None of the data were deposited in an official repository.
Supplementary material
To view supplementary material for this article, please visit https://doi.org/10.1017/S1751731118001507