Introduction
Type 2 diabetes mellitus or T2DM is caused by an increase in blood glucose level in the body due to either insulin resistance or low level of insulin secretion. A large number of factors have been reported to contribute to insulin resistance, including obesity, genetic factors, age, and prolonged high blood glucose levels [Reference Zhu, Huang and Qian1].
GPR142, an orphan G-protein-coupled receptor (GPCR) which belongs to class A orphans, is primarily expressed in pancreas [Reference Overton, Fyfe and Reynet2] and has been implicated as a lead drug target in the case of treatment of type 2 diabetes. It has been reported in mouse islets [Reference Kahn, Hull and Utzschneider3] that intracellular signal transduction initiated by tryptophan can lead to stimulation of GPR142 (agonist), which in turn increases glucose-dependent insulin secretion. Thus, targeting GPR142 as an agonist can be an effective therapy in diabetes. However, 3D structure and signaling mechanisms of GPR142 are yet to be deciphered [Reference Kaushik, Kumar, Wei and Sahi4].
GPR119, class A, rhodopsin-type orphan GPCR, has also been reported to be involved in insulin regulation [Reference Fredriksson, Höglund, Gloriam, Lagerström and Schiöth5]. Its activation enhances the accretion of intracellular cAMP and upregulation of cAMP, which in turn regulates the glucose-dependent insulin secretion, thus enhancing the release of glucagon like peptide 1, glucose-dependent insulinotropic peptide, and polypeptide YY [Reference Shah and Kowalski6]. GPR119 agonists can be exploited as potential therapeutics for diabetes therapy.
Synthetic biology is a multidisciplinary field in bioinformatics which is inclusive of electronics, genomics, and proteomics. It gives an insight into the regulatory networks underlying various diseases. Recent researches on cell behavior is mapping the underlying regulatory genetic networks led to new understandings of carcinoma metastasis [Reference Lu, Jolly and Ben-Jacob7, Reference Jolly, Huang, Lu, Mani, Levine and Ben-Jacob8, Reference Kiel, Yus and Serrano9]. Molecular based components can be used for construction of complex circuits and are easily convertible from digital to analog [Reference Bhalla and Iyengar10]. They have wide applications in construction of sensor systems simulations of the biological systems [Reference McMillen, Kopell, Hasty and Collins11] for investigating genes’ and proteins’ expression [Reference Densmore and Hassoun12]. It may be of relevance in medical and biological sciences for drug discovery through exploration of mechanisms of target and ligand interactions [Reference Hasty, Isaacs, Dolnik, McMillen and Collins13, Reference Davidson, Rast, Oliveri, Ransick, Calestani, Yuh, Minokawa, Amore, Hinman, Arenas-Mena and Otim14]. GATE-based synthetic biology can be complicated [Reference Ozbudak, Thattai, Kurtser, Grossman and Van Oudenaarden15]. In an era of drug discovery and industrial biotechnology, synthetic circuits have been shown to be effective [Reference Kitano16]. Engineering of trouble-free circuits built from side-to-side functional transmission of combinatorial libraries of the drug has been reported and may prove helpful for curing hormonal diseases [Reference Khalil and Collins17]. Systems and synthetic biology impart accurate and robust approaches and have been incorporated into established practices. They have been useful in light of increasing genome sequencing data and reduction in synthesis cost. Biological circuits classify and switch between cellular states and circuits to continually balance the states for efficient production. The circuit switches “off” when the signal is “off,” and when the signal is “on” the circuit becomes responsive in a log-linear fashion.
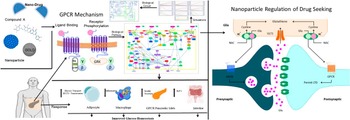
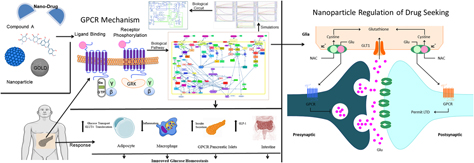
In this paper, we have investigated the effect of a potential hit nanodrug on insulin secretion using a systems biology and synthetic biology approach in GPCR signaling transduction pathway. A potential lead compound was obtained from structure-based virtual screening for GPR142 and GPR119. The biochemical pathway was constructed, and the effect of hit nanodrug on insulin secretion in the pathway was studied. This was followed by implementing corresponding Boolean circuit shown in Fig. 1.
Schematic workflow representing the methodology of the systems and synthetic biology with nanoparticles for biochemical pathway of T2D targeted by GPR142 and GPR119.

Results and discussion
Docking analysis of hit compound on GPR119 and GPR142 using a systems biology and synthetic biology approach
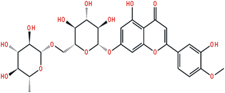
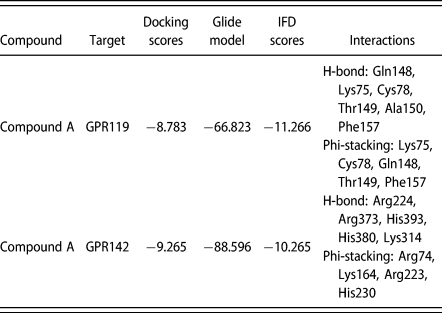
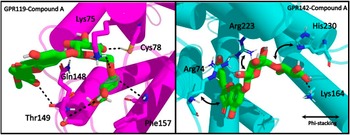
3D structural models of GPR142 and GPR119 were generated using 4N6H chain A and 2Y00 chain A, respectively, as templates. Threading was primarily used for structure prediction. Active sites were identified in both (GPR142 and GPR119) the proteins using SiteMap. Receptor-based virtual screening for both receptors (GPR142 and GPR119) was carried out using Glide of Schrodinger suite [Reference Friesner, Murphy, Repasky, Frye, Greenwood, Halgren, Sanschagrin and Mainz18, Reference Halgren, Murphy, Friesner, Beard, Frye, Pollard and Banks19, Reference Friesner, Banks, Murphy, Halgren, Klicic, Mainz, Repasky, Knoll, Shelley and Perry20]. A total of 1120 compounds out of 1,171,519 compounds were screened on the basis of docking into the active site (212, 224, 235, 238, 300, 301, 314, and 397) of the GPR142. Out of 428,507 compounds, 439 were screened by docking into the active site (42, 45, 46, 49, 123, 126, and 130) of GPR119. In the subsequent filtering step, the screened compounds which bound to both GPR119 and GPR142 were selected. The compounds were further refined by induced fit docking [Reference Farid, Day, Friesner and Pearlstein21, Reference Sherman, Day, Jacobson, Friesner and Farid22, Reference Sherman, Beard and Farid23] imparting flexibility to both ligands and receptor. Compound A was identified as the common hit compound with good binding affinity for both GPR142 and GPR119 (Fig. 2). It had a comparable docking score for both GPR119 and GPR142 as shown in Table I and formed strong H-bonds with active site residues, offering insight into the mechanism of interactions existing between Compound A and GPR142 & GPR119 receptors using the free energies calculation. In general, Compound A possesses a relatively low binding free energy (MMGBSA) in complex with GPR119 (−57.050). However, in the case of the receptor–ligand complexes between Compound A and GPR142, the maximum binding free energy (MMGBSA) of −86.677 was obtained, which illustrates the potential interaction of the complex.
Common drug compound which targeted the GPR142 and GPR119 obtained from structure-based virtual screening of GPR142 and GPR119.

Docking scores and interaction of Compound A with GPR142 and GPR119 receptors.

Molecular interaction of nanoparticles (GOLD, SPION, and CeO2) with GPR119 and GPR142 complexes
Compound A was further docked with nanoparticles (GOLD, SPION, and CeO2), where flexibility of GPR142 and GPR119 was imparted to the active site. Finally, Compound A poses were scored with nanoparticles where GOLD showed better binding affinity compared with SPION and CeO2.
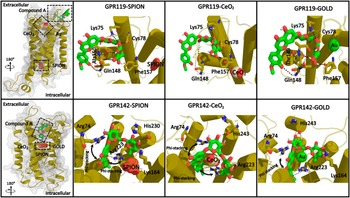
Docking results revealed that only GOLD NP showed the best fitting in the active site of GPR119 receptors (Fig. 3). It was observed that GOLD NP exhibited excellent metal interactions with Cys78 and Phe157 residues, respectively, of GPR119 (Fig. 3). However, results from CeO2 docking with GPR119 showed only Phe157 phi-stacking interaction (Fig. 3). Moreover, docking studies of SPION with GPR119 displayed phi-stacking interactions with Phe157 residue by oxygen atoms (O1 and O2) and iron (Fe) atoms along with all the oxygen atoms (O1, O2, and O3). Henceforth, these docking results indicate the direct participation of GOLD, CeO2, and SPION in molecular interaction, but the respective oxygen atoms in their vicinity presented interactions with amino acid residues of GPR119. Additionally, interaction of GPR142 with GOLD was also recorded to contribute to the stabilization of protein–metal interactions. Analysis of Compound A drug molecule, as a standard control against nanodrugs, docked with GPR142 protein showed H-bond interaction and hydroxyl group (–OH) donor–acceptor bond with Arg74, Lys164, Arg223, and His243 residues, respectively (Fig. 3). However, results from CeO2 docking with GPR142 showed only Arg223 phi-stacking interaction (Fig. 3). Moreover, docking studies of SPION with GPR142 displayed phi-stacking interactions with Lys164 and Arg223 residues by oxygen atoms (O1 and O2) and iron (Fe) atoms along with all the oxygen atoms (O1, O2, and O3) (Fig. 3).
Docked complexes of GPR142 and GPR119 with Compound A and nanoparticles.

These docking results reflected the potential binding of Compound A drug molecule and its interference with the function of with GPR142 and GPR119. Since molecular interaction of GOLD NP exhibited substantial contacts and interaction with GPR142 and GPR119 at the active sites, GOLD NP was deduced as a potential inhibitor of GPR142 and GPR119.
Systems biology approach to construct biochemical pathways of GPR142 and GPR119
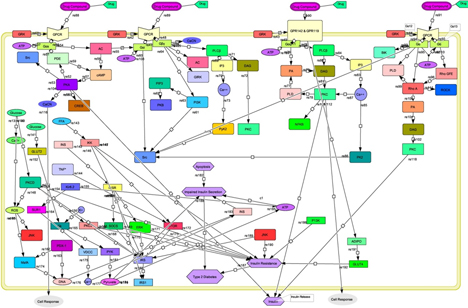
Eighty-nine entities were used, 56 genes, 25 proteins, 1 drug molecule, 5 ions, and 2 receptors, as shown in Fig. 4, and for simulation, COPASI software was used [Reference Hoops, Sahle, Gauges, Lee, Pahle, Simus, Singhal, Xu, Mendes and Kummer24]. Following genes were used: Gαi, Gβ, Gαi, Gαq/11, Gα, AC, PDE, CREB, PKC, and Rho GFE. Phospholipids used were phosphatidylinositol (3,4,5)-trisphosphate, existing in plasma membrane; phosphatidylinositol-3-kinases (PI3K), which are intracellular signal transducer enzymes involved in various cellular functions; cyclic adenosine monophosphate (cAMP), which is a second messenger involved in intracellular signal transduction including regulation of glycogen and sugar; and diacylglycerol (DAG), functioning as a second messenger signaling lipid. PIP3 activates downstream signaling components which in turn activate signaling pathways essential for cell growth and survival. PI3Ks are known to interact with the insulin receptor substrate (IRS) and are involved in the regulation of glucose uptake. DAG is also known to be an activator of protein kinase C. Proteins used were GRK, PKA, Src, PKB, GIRK, PLCβ, IP3, PyK2, PA, PLD, NFKB, PK2, Rho A, BtK, and ROCK, and receptors used were GPCR (Gαs), GPCR (Gαi), GPR142 and GPR119 (Gαq), and GPCR (Gα12/13).
GPR142 and GPR119 biochemical pathways investigating the effect of common Compound A on insulin secretion.

Stimulation of targeted receptors by various hormones, growth factors, and Compound A, stimulates hydrolysis of phosphatidylinositol 4,5-bisphosphate by phospholipase C and produces two second messengers DAG and inositol 1,4,5-trisphosphate through activation of Gq, as shown in Supplementary material [Fig. S1].
The insulin transduction pathway is involved in maintaining glucose hemostasis. When the blood glucose concentration is higher, β cells of the pancreas release insulin to promote an uptake of glucose from the blood stream. Glucose uptake is controlled by GLUT proteins, which belong to the family of facilitative glucose transporter proteins, and the glucose transporter GLUT2, expressed in β cells, gets activated. Glycolysis occurs and adenosine triphosphate (ATP) molecules are generated. It also leads to the opening of voltage-dependent Ca+ channels which eventually trigger the release of insulin. The binding of insulin to insulin receptor (IR) and insulin-like growth factor-1 leads to a cascade of cellular processes further activating the kinase. Activation of insulin receptor substrates (IRSs) phosphorylates phosphatidylinositol 4,5-bisphosphate to produce phosphatidylinositol (3,4,5)-trisphosphate, while phosphatidylinositol (3,4,5)-trisphosphate recruits Akt to the plasma membrane and induces downstream signaling. IRS has also been implicated in regulating GLUT4-dependent glucose uptake in response to insulin.
The different isoforms of protein kinase C are mediators of metabolic function of insulin. They are crucial in insulin-stimulated glucose transport, and their expression is reduced in diabetes.
The suppressor of cytokine signaling family proteins is acknowledged to negatively regulate insulin signaling. Its expression is increased in obesity. It either inhibits the tyrosine kinase activity of the IR or competes for binding of the IRS proteins to the receptor, thereby inducing insulin resistance, as shown in Supplementary material [Fig. S2].
Simulation studies of biochemical pathway
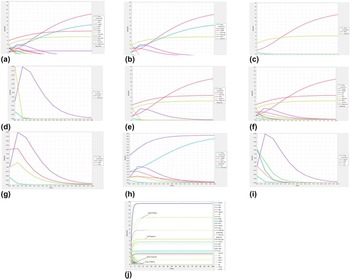
Systems biology is study of biological components and simulation data predicting the biological behavior and identifying processes or functions in a system. Concentration of Compound A was considered on the basis of analysis at different concentrations (0.4 μ/mol interval) using kinetic simulation as shown in Fig. 5. The mechanism of action of probable GPR142 agonists can also be elucidated from Supplementary material [Table S1], where the effect of the probable drug on DAG and PKC signaling network can help in understanding which genes would respond to insulin and improved glucose tolerance.
Panels a–j: Kinetic simulation of the whole system (GPR142 and GPR119 complexed with Compound A with NP biochemical pathway) in type 2 diabetes. The different colored lines are indicative of the amount of different species, where X-axis represents the time and Y-axis represents the amount (concentration) of species.

Panel a—Panel a represents the kinetic simulation graph during 10-s simulation plotted to investigate the effect of Compound A with NP on insulin. Cyclic adenosine monophosphate (cAMP) is an intracellular second messenger that is usually obtained by binding of drug to G-protein-coupled and protein kinase (PKA); both regulates glucose homeostasis including insulin and glucagon secretion, glucose uptake, glycogen synthesis, and breakdown. DAG leads to the activation of protein kinase (PKC). Phosphatidylinositol (3,4,5)-trisphosphate (PIP3) and inositol 1,4,5-trisphosphate (IP3) release calcium (Ca2+) from intracellular stores, thereby recruiting signaling proteins to membranes. Pyruvate from glucose can be metabolized via pyruvate carboxylase (PC), when β cell failure in the pathogenesis of obesity occurs which leads to insulin resistance. Insulin and insulin-like growth factors 1 and 2 act via IRSs. In adipose tissues, secondary target tissue of insulin, glucose transport via translocation of GLUT4 from an intracellular surface to the cell surface and due to mutation of GLUT4 and IRS causes insulin resistance or type 2 diabetes. This biochemical pathway simulation indicates the importance of structure-based virtual screening of Compound A with NP, which induces the glucose and cAMP and enhances insulin secretion.
Panel b—Kinetic simulation carried out with respect to different transition times and amount of the species is described in panel b, where X-axis shows the time 10 s and Y-axis concentration. In this simulation, we investigated the effect of Compound A on insulin cAMP, glucose, pyruvate, IRS1, and GLUT4. Both IRS and GLUT4 are enhanced in the presence of Compound A, with NP and cAMP induced by Compound A with NP.
Panel c—Panel c indicates the kinetic simulation studies of GLUT4 and IRS1 with respect to different transition times where both are enhanced by Compound A with NP. In the normal phenomenon, IRS1 is a protein that phosphorylates insulin, while GLUT4 protein is used to activate the GLUT4 receptor, which lets glucose to enter the cell. Mutations of both proteins by any of the factors cause type 2 diabetes, but in this simulation studies, both are enhanced in the presence of Compound A with NP.
Panel d—Panel d depicts the kinetic simulation studies of insulin secretion, increased by Compound A at 1.0 while glucose induced by Compound A at same transition state 1.0. This shows that after a certain time with specific concentration (0.4 l/mol) insulin secretion were up-regulated and correspondingly glucose secretion was down-regulated.
Panel e—Panel e indicates the simulation studies of insulin, glucose, IRS1, GLUT4, and cell response in the presence of Compound A and NP with respect to different transition times and their amount in concentration, where all are enhanced excluding glucose.
Panel f—Panel f represents the simulation studies of insulin, cAMP, IP3, AC, PKC, glucose, IRS1, GLUT4 with their cell response. Convincing evidence indicates that melatonin inhibits protein kinase C (PKC) signaling. IRSs 1 and 2 (IRS) bind with insulin molecules and then activate the GLUT4 receptor to glucose metabolized. In this analysis, all peaks are enhanced except cAMP pathway with respect to different transition times (10 s) and their amount in concentrations (3.0 μ/mol).
Panel g—Panel g indicates the simulation studies of insulin, DAG, and PKC with respect to different transition times (10 s) and their amount in concentrations (3.0 μ/mol), where protein kinase C (PKC) mediates the effects of fat because they are lipid-dependent kinases which play crucial roles in signal transduction, including the positive and negative modulation of insulin action. Acute elevation of DAG in this fashion by insulin results in PKC activation at intracellular sites.
Panel h—Panel h indicates simulation studies which include insulin, cAMP, PKC, IKK, pyruvate, and their cell response, where cell response enhances with nanodrug except cAMP, while insulin, PKC, IKK, and pyruvate all are enhanced by nanodrug at 0.4 μ/mol.
Panel i—Panel i indicates the kinetic simulation studies of insulin, PIP3, IP3, and AC, where phosphatidylinositol (3,4,5)-trisphosphate (PIP3) and inositol 1,4,5-trisphosphate (IP3) release calcium (Ca2+) ion from intracellular region and engage GPR142 and GPR119 signaling proteins to membranes.
Panel j—Kinetic simulation carried out with respect to different transition times and amount of the species is described in Fig. 5, where panel j shows the 100-s (time) simulation results of GPR142 and GPR119 biochemical pathways against type 2 diabetes and the effect of Compound A with NP. The minimum effective concentration of nanodrug was 0.4 (μ/mol), which had positive effect on insulin secretion and was more stable in final time frames. Results also represent the dynamic perturbations occurring in different states of all species over a period of time frame ranging from 0 to 100 s.
In the time course simulation analysis of the type 2 diabetes biochemical pathway, glucose appears in plasma in the presence of drug doses, where red lines indicate glucose concentration. X-axis represents the time (hour) and Y-axis represents the states [Supplementary material (Fig. S3)], and results showed normal production of insulin. The time course simulation studies were carried out using different concentrations of compounds, where the optimum concentration that enhanced insulin production was taken as 0.4 μ/mol.
Systems biology reactions to validate potential nanodrug activity in entire systems in case of type 2 diabetes
Ordinary differential equations (ODEs) to model nanodrug concentration
Nanodrug injections can be modeled over time through ordinary differential equations (ODEs) of systems biology approach, as shown in the following equations:
d([Stomach Glu Solid])/dt = −ReactionFlux1,
d([Stomach Glu Tritur])/dt = ReactionFlux1 − ReactionFlux2,
d([Gut Glu])/dt = ReactionFlux2 − ReactionFlux3,
d([Plasma Glu])/dt = ReactionFlux4 − ReactionFlux5 + ReactionFlux6 − ReactionFlux8 − ReactionFlux9,
d([Tissue Glu])/dt = ReactionFlux5 − ReactionFlux7,
d([Interstitial Ins])/dt = 1/Insulin secretion × (ReactionFlux16 − ReactionFlux17),
d([Portal Ins])/dt = ReactionFlux10 − ReactionFlux11,
d([Liver Ins])/dt = ReactionFlux11 − ReactionFlux12 − ReactionFlux13,
d([Plasma Ins])/dt = ReactionFlux12 − ReactionFlux14,
d([Ins Delay 1])/dt = 1/Insulin secretion × (ReactionFlux15 − ReactionFlux18),
d([Ins Delay 2])/dt = 1/Insulin secretion × (ReactionFlux18 − ReactionFlux19),
d([Delayed Glu Signal])/dt = −alpha × ([Delayed Glu Signal] + ([Delayed Glu Signal Mode] == 0) × [Basal Ins Secr] − ([Delayed Glu Signal Mode] == 1) × beta × ([Plasma Glu Conc] − [Basal Plasma Glu Conc])),
d([Plasma Glu Conc])/dt = [Plasma Glu Conc Rate].
Fluxes
In this case, a diabetic patient would be receiving nanodrug doses at regular intervals (lunch and evening meal) which would be metabolized. This creates a discrete function, which is part of a continuous function:
ReactionFlux1 = k gri × [Stomach Glu Solid],
ReactionFlux2 = k empt × [Stomach Glu Tritur],
ReactionFlux3 = k abs × [Gut Glu],
ReactionFlux4 = [Glu Appear Rate],
ReactionFlux5 = k 1 × [Plasma Glu] − k 2 × [Tissue Glu],
ReactionFlux6 = [Glu Prod],
ReactionFlux7 = [Ins Dep Glu Util],
ReactionFlux8 = [Ins Ind Glu Util],
ReactionFlux9 = [Glu Excretion],
ReactionFlux10 = [Ins Prod],
ReactionFlux11 = [Ins Secr],
ReactionFlux12 = m 1 × [Liver Ins] − m 2 × [Plasma Ins],
ReactionFlux13 = m 3 × [Liver Ins],
ReactionFlux14 = m 4 × [Plasma Ins],
ReactionFlux15 = (k i × [Plasma Ins Conc]) × [Insulin secretion],
ReactionFlux16 = (p2U × ([Plasma Ins Conc] − [Basal Plasma Ins Conc])) × [Insulin secretion],
ReactionFlux17 = (p2U × [Interstitial Ins]) × [Insulin secretion],
ReactionFlux18 = (k i × [Ins Delay 1]) × [Insulin secretion],
ReactionFlux19 = (k i × [Ins Delay 2]) × [Insulin secretion].
Repeated assignments
The given ODEs depict that the amount of drug in the bloodstream is changing over a period of time while injections of the drug are being discrete. Here we transform this into a function:
[Plasma Ins Conc] = [Plasma Ins]/[Plasma Volume (Ins)],
[Ins Secr] = gamma × [Portal Ins],
[Hepatic Extraction] = −m 5 × [Ins Secr] + m 6,
m 3 = [Hepatic Extraction] × m 1/(1 − [Hepatic Extraction]),
[Glu Excretion] = ([Glu Excretion Mode] == 1) × k e1 × ([Plasma Glu] − k e2),
V m = V m0 + V mx × [Interstitial Ins],
[Ins Dep Glu Util] = V m × [Tissue Glu]/(K m + [Tissue Glu]),
[Glu Util] = [Ins Ind Glu Util] + [Ins Dep Glu Util],
[Glu Appear Rate] = f × k abs × [Gut Glu] × (basis/[Body Weight]),
[Glu Prod] = k p1 − k p2 × [Plasma Glu] − k p3 × [Ins Delay 2] − k p4 × [Portal Ins],
[Plasma Glu Conc Rate] = ([Glu Prod] + [Glu Appear Rate] − [Ins Ind Glu Util] − [Glu Excretion] − k 1 × [Plasma Glu] + k 2 × [Tissue Glu])/[Plasma Volume (Glu)],
[Ins Prod] = [Delayed Glu Signal] + [Basal Ins Secr] + ([Ins Prod Mode] == 1) × K × [Plasma Glu Conc Rate],
[Stomach Glu] = [Stomach Glu Solid] + [Stomach Glu Tritur],
k empt = k min + 0.5 × (k max − k min) × (tanh(a × ([Stomach Glu] − b × [Stomach Glu After Dosing])) − tanh(c × ([Stomach Glu] − d × [Stomach Glu After Dosing])) + 2).
Parameter values
Pharmacodynamics parameters and values referring to drug concentration at the site of action with a resulting effect are considered, which also include time course and intensity of therapeutic and adverse effects:
timeSmall = 1 picosecond,
timeEveningMeal = 20 h,
timeLunch = 12 h,
b = 0.68 dimensionless,
d = 0.09 dimensionless,
k min = 0.0076 1/min,
k max = 0.0465 1/min,
k abs = 0.023 1/min,
f = 0.9 dimensionless,
Basis = 1 kg,
[Body Weight] = 78 kg,
k 1 = 0.042 1/min,
k 2 = 0.071 1/min,
[Basal plasma Glu Conc] = 164.18 mg/dL,
[Plasma volume (Glu)] = 1.49 dL,
[Ins Ind Glu Util] = 1 mg/min,
k e1 = 0.0007 1/min,
k e2 = 269 mg,
V m0 = 4.65 mg/min,
K m = 466.21 mg,
Alpha = 0.013 1/min,
K = 1.15 pmol/(mg/dL),
[Basal plasma Ins Conc] = 54.81 pmol/L,
m 1 = 0.379 1/min,
m 2 = 0.673 1/min,
m 4 = 0.269 1/min,
m 5 = 0.0526 min/pmol,
m 6 = 0.8118 dimensionless,
[Plasma volume (Ins)] = 0.04 L,
k i = 0.0066 1/min,
p2U = 0.084 1/min,
Gamma = 0.5 1/min,
k p1 = 3.09 mg/min,
k p2 = 0.0007 1/min,
k p3 = 0.018 (mg/min)/(pmol/L),
k p4 = 0.0786 (mg/min)/pmol,
[Glucose appearance] = 1 L,
[Insulin secretion] = 1 L,
[Stomach Glu] = 0 mg,
[Glu Prod] = 1.2992 mg/min,
k empt = 0.046241 1/min,
[Glu appear rate] = 0 mg/min,
V m = 4.65 mg/min,
[Ins Dep Glu Util] = 1.0768 mg/min,
[Glu excretion] = 0 mg/min,
[Plasma Glu Conc Rate] = 0 (mg/dL)/min,
[Ins Prod] = 4.0266 pmol/min,
[Ins Secr] = 4.0266 pmol/min,
[Hepatic extraction] = 0.6 dimensionless,
m 3 = 0.5685 1/min,
[Plasma Ins Conc] = 0.059875 pmol/L,
[Glu Util] = 2.0768 mg/min,
Initial conditions
[Stomach Glu Solid] = 0 mg,
[Stomach Glu Tritur] = 0 mg,
[Gut Glu] = 0 mg,
[Plasma Glu] = 244.63 mg,
[Tissue Glu] = 140.5 mg,
[Interstitial Ins] = 0 pmol/L,
[Portal Ins] = 8.0532 pmol,
[Liver Ins] = 5.9496 pmol,
[Plasma Ins] = 2.395 pmol,
[Ins Delay 1] = 54.81 pmol/L,
[Ins Delay 2] = 54.81 pmol/L,
[Delayed Glu Signal] = 0 pmol/min,
[Plasma Glu Conc] = 164.18 mg/dL,
Dose = 0.4 μ/mol,
[Stomach Glu After Dosing] = 0.4 μ/mol,
a = 6.25 × 10⁻⁵ 1/mg,
c = 0.00022222 1/mg,
k gri = 0.0465 1/min,
[Glu excretion mode] = 0 dimensionless,
V mx = 0.094 (mg/min)/(pmol/L),
Beta = 0.055 (pmol/min)/(mg/dL),
[Delayed Glu Signal Mode] = 1 dimensionless,
[Ins Prod Mode] = 0 dimensionless,
[Basal Ins Secr] = 4.0266 pmol/min,
[Basal Glu Prod] = 1.2992 mg/min.
Validation with experimental data (role of tryptophan in type 2 diabetes)
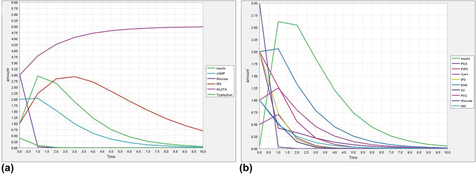
As reported in the literature [Reference Inubushi, Kamemura, Oda, Sakurai, Nakaya, Harada, Suenaga, Matsunaga, Ishidoh and Katunuma25], L-tryptophan suppresses glucose and enhances insulin production. Figure 6 Panel a represents the kinetic simulation analysis showing that L-tryptophan increases insulin secretion of β cells. Panel a depicts the effect on insulin, cAMP, glucose, IRS, and GLUT4 in the presence of tryptophan, while Panel b reflects the effect on insulin, PKA, PIP3, Ca++, IP3, DAG, AC, PKC, glucose, and INS in the presence of tryptophan at 0.4 (μ/mol) concentration. Different peaks indicate the species; X-axis indicates the time in seconds, while Y-axis indicates the amount in concentrations. Tryptophan concentration was considered on the basis of analysis at different concentrations (0.5 μ/mol interval) using a kinetic simulation approach. According to this study, tryptophan suppressed glucose and enhanced the insulin production in a glucose-dependent manner, which is in agreement with the experimental observations reported in the literature. Also, nanodrug has effects similar to L-tryptophan as it suppressed glucose and enhanced insulin secretion at a lower concentration.
Panels a–b: Kinetic simulation to study the effect of L-tryptophan on GPR142 and GPR119 biochemical pathways. The different colored lines indicate the different species, where X-axis indicates the time and Y-axis indicates the amount of species.

Engineering of GPR142 and GPR119 biochemical pathway in type 2 diabetes and investigation of the effect of common probable lead compound
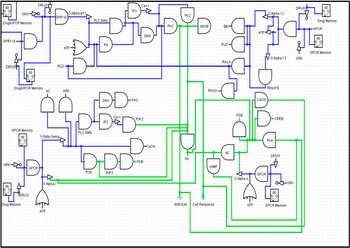
Synthetic biology can construct artificial Boolean network, using a DNA computing approach, which can traverse the whole regulatory mechanism. It is based on biological circuit silicon chip implemented on A, C, T, and G units, thereby allowing organisms to sense and control the regulatory systems. Here, we constructed the biological circuit of GPR142 and GPR119 biochemical pathways for type 2 diabetes and analyzed the effect of nanodrug on it as shown in Fig. 7. The construction revealed the remarkable feature of the compound’s effect on signaling pathways by activating and enhancing insulin secretion immediately in milliseconds to nanoseconds, even though the turn of changes might be more rapid. The interaction of entities in the pathway with GPR142 and GPR119 was analyzed in the form of 0 and 1. The blue lines in Fig. 7 depict the active entities and green lines indicate the production phase. The complete circuit is based on logic GATE.
Synthetic biology of the whole system of GPR142 and GPR119 biochemical pathways for type 2 diabetes and analysis of the effect of nanodrug on the pathway.

Simulation of biological circuit in the presence of nanodrug
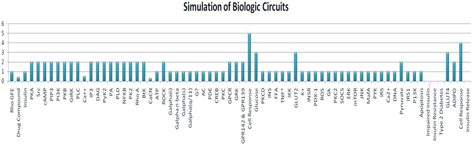
Simulation values were assigned on the basis of Boolean format (1 and 0), to study the active (1) and inactive (0) species. In Fig. 8, straight bars indicate active species and blank regions indicate the inactive species involved in this biochemical pathway of type 2 diabetes. X-axis indicates the species (genes, proteins, ions, drugs, and other interacting molecules) and Y-axis indicates the concentrations described.
Simulation of biological circuit. Effect on different species when nanodrug binds to GPR142 and GPR119 involved in the type 2 diabetes pathway in the form of circuits. X-axis represents the total number of species and Y-axis represents the amount (mol/L).

Applications in biotechnology and medicine
Biological circuit networks will be effective in drug discovery, biotechnology, and industrial biotechnology [Reference Kaushik, Kumar, Dwivedi, Bharadwaj, Kumar, Bharti, Kumar, Chaudhary and Mishra26]. The application and utility of synthetic biology using an in vitro approach for engineering signaling pathways is to make an artificial intelligence cell which will respond to their signals [Reference Shaikh, Pandey, Talpur, Kaushik and Niazi27]. Some researchers are working on protein peptide engineering and building new synthetic proteins using a synthetic biology approach [Reference Kaushik, Bharadwaj, Kumar and Wei28]. In future studies, we can use synthetic biology implementation in cells using molecular biology and computational techniques to cure many hormonal diseases.
Conclusions
Virtual circuits and their sensor systems respond to the environment. Construction of synthetic biology circuits requires information regarding cell transduction, mechanism of genes and protein interacting within a cell, or their response to outer surface of the cell in form of logical circuits. Systems biology is essential for the construction of biological circuits as it provides Boolean networks in a large-scale network. The goal of this paper was to construct and simulate circuits using a systems and synthetic biology approach which can be used to control the biological regulatory pathways, especially for type 2 diabetes. In this article, we reported GPR142 and GPR119 pathways which are involved in type 2 diabetes and investigated the effect of a screened nanodrug (Compound A, and GOLD, SPION and CeO2) on insulin secretion in the pathway. At present, twelve classes of drugs have been approved by the FDA to aid with glycemic control; however, most of the drugs have side effects; there is a need to develop new nanodrug agents. GPR142 and GPR119 agonists could provide alternative therapies with a reduced risk of hypoglycemia. Compound A and NP (GOLD, SPION, and CeO2) can act as a probable lead and can be further modified to develop into a potential lead for agonists with high efficacy and better safety profile. The biological circuits can be developed into sensors which may respond to extracellular as well as intracellular signals. This opens up a new avenue in the therapy of diabetes.
Materials and methods
The following methodology was adapted:
Sequence retrieval, molecular modeling, protein preparation, receptor-based virtual screening, and energy calculations of GPR142 and GPR119
The sequences of GPR142 and GPR119 (ID Q7Z601 and ID Q8TDV5, respectively) were retrieved from UniProt database [Reference Chen, Huang and Wu29, Reference Pundir, Martin and O’Donovan30]. Threading method, which employs sequence–structure alignment and folding patterns, was used to predict 3D structural models of GPR142 and GPR119. Reference templates 4N6H and 2Y00 were used for GPR142 and GPR119, respectively. SiteMap was used to identify the active sites in the predicted models. First step was setup of site points which were defined on receptor grid; limit for the number of site points for the receptor site was set to 15, while the number of sites was 5. OPLS force fields (Optimized Potentials for Liquid Simulations) were used for all calculations. Structure-based virtual screening was performed for GPR142 and GPR119 to screen the potential hit compound (Compound A, Fig. 9) which docked well to both the receptors.
Panel (b) represents the complex of GPR142 docked with Compound A, and Panel (a) represents the complex of GPR119 docked with Compound A.

Virtual screenings were carried out using Glide; in the initial stages, the databases (library of compounds) were converted into a phase database with standard parameters. In the next stage, structure-based virtual screenings was performed on the active site region of GPR142 and GPR119.
Compound libraries were converted to 2D to 3D formats for docking. Receptor grid was created with the centroid of active site residues with van der Waals scaling factor and partial charge. LigPrep was used to filter the ligands to expand protonation and tautomeric states. Different libraries were used for screening of lead compounds for GPR142 and GPR119 like ZINC, SchrodingerDB, PUBCHEM, DrugBank, TimTec, Not annotated NCI, Marine, ChemBank, Anti-HIV NCI, Drug Likeness NCI, Asinex Ltd., and ChEBI. Screenings were carried out in three phases: structure-based virtual screening, standard precision, and extra precision, with concentrated number of generations grounded by lowest free binding energy. The top ligand poses were screened. Compound A was obtained after receptor-based virtual screening of different libraries of compounds with GPR142 and GPR119. Compound A was selected as it showed good affinity for both GPR142 and GPR119 (Fig. 9).
Induced fit docking
Compound A was further estimated by induced fit docking where flexibility of GPR142 and GPR119 were imparted to the active site. Induced fit docking was carried out in various phases. In the first step, Compound A was docked to the rigid protein using softened potential docking with van der Waals radii scaling factor for GPR142 and GPR119 complexes, respectively. In the next step, receptor sampling and refinement were performed using extra precision. Finally, Compound A poses were scored using a combination of Glide Score and Prime.
Molecular modeling of nanoparticles with GPR119 and GPR142
Based on biodegradability, biocompatibility, and drug delivery across BBB as reported in the literature, cerium oxide (CeO2) (CID_73963), SPION (Fe2O2) (CID_16211978), and GOLD (Au) (CID_23985) NP were selected as nanoparticles for docking with GPR142 and GPR119 using Genetic algorithm from AutoDock (using custom atom type parameters for GOLD, SPION, and CeO2) to calculate the reliability of complexes. The nanoparticles used in analysis were less than 100 nm in size.
Biological pathway designing for type 2 diabetes
To retrieve, build, and execute the in silico pathway for type 2 diabetes, data mining was done to extract the necessary information for the GPR142 and GPR119. The data regarding genes, proteins, truncating and generic proteins, role of the screened drug, ions, and other entities were retrieved. GPR142, GPR119, Gαs, Gαi, Gαq/11, Gα12/13, and GLUT4 have been identified as key molecules in the GPR142-regulated type 2 diabetes pathway constructed by our research group and as also mentioned in the literature [Reference Kaushik and Sahi31, Reference Kaushik and Sahi32, Reference Kaushik and Sahi33]. The data and information about interacting entities and molecules, including their concentration, were retrieved from various sources such as databases and from the literature [Reference Harmar, Hills, Rosser, Jones, Buneman, Dunbar, Greenhill, Hale, Sharman, Bonner and Catterall34, Reference Kanehisa, Goto, Sato, Kawashima, Furumichi and Tanabe35, Reference Muto, Kotera, Tokimatsu, Nakagawa, Goto and Kanehisa36, Reference Moriya, Itoh, Okuda, Yoshizawa and Kanehisa37, Reference Moriya, Shigemizu, Hattori, Tokimatsu, Kotera, Goto and Kanehisa38, Reference Yamanishi, Hattori, Kotera, Goto and Kanehisa39, Reference Kanehisa41, Reference Kanehisa42, Reference Kanehisa43, Reference Kanehisa and Goto44, Reference Kanehisa, Goto, Kawashima and Nakaya45, Reference Kanehisa, Goto, Kawashima, Okuno and Hattori46, Reference Kanehisa, Goto, Hattori, Aoki-Kinoshita, Itoh, Kawashima, Katayama, Araki and Hirakawa47, Reference Kanehisa, Araki, Goto, Hattori, Hirakawa, Itoh, Katayama, Kawashima, Okuda and Tokimatsu48, Reference Kanehisa, Goto, Furumichi, Tanabe and Hirakawa49, Reference Kanehisa, Goto, Sato, Furumichi and Tanabe50, Reference Kanehisa51, Reference Okuda, Yamada, Hamajima, Itoh, Katayama, Bork, Goto and Kanehisa52, Reference Kotera, Yamanishi, Moriya, Kanehisa and Goto53, Reference Nakaya, Katayama, Itoh, Hiranuka, Kawashima, Moriya, Okuda, Tanaka, Tokimatsu, Yamanishi and KEGG54, Reference Hattori, Okuno, Goto and Kanehisa55, Reference Hattori, Tanaka, Kanehisa and Goto56, Reference Oh, Yamada, Hattori, Goto and Kanehisa57]. Drug effective pathways for GPR142 and GPR119 were constructed as shown in Fig. 4 using interacting species within cell compartments. Different coloring nodes represent the genes, proteins, and other entities, black edges represent the connectivity of one node to another, and the complete pathway was designed using Cell Designer software [Reference Funahashi, Morohashi, Kitano and Tanimura58, Reference Funahashi, Jouraku, Matsuoka and Kitano59, Reference Funahashi, Matsuoka, Jouraku, Morohashi, Kikuchi and Kitano60].
Evaluation of pharmacokinetic parameters of screened Compound A
To assess the pharmacokinetic parameters (in silico) in the presence of potential screened compounds, the initial values for each molecule were assigned in the form of concentration where Michaelis–Menten equation and mass action kinetics equation were applied for simulations; the genes and proteins involved in the interaction network and the effect of Compound A and NP (GOLD, SPION, and CeO2) on insulin secretion were investigated. Interaction network of GPCRs, GPR142, GPR119, Gαs, Gαi, Gαq/11, and Gα12/13 and the effect of Compound A and NP (GOLD, SPION, and CeO2) on insulin secretion effect were studied using COPASI [Reference Arkin, Ross and McAdams61, Reference Mendes62]. Kinetic simulation graph is shown in Fig. 5.
Kinetic simulation is a useful method to estimate the effective dose of a test drug. Most of the drugs follow first-order kinetics at therapeutic doses, which follows Michaelis–Menten equation as shown below:
 $$V = {{\left( {{V_{\max }}} \right) \cdot \left( S \right)} \over {{K_{\rm{m}}} + S}}\quad .$$
The above can be transformed into:
 $$C = {{\left( {{C_{\max }}} \right) \cdot \left( D \right)} \over {{K_{\rm{m}}} + D}}\quad ,$$
where C is indicative of the steady-state concentration, A the amount absorbed, C max is maximum value for concentration C, and D is the dose.
All the relevant information for the GPR142 and GPR119 was extracted through data mining. A pathway was constructed to evaluate and validate the activity of Compound A with NP.
Boolean network construction and simulation analysis using synthetic biology
Memory-based biological synthetic circuit was constructed using synthetic biology, depicting the interactions of Compound A with NP (GOLD, SPION, and CeO2), with GPR142 and GPR119 proteins within the cell. Logisim is helpful for large and complex capacity circuit constructions and simulation of entire logic circuit. Logisim is Java-dependent application [Reference Burch63], where initial values were assigned in the form of 1 and 0 or true and false, using basic input and output universal table. Simulation of GPR142 and GPR119 is shown in Fig. 8 with respect to transition time of all entities and total amount.
Supplementary material
To view supplementary material for this article, please visit https://doi.org/10.1557/jmr.2018.453.
Contributions
A.C.K. and S.S. designed the computational analyses. A.C.K. performed the analysis and network studies. A.C.K., D.Q.W., X.M., Y.L., C.D.L., and S.S. analyzed the data and wrote the paper. All authors reviewed the manuscript.
Acknowledgments
This work is supported by the Key Research Area Grant 2016YFA0501703 from the Ministry of Science and Technology of China, State Key Lab on Microbial Metabolism, and Joint Research Funds for Medical and Engineering & Scientific Research at Shanghai Jiao Tong University. The simulations in this work were supported by the Center for High Performance Computing, Shanghai Jiao Tong University.